


As giants step up their efforts to get involved in Bitcoin, Bitcoin’s financial asset attributes are becoming increasingly strong. Although Bitcoin is considered an independent asset with its own price trend, as Bitcoin further becomes an important part of the global financial system, its correlation with traditional assets will inevitably increase.
From the perspective of more than ten years from 2012 to the present, we explored the degree of correlation between Bitcoin and risk assets (US stocks), safe-haven assets (US bonds and gold), and the global macroeconomic cycle (commodity index). The currency price successfully broke through and stabilized at US$1,000 as the dividing point, focusing on analyzing the correlation between Bitcoin and other assets after 2017.
In the early stage, Bitcoin experienced a period of exploration and imitation. This is because when Bitcoin first appeared, people did not know much about its nature and potential. The value and use of Bitcoin were not clear at this stage, and the mainstream Investors and institutions are wary of it.
However, as time went by, Bitcoin’s decentralization, fixed supply cap and other characteristics attracted more and more attention and trust, allowing Bitcoin to gradually take shape and eventually win mainstream recognition. Especially since 2017, the price of Bitcoin has shown an increasingly strong correlation with four traditional assets such as U.S. stocks, U.S. bonds, gold, and commodities.
From exploration and indetermination to clear positioning and maturity, the evolution of Bitcoin in the past ten years has not only witnessed the curve growth of its price, but also witnessed its increasingly prominent position in the global asset market.

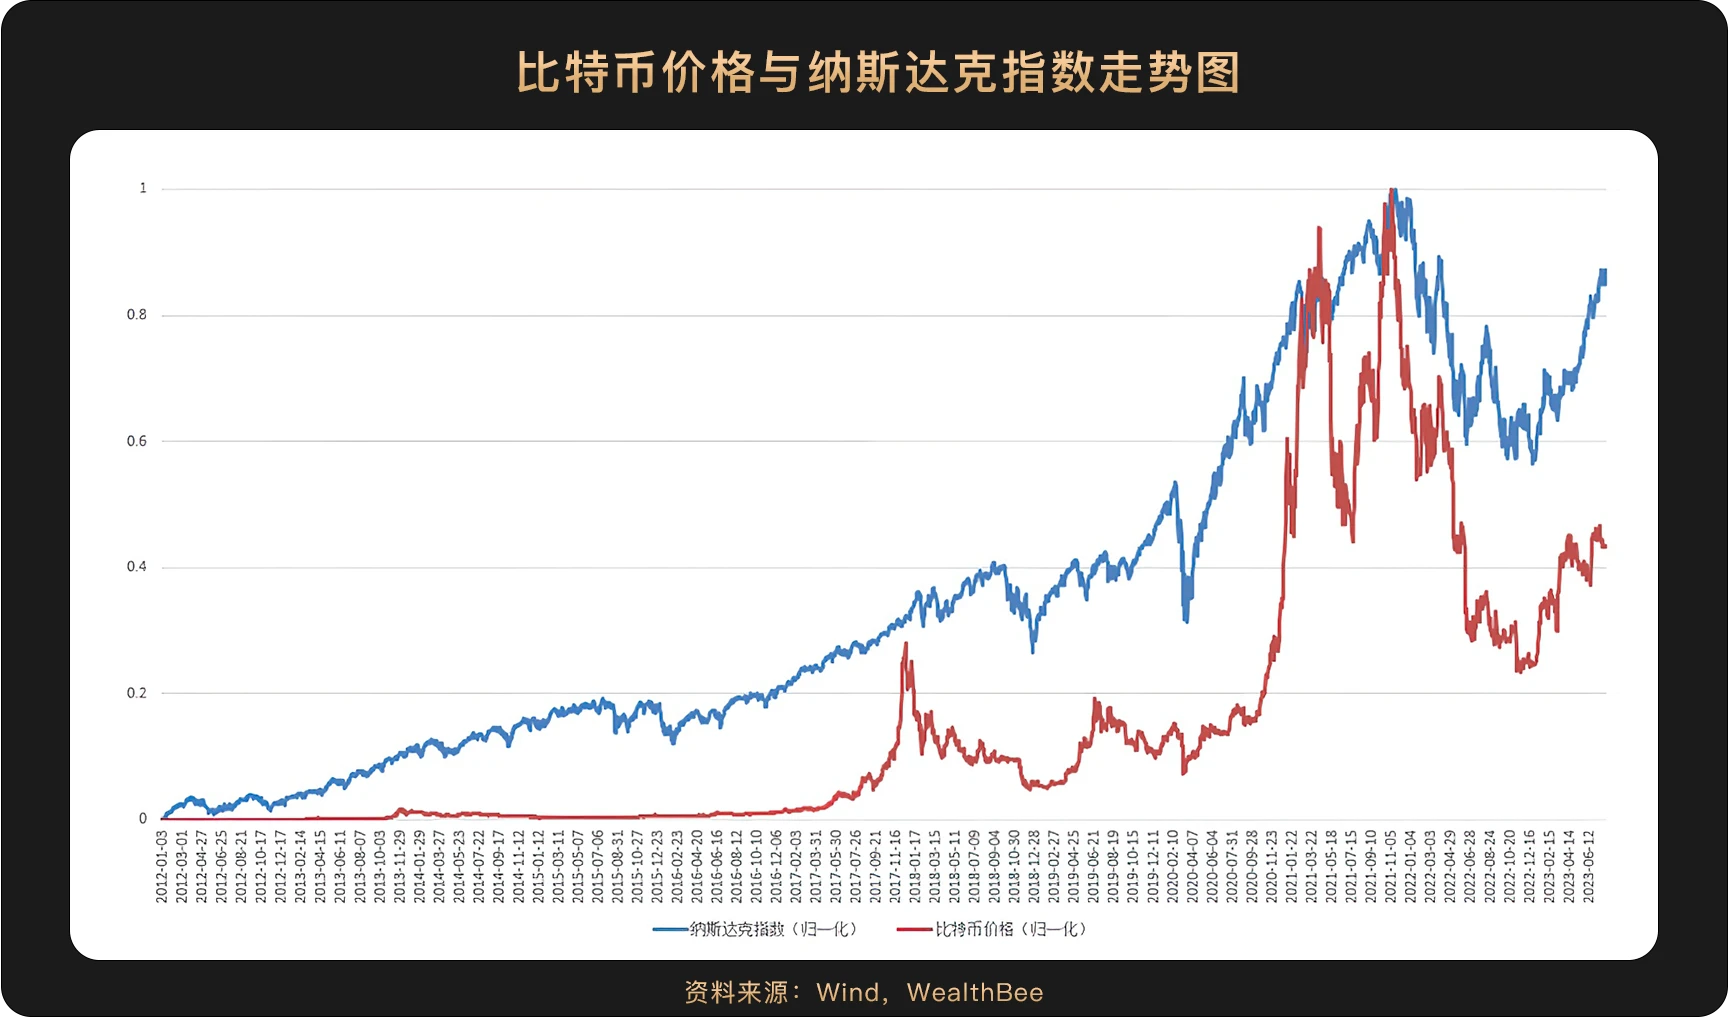
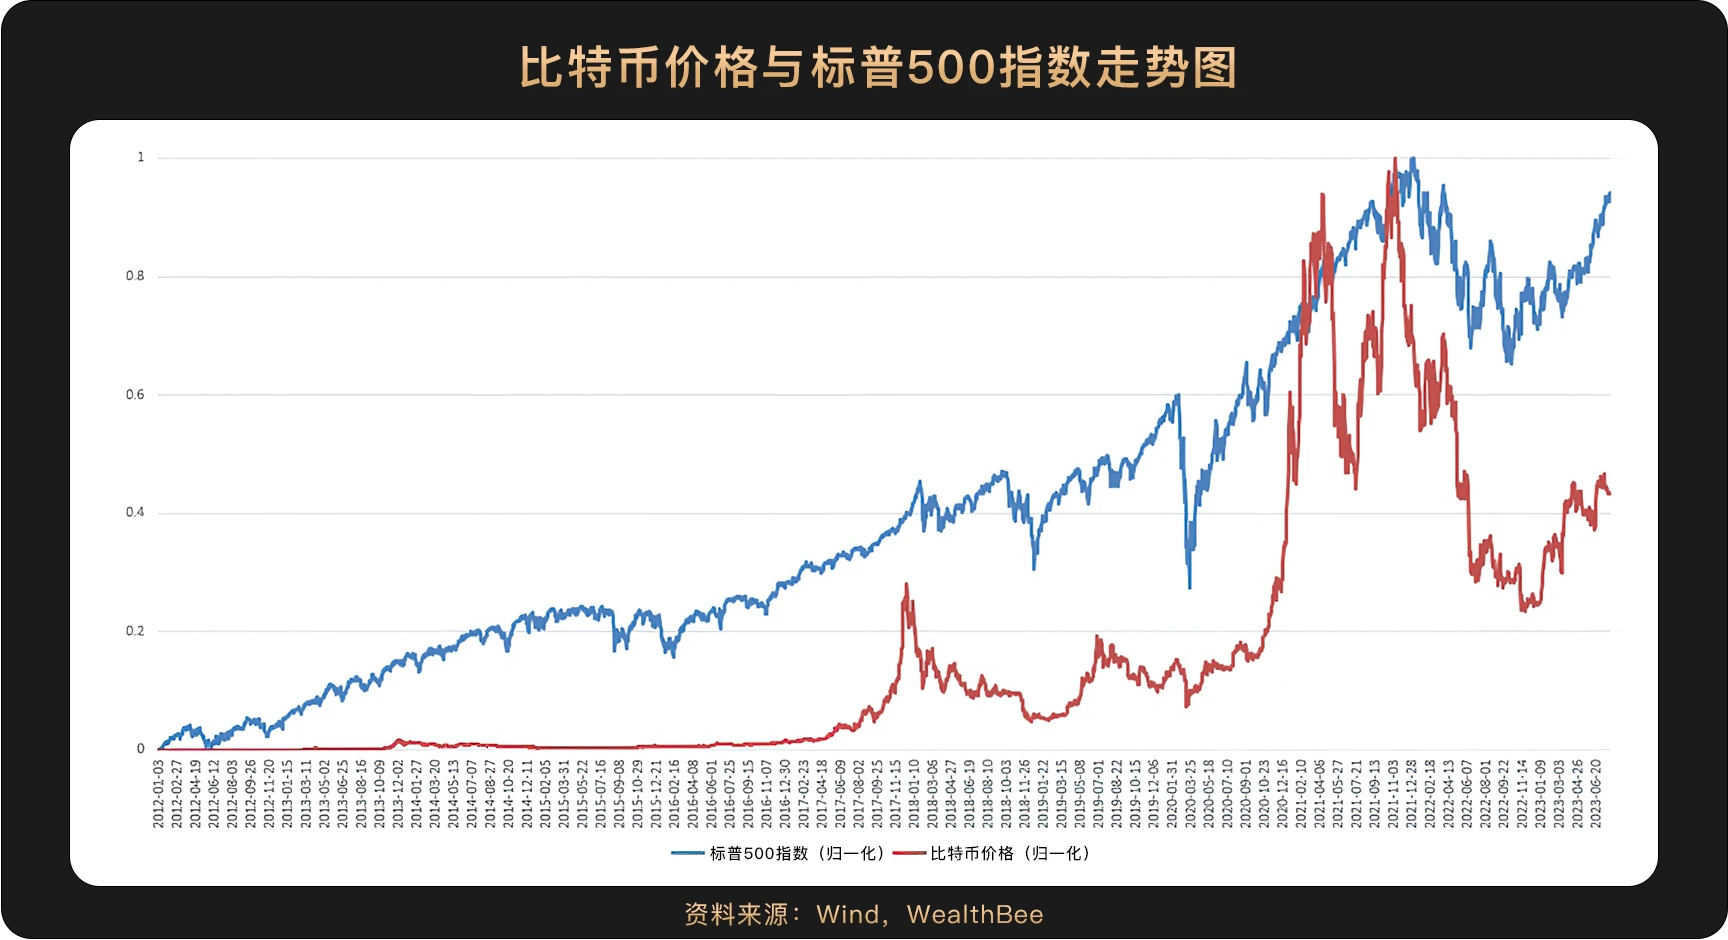
It can be clearly seen from the figure that the US stock index has a high correlation with the price trend of Bitcoin. We took the price of Bitcoin to exceed $1,000 in 2017 as the boundary. After calculation, before 2017, the correlation coefficients between Bitcoin, Nasdaq, and SP 500 were 0.6996 and 0.7217 (Pearson correlation coefficient) respectively.
The two reached stage highs almost simultaneously near the end of 2017, and reached the highest point within the statistical time period near the end of 2021, and then fell and rebounded simultaneously. After 2017, the correlation coefficients between Bitcoin and Nasdaq and SP 500 are 0.8528 and 0.8787 (Pearson correlation coefficient) respectively. Comparing the two, we can find that the correlation between Bitcoin and US stocks is gradually strengthening. After 2017, the correlation coefficients are all greater than 0.8, which belongs to the strong correlation category.

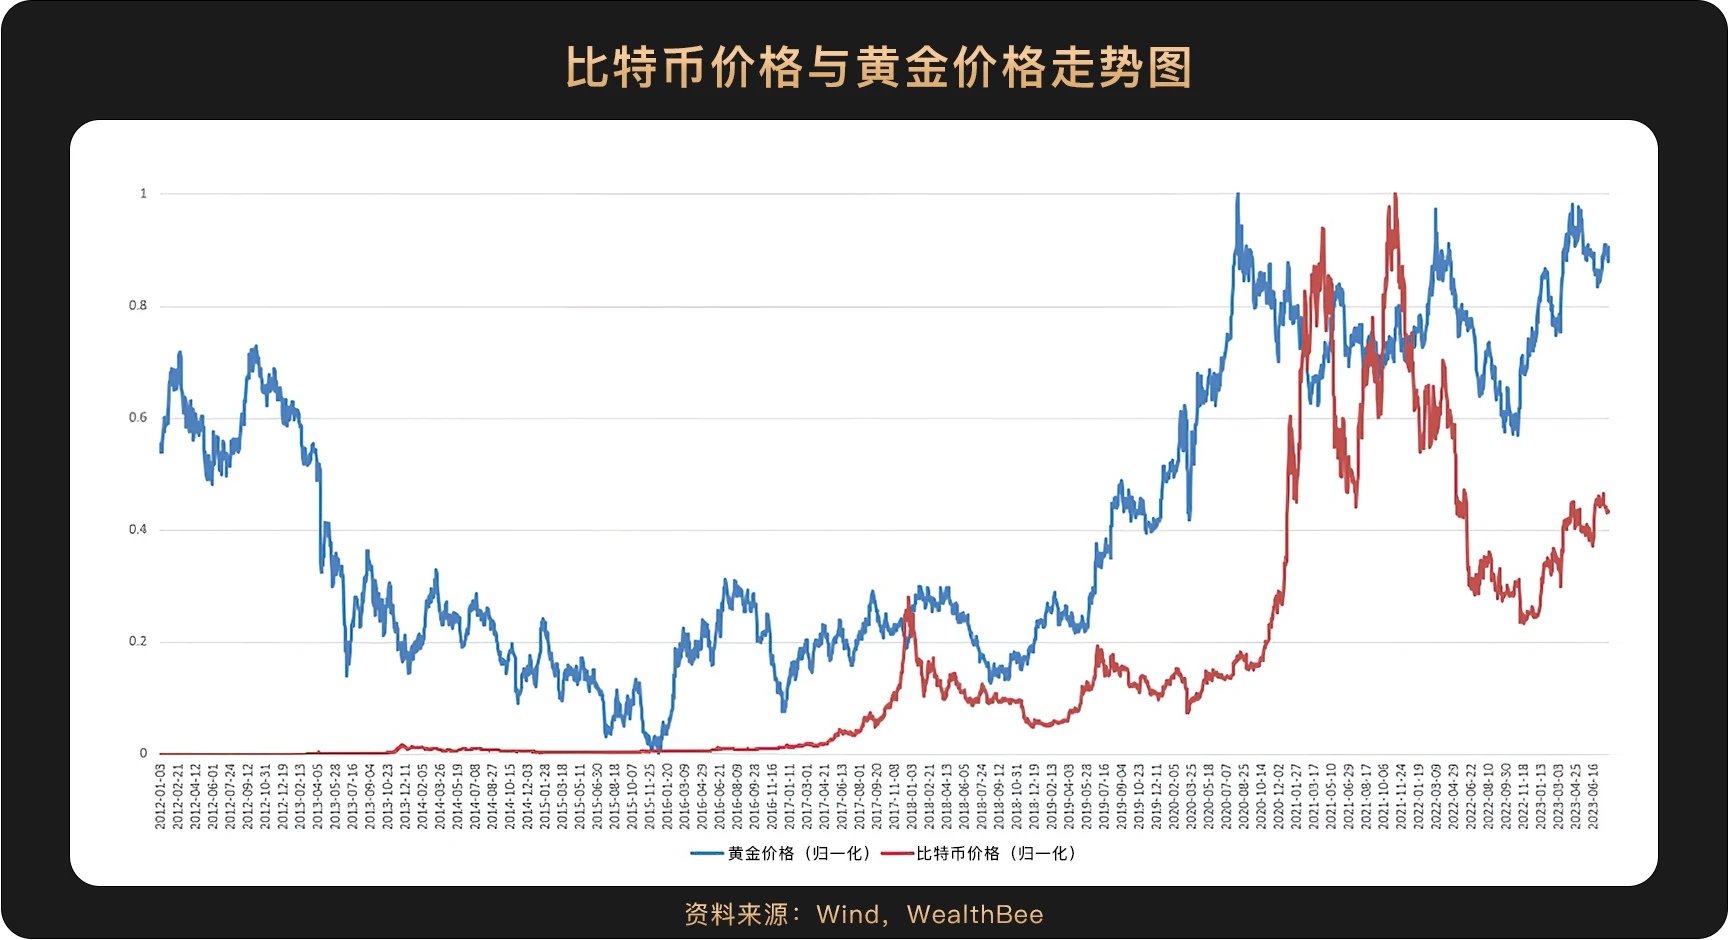
We choose London spot gold (XAU) as the anchor for gold price trends for analysis. Gold is a typical safe-haven asset. From the chart, the price of gold was gradually decreasing before 2016, but the price of Bitcoin was slowly increasing. Subsequently, the two trends showed convergence, and both reached stage highs in 2018. In August 2020, the price of gold reached its highest point and then fell back, but the price of Bitcoin rose rapidly afterwards and entered a bull market. The peak of Bitcoin price is exactly the periodic trough of gold price (2021). But after November 2022, both bottomed out and rebounded at the same time, showing consistency in trend.
Similarly, we choose 2017 as the watershed. Before 2017, the correlation coefficient between the two was -0.6202, which is a relatively obvious negative correlation trend; after 2017, the correlation coefficient between the two is 0.6889 (Pearson correlation coefficient), which is a medium-term trend. degree of linear correlation.

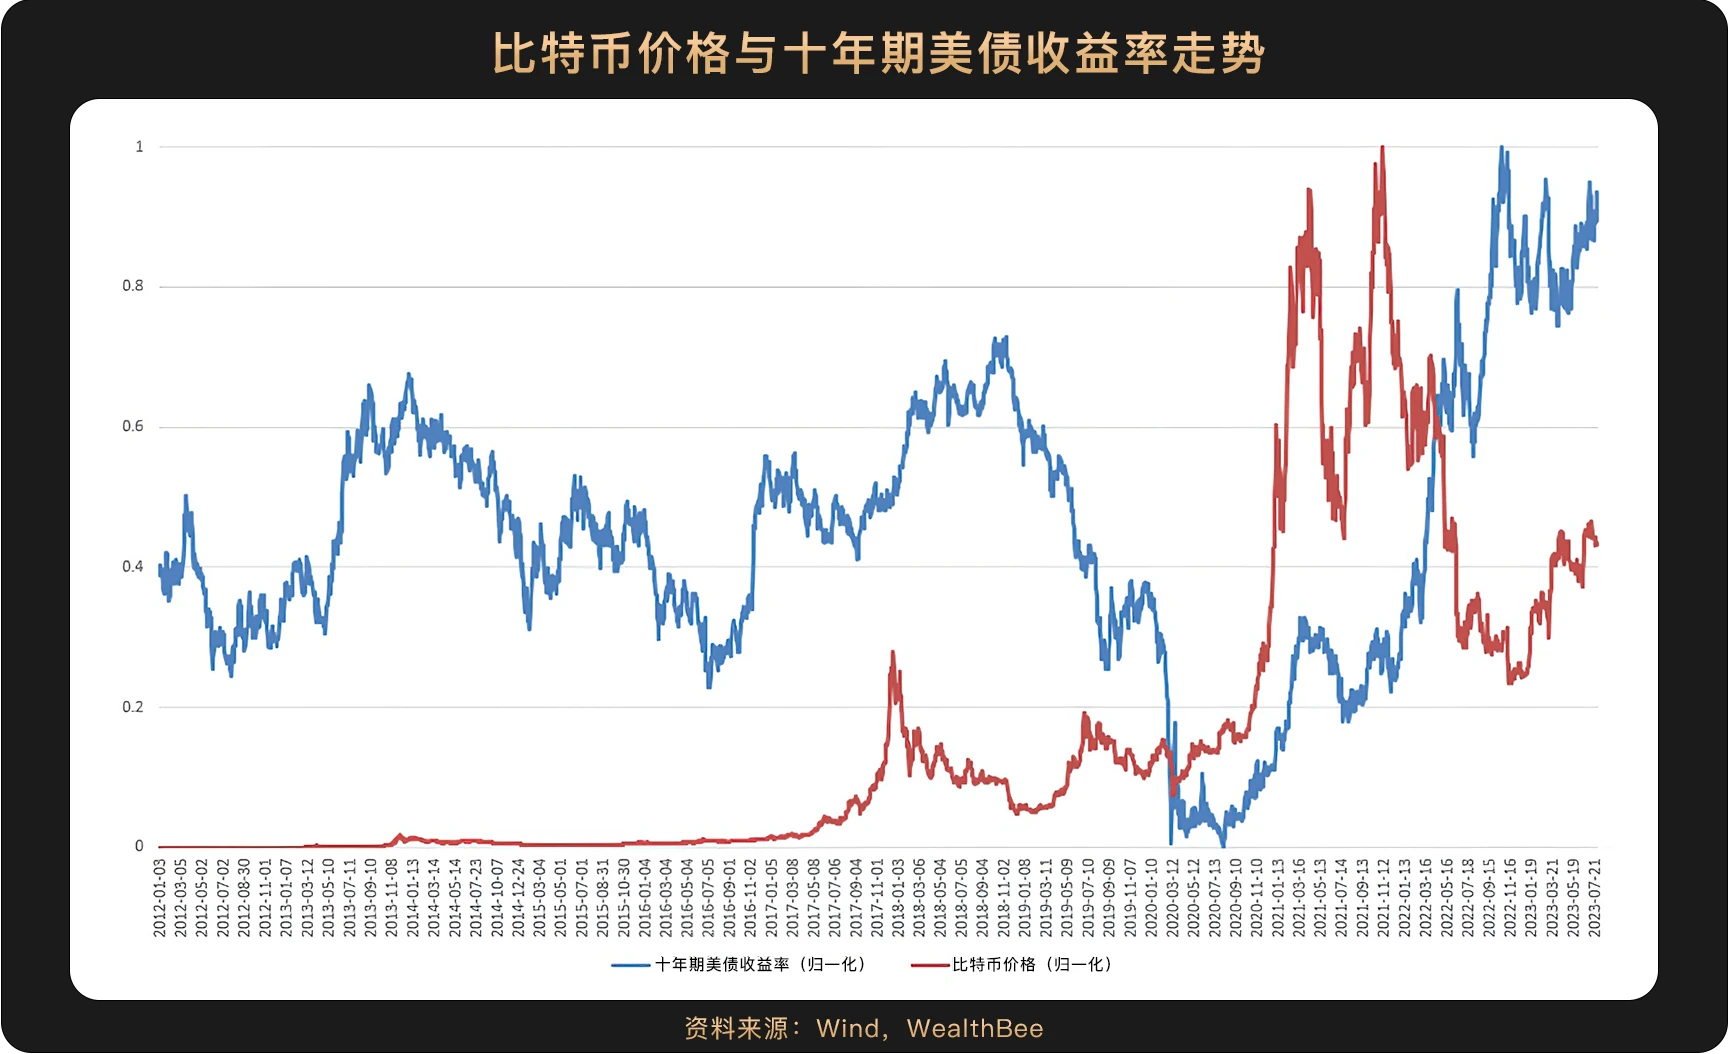
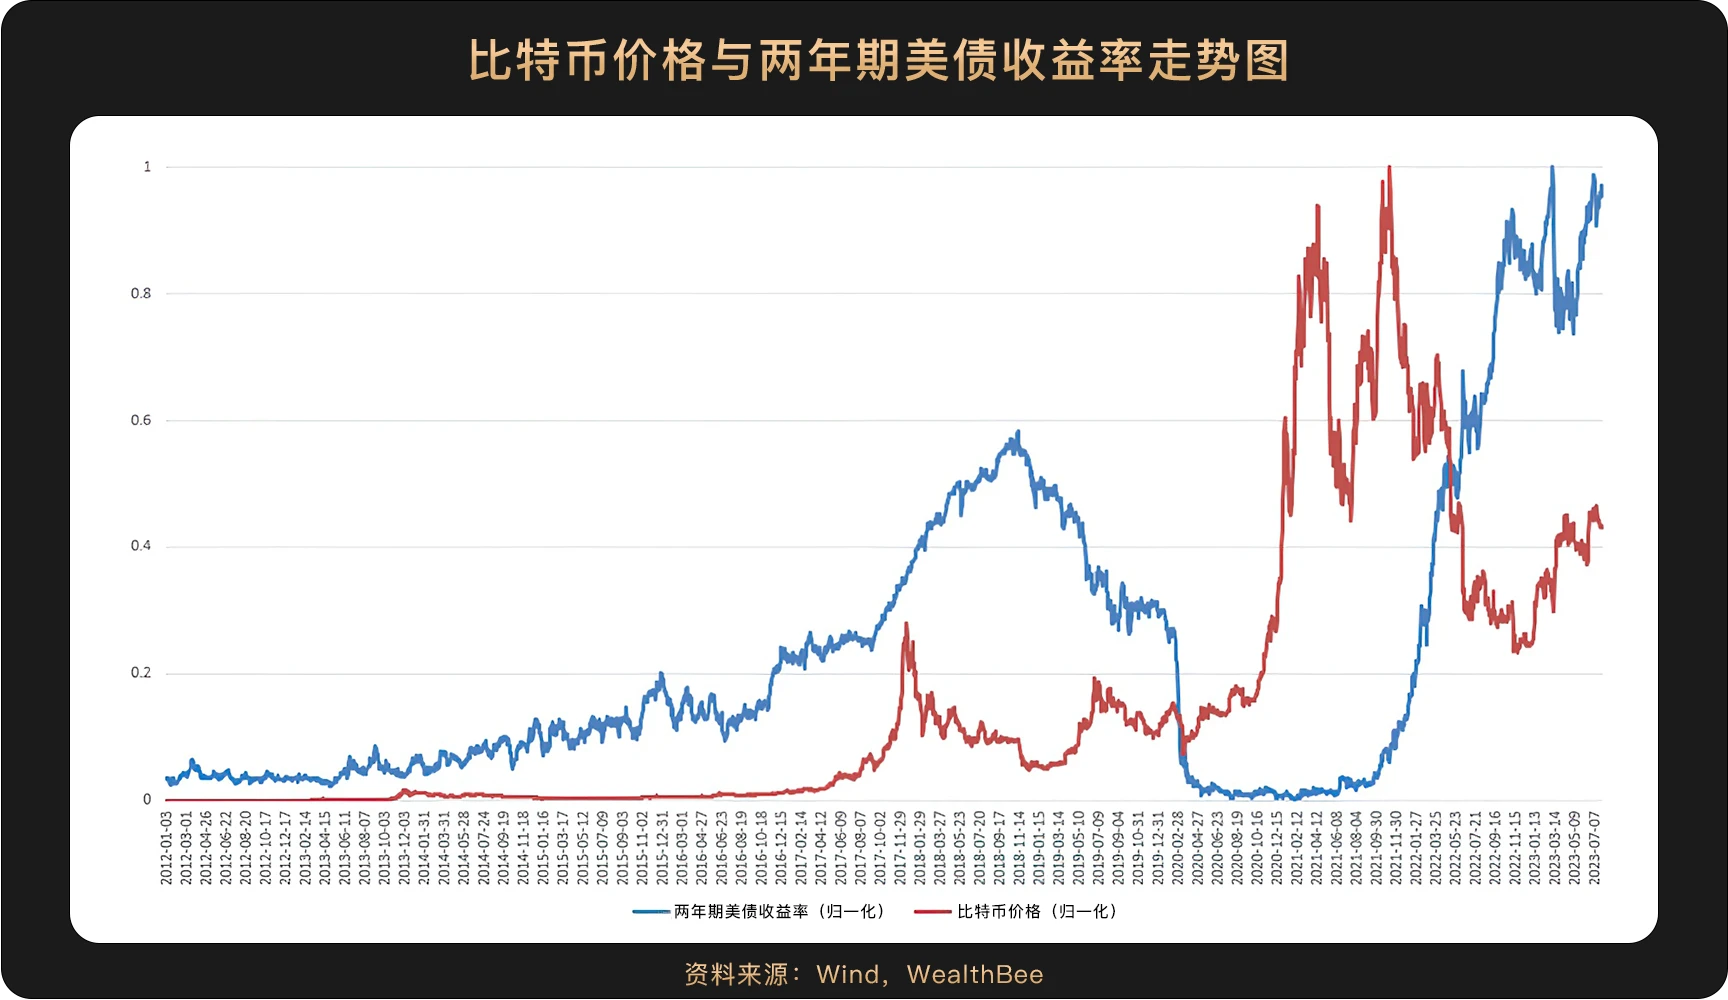
We selected the most representative ten-year and two-year U.S. Treasury bonds, approximately assuming that they represent the medium- and long-term risk-free interest rates and the short- and medium-term risk-free interest rates respectively. U.S. bonds, like gold, are typical safe-haven assets. It can be seen from the figure that both the ten-year and two-year yields have a poor correlation with the price of Bitcoin. Especially for two-year U.S. bonds, the 20-year and 21-year yields are extremely low, but the price of Bitcoin has been rising all the way. Testing the correlation between the two after 2017, the correlation coefficients between Bitcoin and the ten-year U.S. bond and the two-year U.S. bond are -0.1382 and -0.1756 (Pearson correlation coefficient) respectively, which belongs to the category of low correlation, and the two shows a negative correlation.

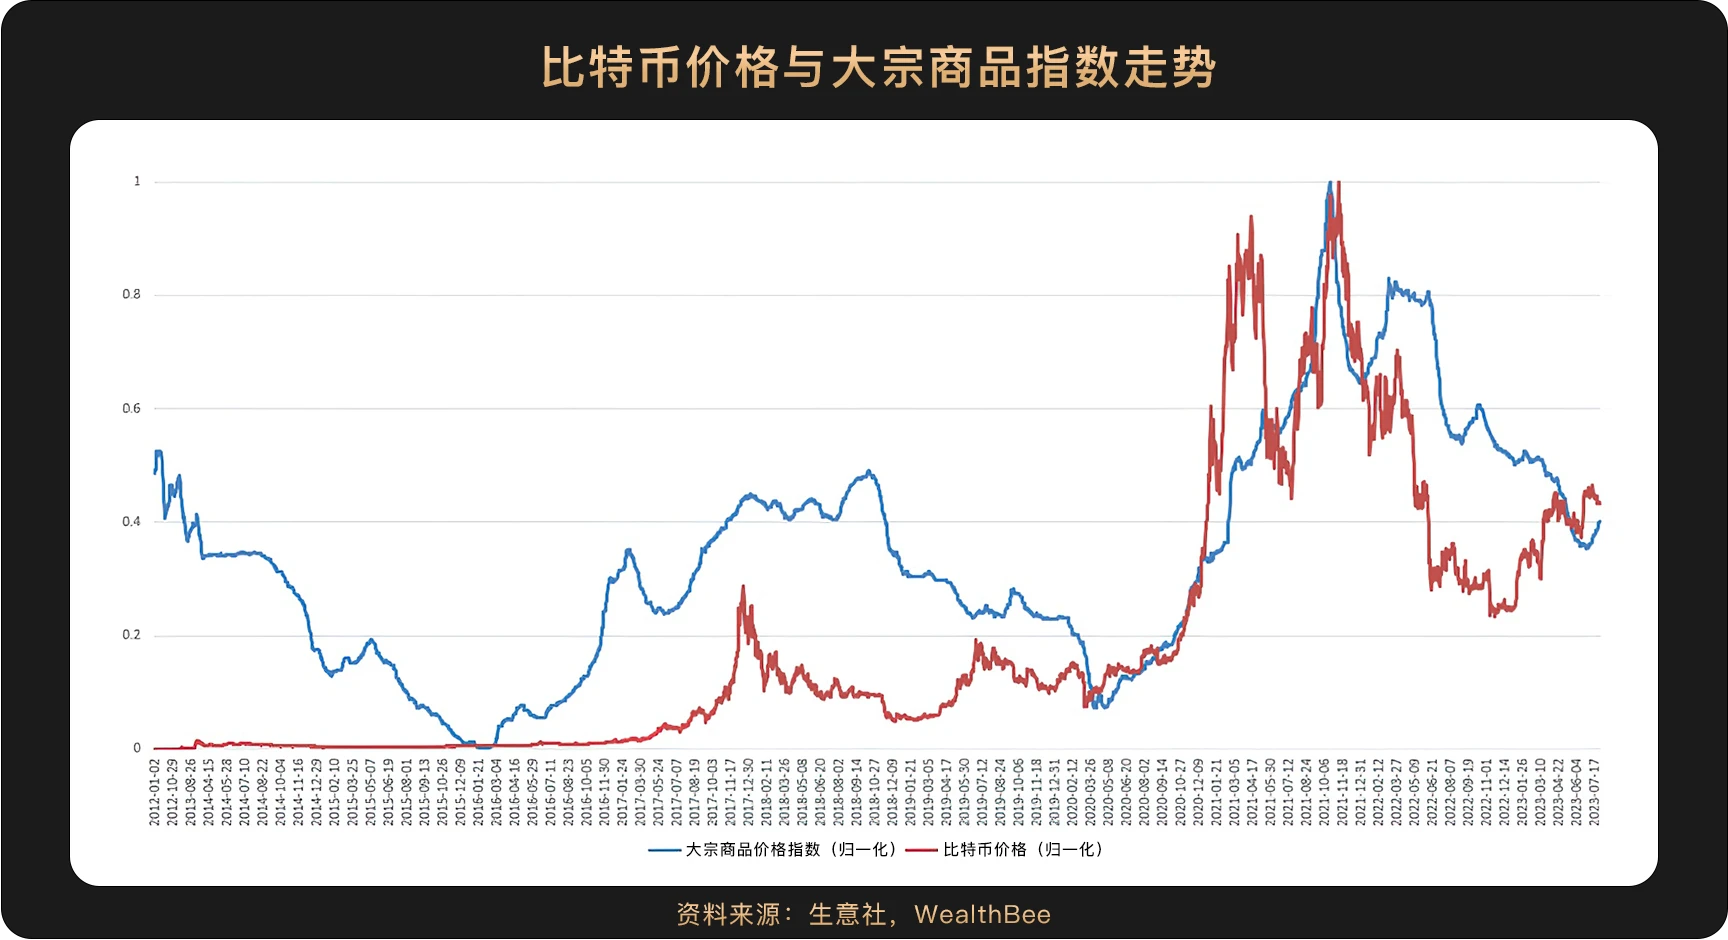
Commodity prices are affected by many factors, but they can roughly reflect the global macroeconomic cycle. As can be seen from the figure, the correlation between the two is high. They both continued to rise after bottoming out in the first half of 2020, reached their highest point at almost the same time in November 2021, and finally began to fall simultaneously. The correlation test shows that the correlation coefficient between the two after 2017 is 0.7184 (Pearson correlation coefficient), which belongs to medium and high correlation.

According to the above calculation and analysis, after 2017, the ranking of the correlation between Bitcoin and other assets is U.S. stocks > commodities > gold > U.S. bonds, with high correlation with risk assets and macroeconomics, but less correlation with safe-haven assets Lower sex. Therefore, we can consider Bitcoin to be a risky asset.
Fundamentally speaking, the price change of a financial product is affected by two aspects: fundamental changes and market risk appetite. When the global economy improves, that is, commodity prices rise, market risk appetite naturally increases, so Bitcoin also rises together with other risk assets such as U.S. stocks. The U.S. economy has continued to be strong recently, coupled with the widespread application of large AI models, it will become the main driving force for productivity improvement in the next 10 to 20 years. With productivity improvement, interest rate cuts will make it easier to accommodate more liquidity. Therefore, we have There are reasons to believe that the risk appetite of global investors will gradually increase, and more investment funds will flow into the market. At that time, the price of Bitcoin will most likely perform.
Copyright statement: If you need to reprint, please add the assistant WeChat to communicate. If you reprint or wash the manuscript without permission, we will reserve the right to pursue legal responsibility.
Disclaimer: The market is risky, so investment needs to be cautious. Readers are requested to strictly abide by local laws and regulations when considering any opinions, views or conclusions in this article. The above content does not constitute any investment advice.


