


Original author:Alice Kohn,Glassnode
Original compilation: Luccy, BlockBeats
Editors note: Glassnode summarized and analyzed the hot market data in the past week and pointed out that the number of Ethereum pledge validators withdrawing from the pool has gradually increased recently, resulting in a slowdown in the growth rate of ETH issuance. At the same time, the surge in network activity, especially the promotion of token transfers and stablecoins, has led to an increase in transaction demand, which in turn has exerted upward pressure on gas prices, and the daily destruction of ETH fees through EIP 1559 has also increased. The combination of these two forces has caused the global ETH supply to once again show a deflationary trend.
The growth of the Ethereum validator set has slowed in recent weeks, with more and more validators opting out. This resulted in a slowdown in Ethereum issuance. At the same time, as the amount of Ethereum burned through EIP 1559 continues to increase, coupled with the growth of network activity, the supply of Ethereum is once again showing a deflationary trend.
Summary
Since October, Ethereum staking pools have experienced a significant trend change, signaling an increasing number of validators opting out. This change correlates with the broader bullish trend in the digital asset market as a whole.
The increase in validator withdrawals has led to a decrease in daily Ethereum issuance, which is related to the amount of active Ethereum in the staking pool.
At the same time, we have observed an increase in network activity due to the renewed focus on tokens and stablecoins. This is manifested in the increase in gas fees burned through EIP 1559, triggering a deflation of the Ethereum supply.
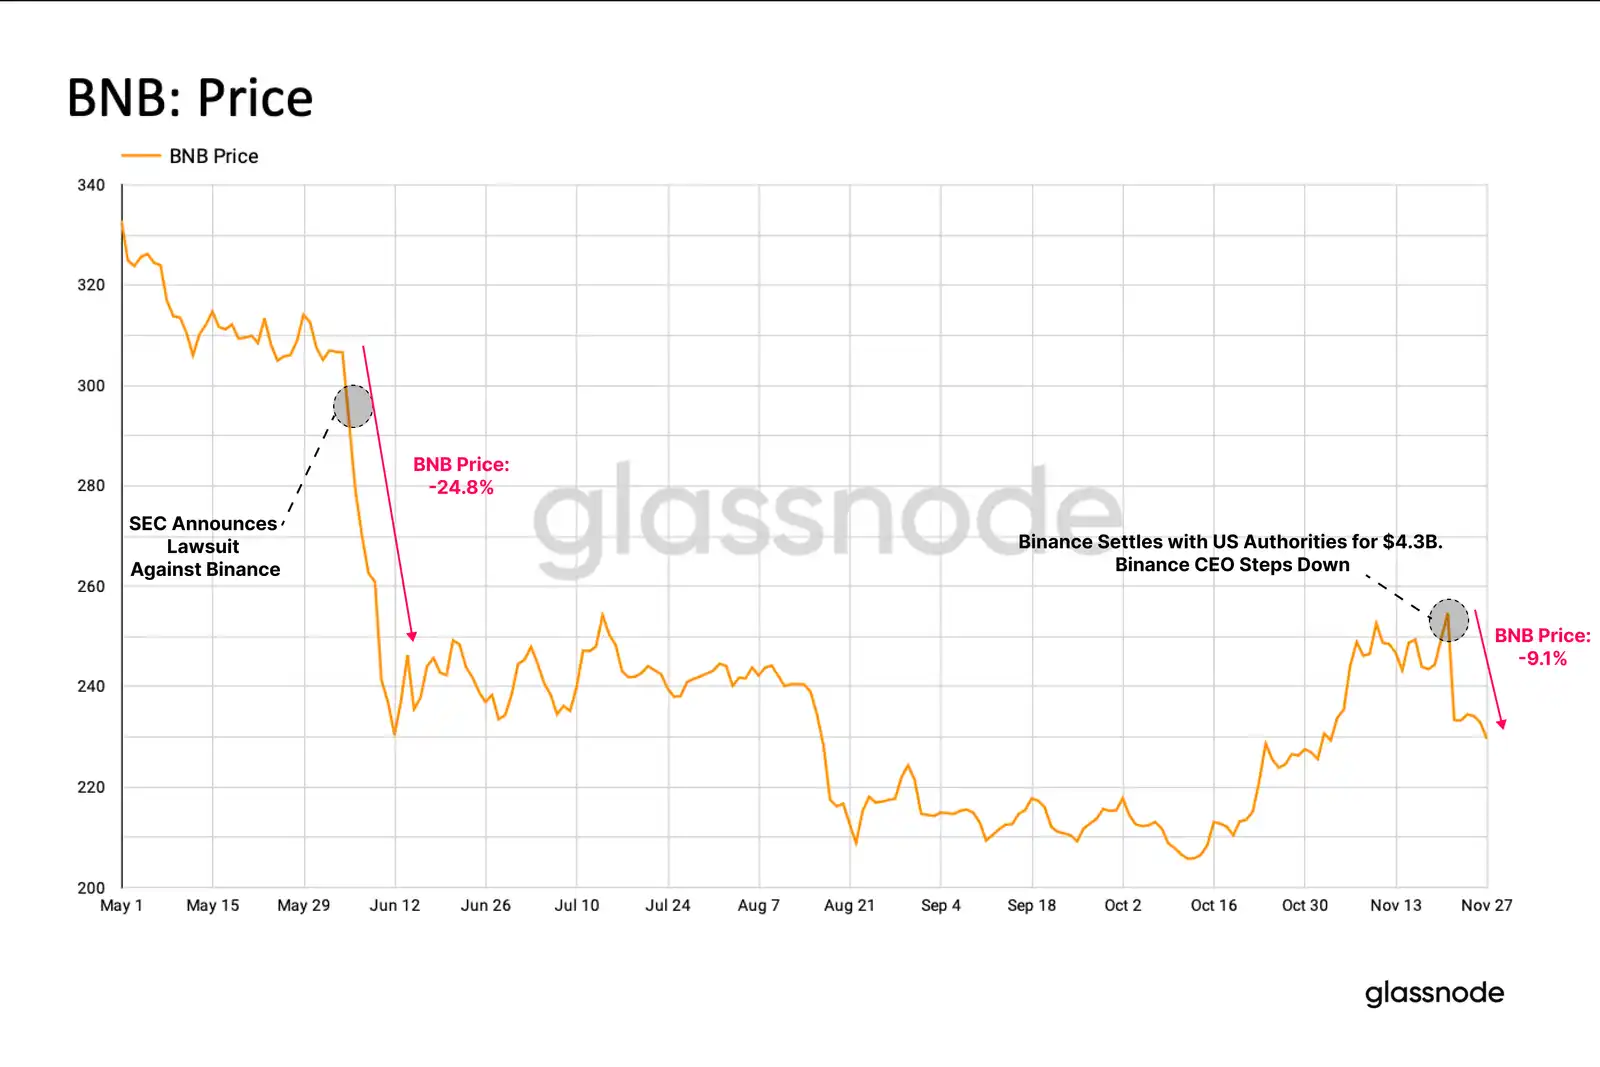
Undoubtedly, the most notable news of the past week was the resignation of Binance CEO CZ. The settlement with authorities amounted to $4.3 billion, a pivotal event that many viewed as marking the end of the “Wild West” era for the digital asset industry.
Following the announcement, BNB’s price experienced a -9.1% drop. However, compared to previous price drops, such as the -24% drop when the SEC announced its charges, the market reaction was relatively muted.
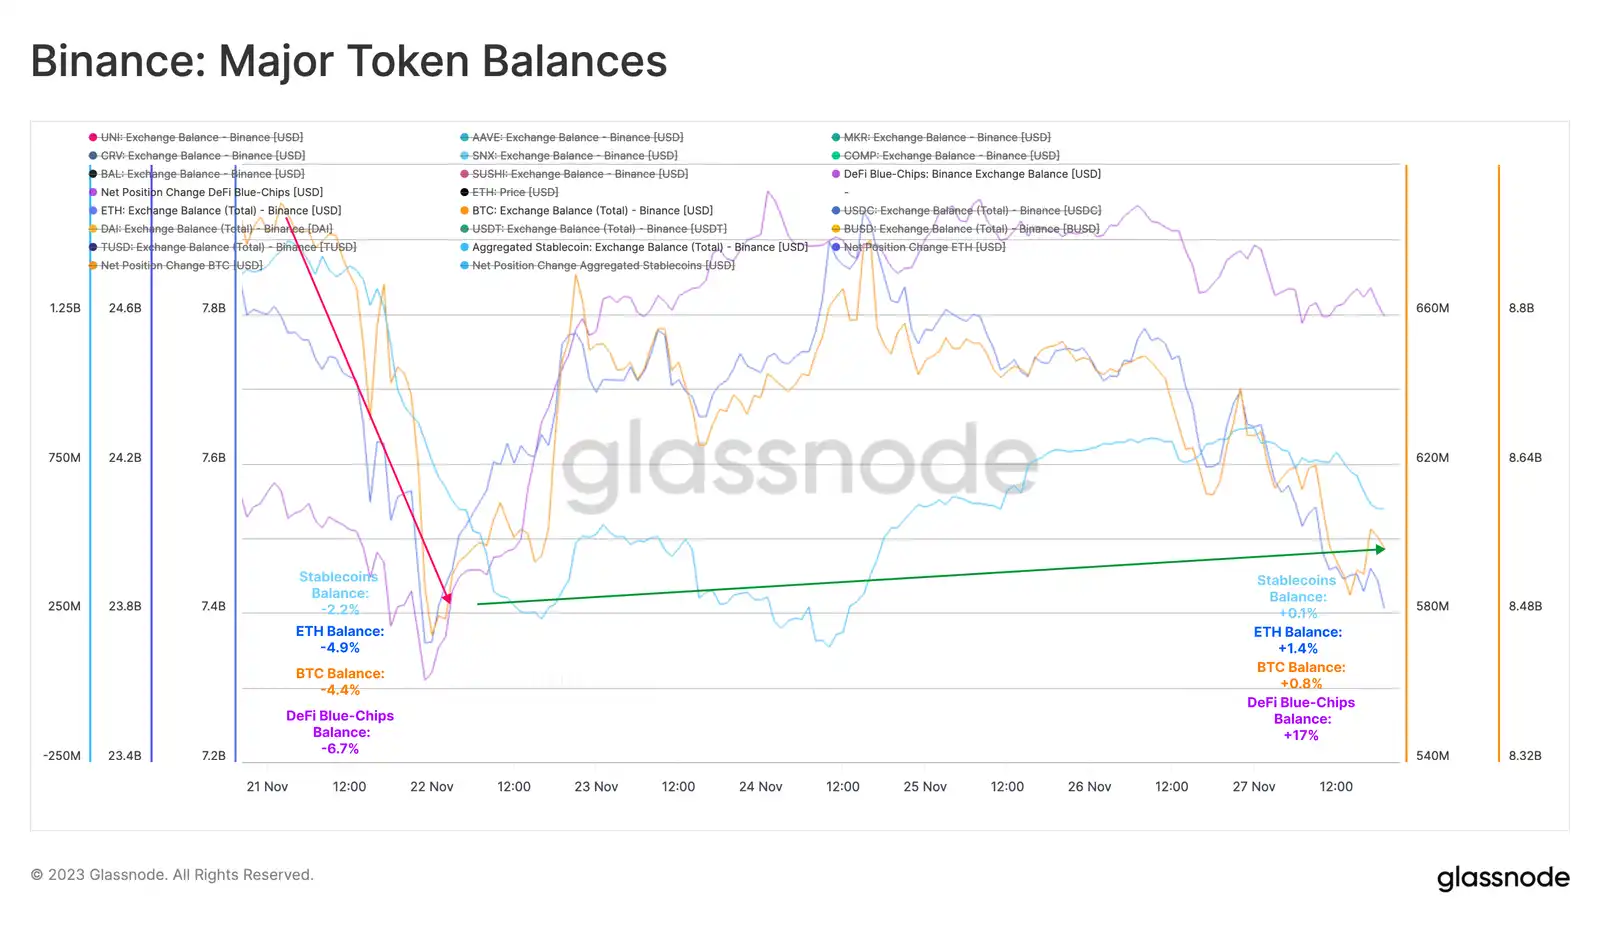
Following this news, the Binance exchange saw a rise in withdrawal activity for the main asset. In the first 24 hours, the combined balance of a range of DeFi blue chips fell by -6.7%, while the balances of BTC, ETH and stablecoins fell by -4.4%, -4.9% and -2.2% respectively.
However, in the six days following CZ’s resignation, these trading balances have recovered, with all four token categories seeing outflows slowing and even seeing net inflows. In many ways, this shows the level of trust users have in the Binance platform. It can also be argued that confidence may increase further given the regulatory requirements from U.S. regulators over the next three years.
Validator exits
While not making as much headlines as the Binance settlement, the Ethereum staking pool has experienced significant changes since early October. Currently, more and more validators are exiting the staking pool.
Staking withdrawals were enabled in Shanghai, and validators subsequently exited en masse, claiming rewards and readjusting their staking providers and settings. During this time, exit events averaged 309 validators per day.
Since early October, we have seen a gradual increase in exit events, reaching an average of 1018 validators per day. This upward trend is consistent with the recent upward trend in spot prices in the digital asset market.
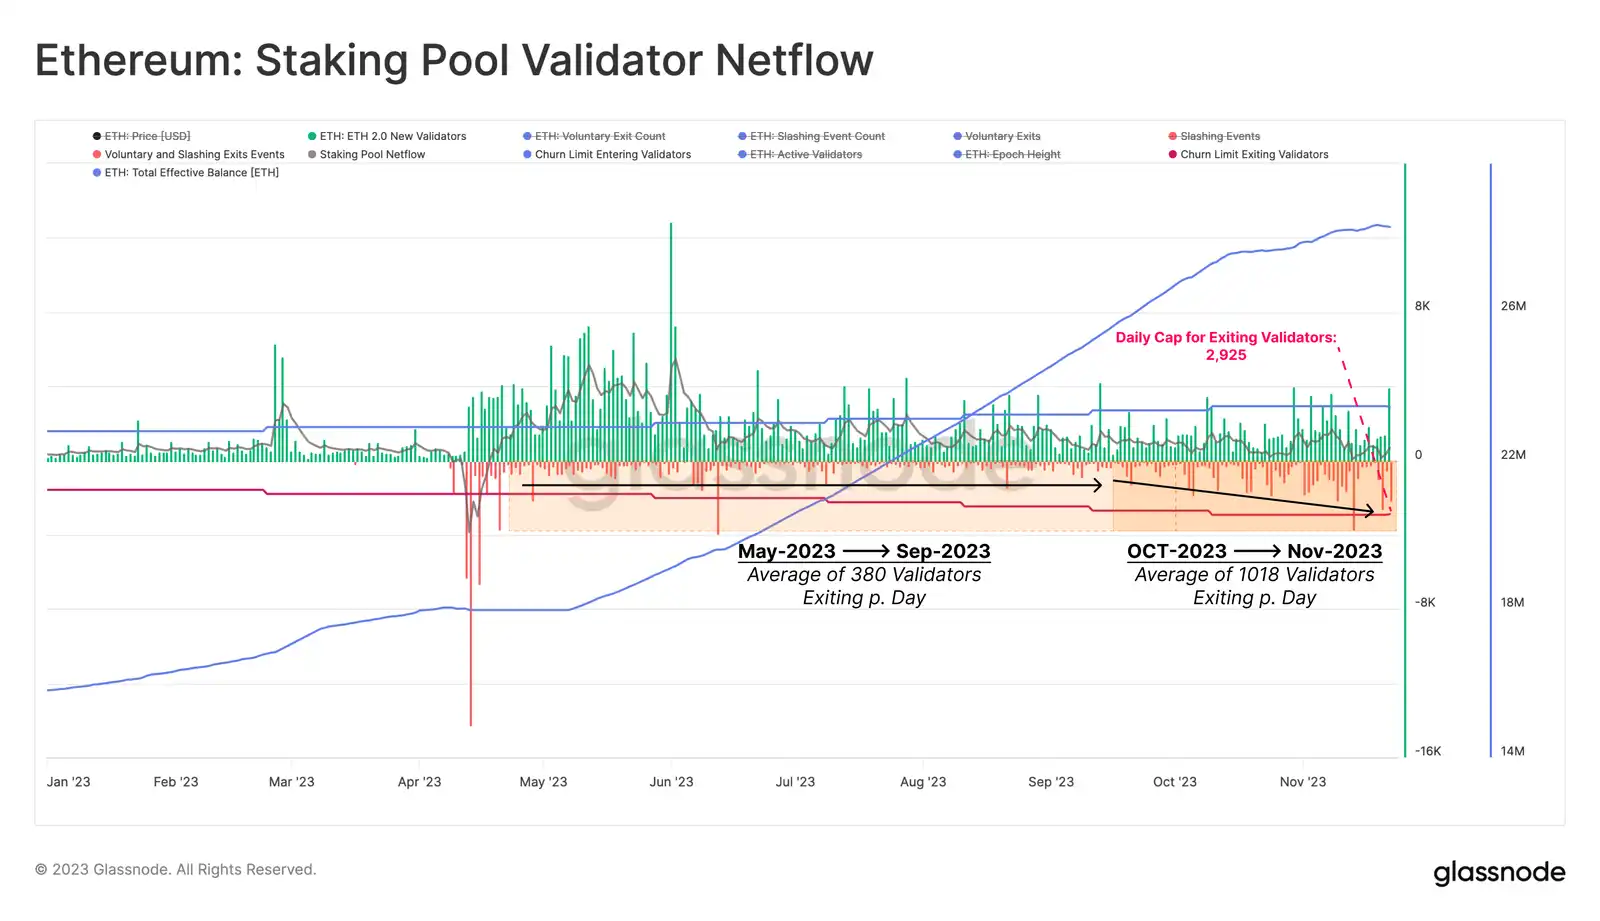
As a result, the total effective balance of ETH representing active participation in the proof-of-stake consensus in the staking pool has slowed in growth and is currently experiencing its first decline since the Shanghai upgrade.
The growth slope of total effective balances began to flatten in mid-October, increasing by an average of 0.1% to 1% per day, slowing the rate of growth by more than half since May.
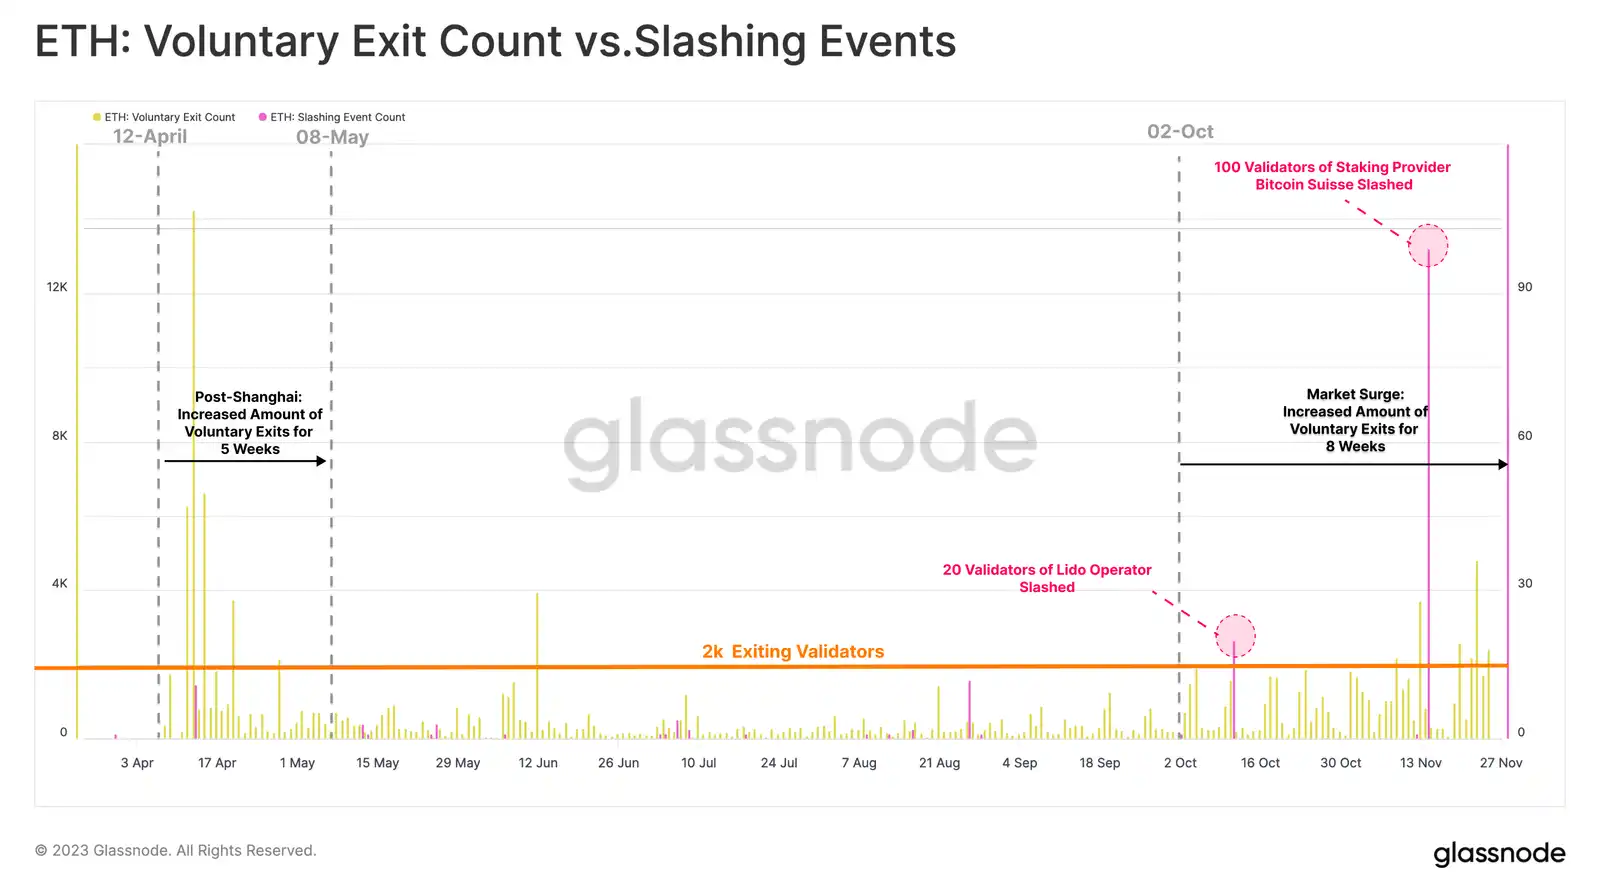
When examining exiting validators in more detail, we can see that over the past eight weeks, it has been primarily driven by voluntary exits. Voluntary withdrawal refers to those stakeholders who independently choose to withdraw from the staking pool. This is different from the punishment faced by validators who violate the rules of the protocol - slashing.
During the same time period, only two reduction events occurred, one of which was a major event involving 100 newly entered validators who were reduced from signing two different blocks on the network at the same time.
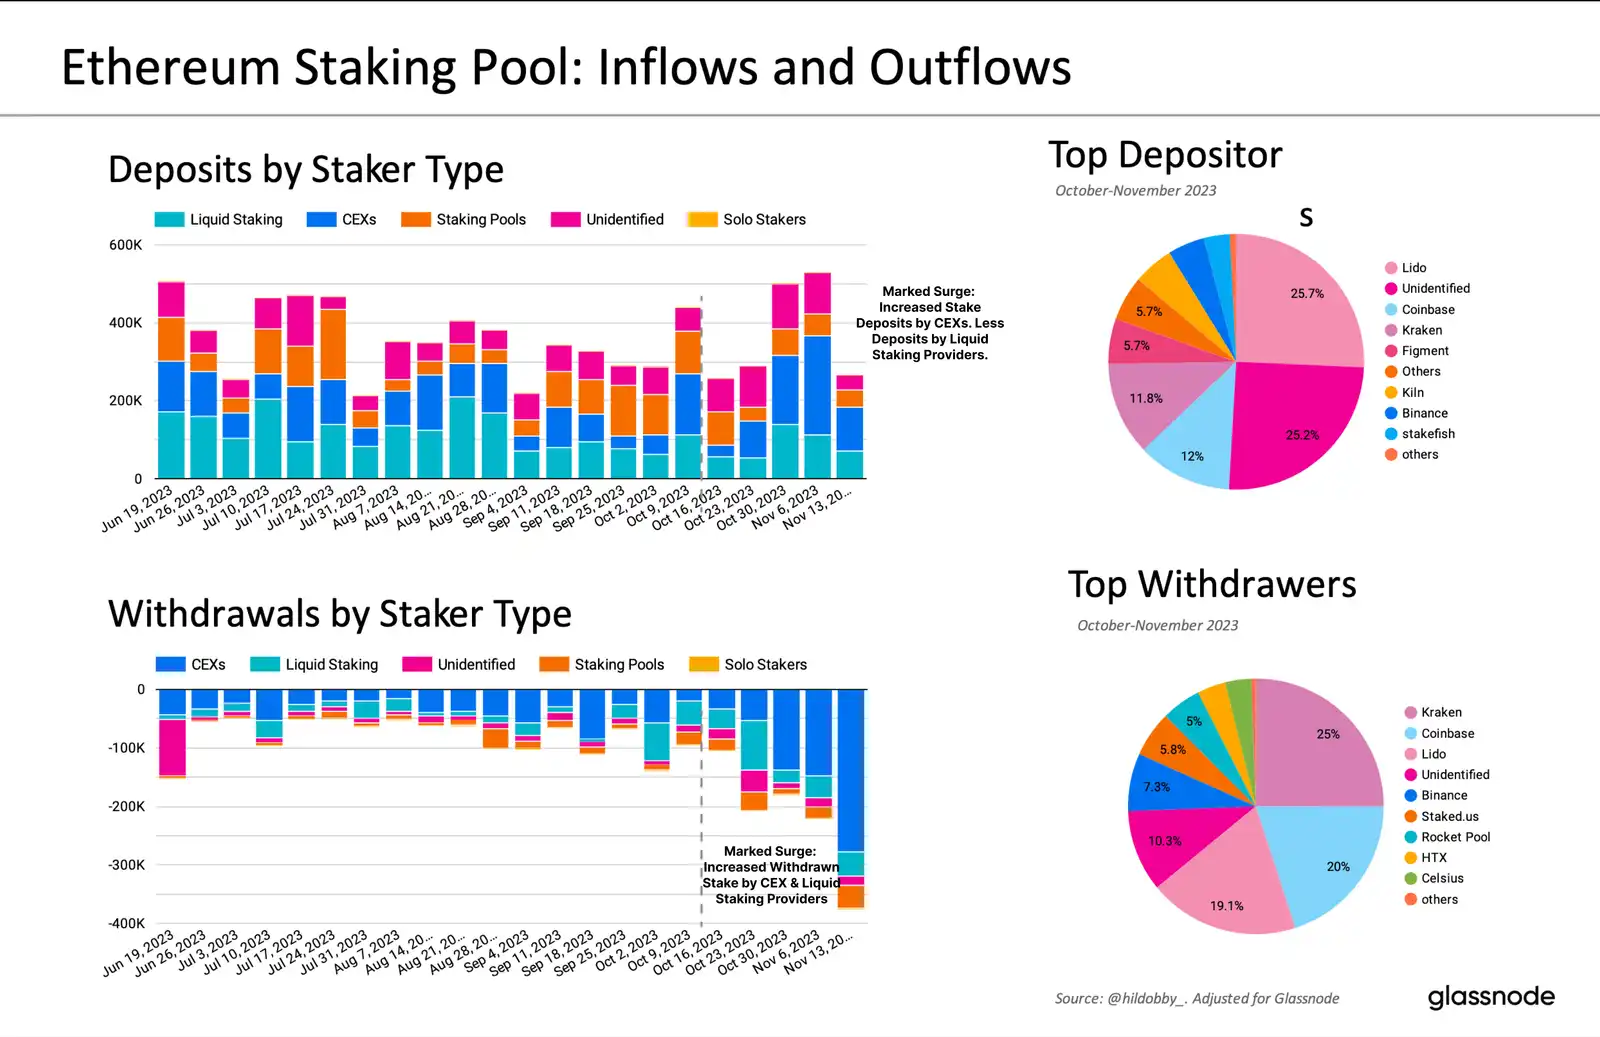
Exited validators can be further classified according to the staker type they belong to. This reveals some interesting trends:
· CEXs have been dominating staking withdrawal events since October, with Kraken and Coinbase seeing the most notable outflows.
· Liquid staking providers also experienced some mild staking reductions, with Lido remaining the largest player in the space.
This investor behavior may be driven by a number of factors:
· Investors choose to change their staking settings, such as moving staking from a CEX to a liquid staking provider (possibly due to ongoing regulatory concerns).
· Investors with access to U.S. capital markets may move capital toward safer assets, such as U.S. Treasuries, as interest rates remain high relative to ETH staking returns.
· Investors may also be looking for greater liquidity in ETH holdings in anticipation of an upcoming market rally, rather than less liquid staked ETH.
Kraken and Coinbase stand out in terms of withdrawals, while among liquid staking providers, Lido leads the way in terms of withdrawals. However, these same entities, led by Lido, are also the primary recipients of pledged deposits, demonstrating the net stickiness and dominance of these large pools.
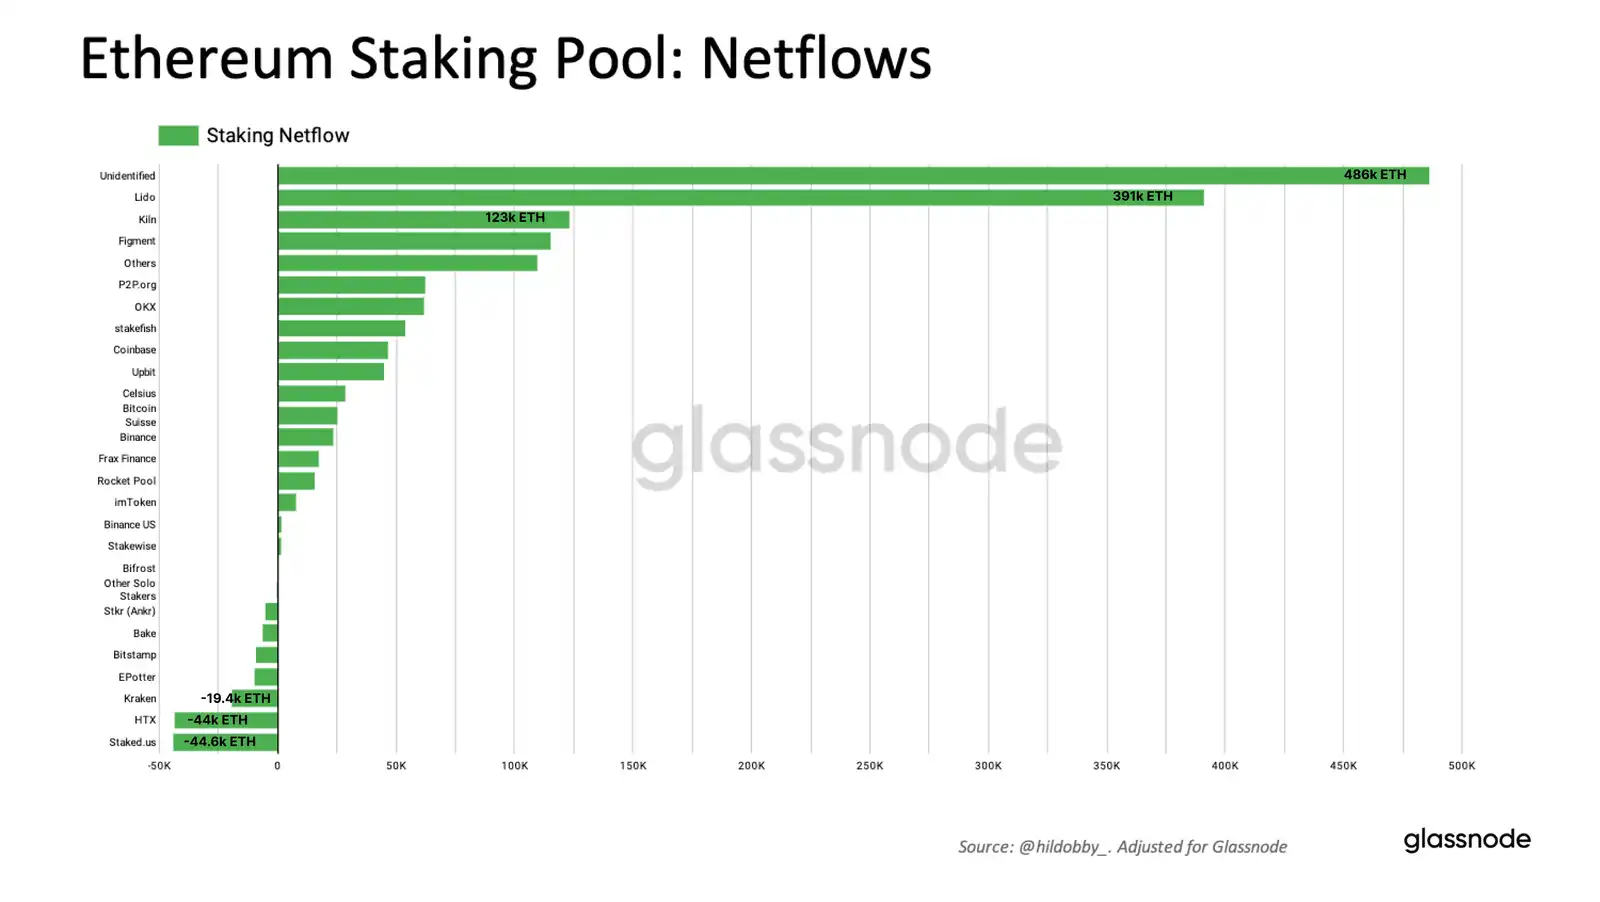
On a net change basis, Lido continues to grow and dominate, with its total staked balance increasing by 468,000 ETH. On the CEX side, Coinbase and Binance saw net increases in staked balances, while Kraken saw a decrease of 19,400 ETH. Among staking providers, HTX and Staked.us demonstrated the most significant reductions in staking balances, each losing over 44,000 ETH.
Consistent with the observed decrease in effective balances, there has been a corresponding decrease in the issuance of ETH. The amount of ETH issued to validators each day depends on the number of active validators or, respectively, the total effective balance in the staking pool.
As the growth rate of validators slows and declines, the daily issuance of ETH also slows accordingly. Over the past seven days, the growth rate of ETH issuance has slowed by as much as 0.5% per day. Notably, the issuance pace has dropped for the first time in recent days.
With the rate of issuance declining, we now turn our attention to the complementary side of the equation – the rate of destruction. Starting with the London hard fork in 2021, EIP 1559s fee burning mechanism involves burning part of the transaction fees, creating conditions for the ETH supply to become tight as network usage increases.
As gas prices rise, signaling increased transaction demand on the Ethereum network, the amount of ETH fees burned each day also increases. In October, we saw daily ETH burn fees reaching 899 ETH. Fast forward almost a month and the cumulative fees burned have now reached 5,368 ETH.
We can also evaluate the detailed breakdown of gas usage between various transaction types. These metrics allow us to identify activities that primarily lead to supply destruction.
After examining the two areas that have primarily driven adoption of the Ethereum network over the past four months, it is clear that both NFT trading and DeFi trading have contributed relatively little over the past four months, down -3% and -57% respectively. %. Both areas are experiencing declining adoption and contribute very little to the latest activity on the chain.

The recent surge in network activity has been largely attributed to token transfers and stablecoins. Over the past three months, token gas usage has increased by +8.2%, while stablecoin gas usage has increased by +19%. This suggests a capital-light rotation into longer-tail assets may be taking place as confidence in market strength grows.
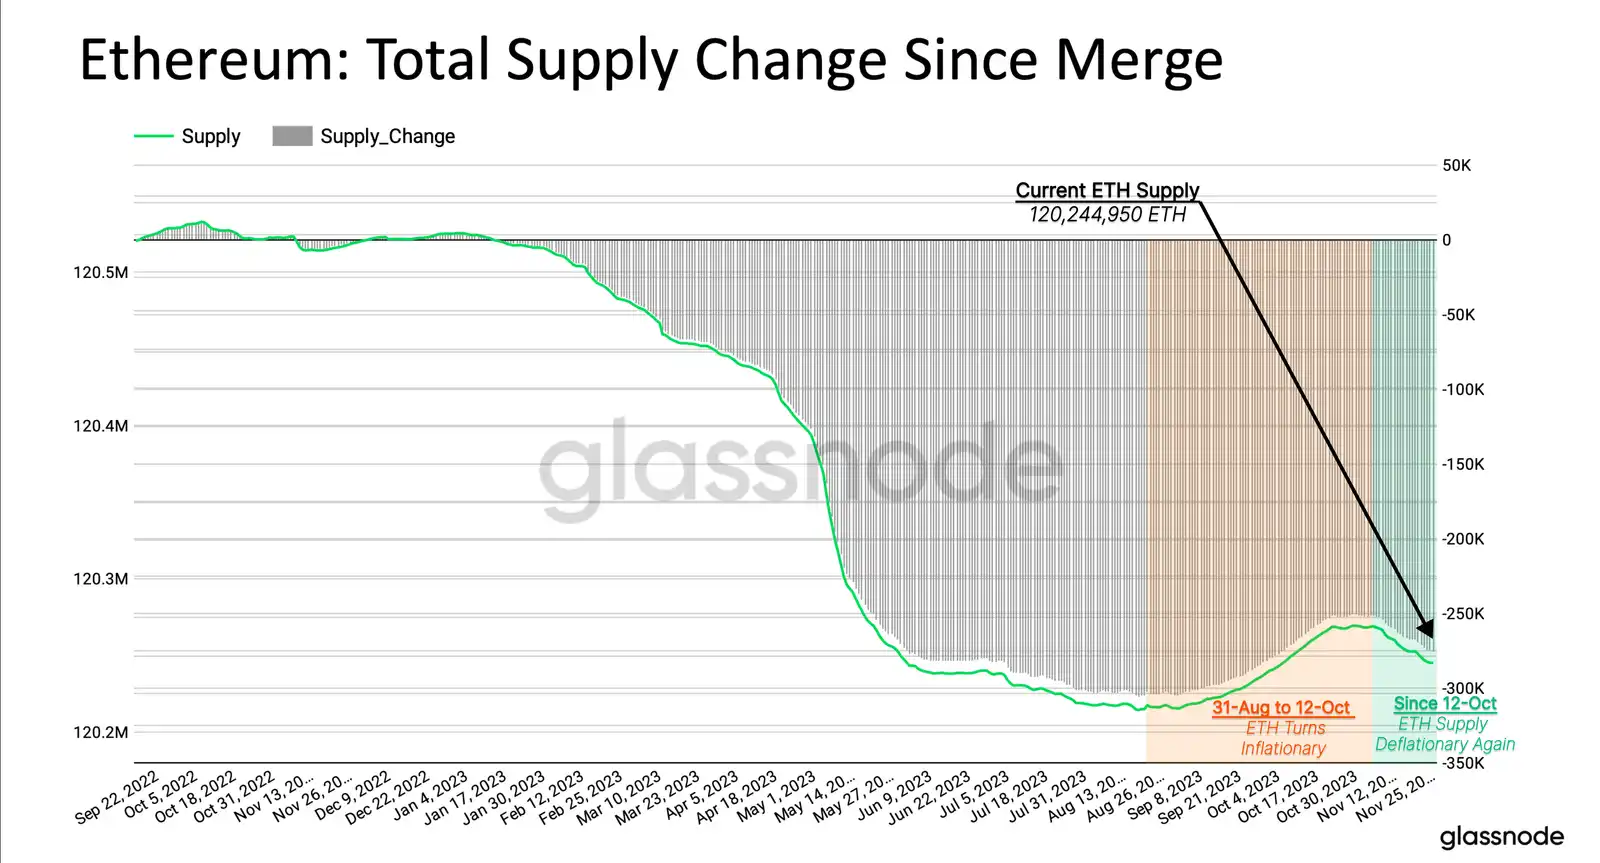
Since the London hard fork, ETH has moved from a net inflationary state to an equilibrium state, or even absolute or deflationary. The network experienced a brief period of net inflation between August and October due to lower network activity.
In recent weeks, overall ETH supply has once again turned net deflationary as issuance rates have slowed and larger amounts of supply have been destroyed.
Summarize
Ethereum staking pool dynamics have changed significantly in recent weeks, with the number of validators exiting the pool starting to increase. This resulted in a slowdown in the growth of ETH issuance and a reduction in staking pool balances for the first time since the Shanghai upgrade.
Additionally, the recent surge in network activity, especially driven by token transfers and stablecoins, has led to increased transaction demand. This in turn puts upward pressure on gas prices, with an increase in the daily fee for ETH burned through EIP 1559.
The combination of these two forces has caused another deflation in the global ETH supply. In this context, the interplay of these factors highlights the dynamic response of the Ethereum network, supply, and to market activity and adoption trends.


