


Market Overview
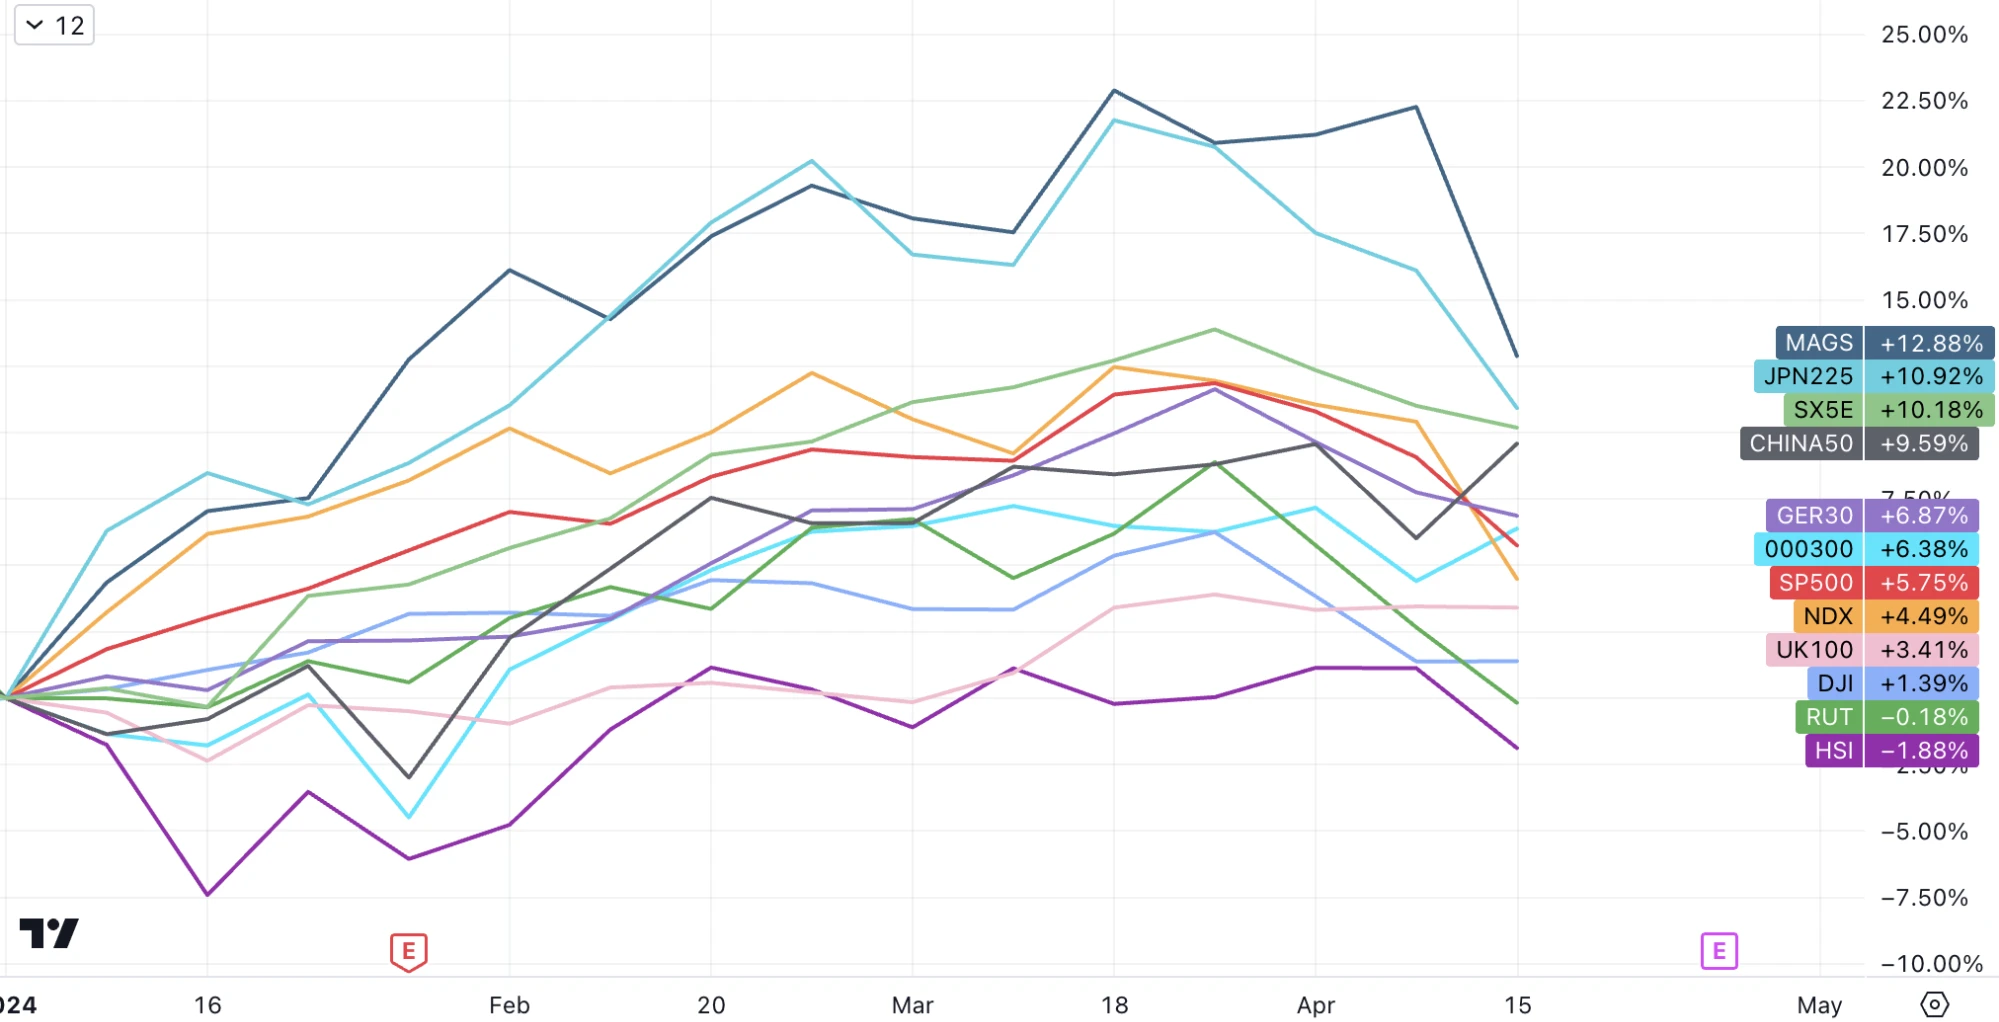
The Nasdaq and SP indices fell sharply in the past week and fell below their respective 50-day moving averages, suffering their worst week in more than a year. After the pullback in the past three weeks, the US and Japanese stock markets have basically given up half of their gains. The performance of the SP 500 and Nasdaq 100 this year has been lower than that of the CSI 300:
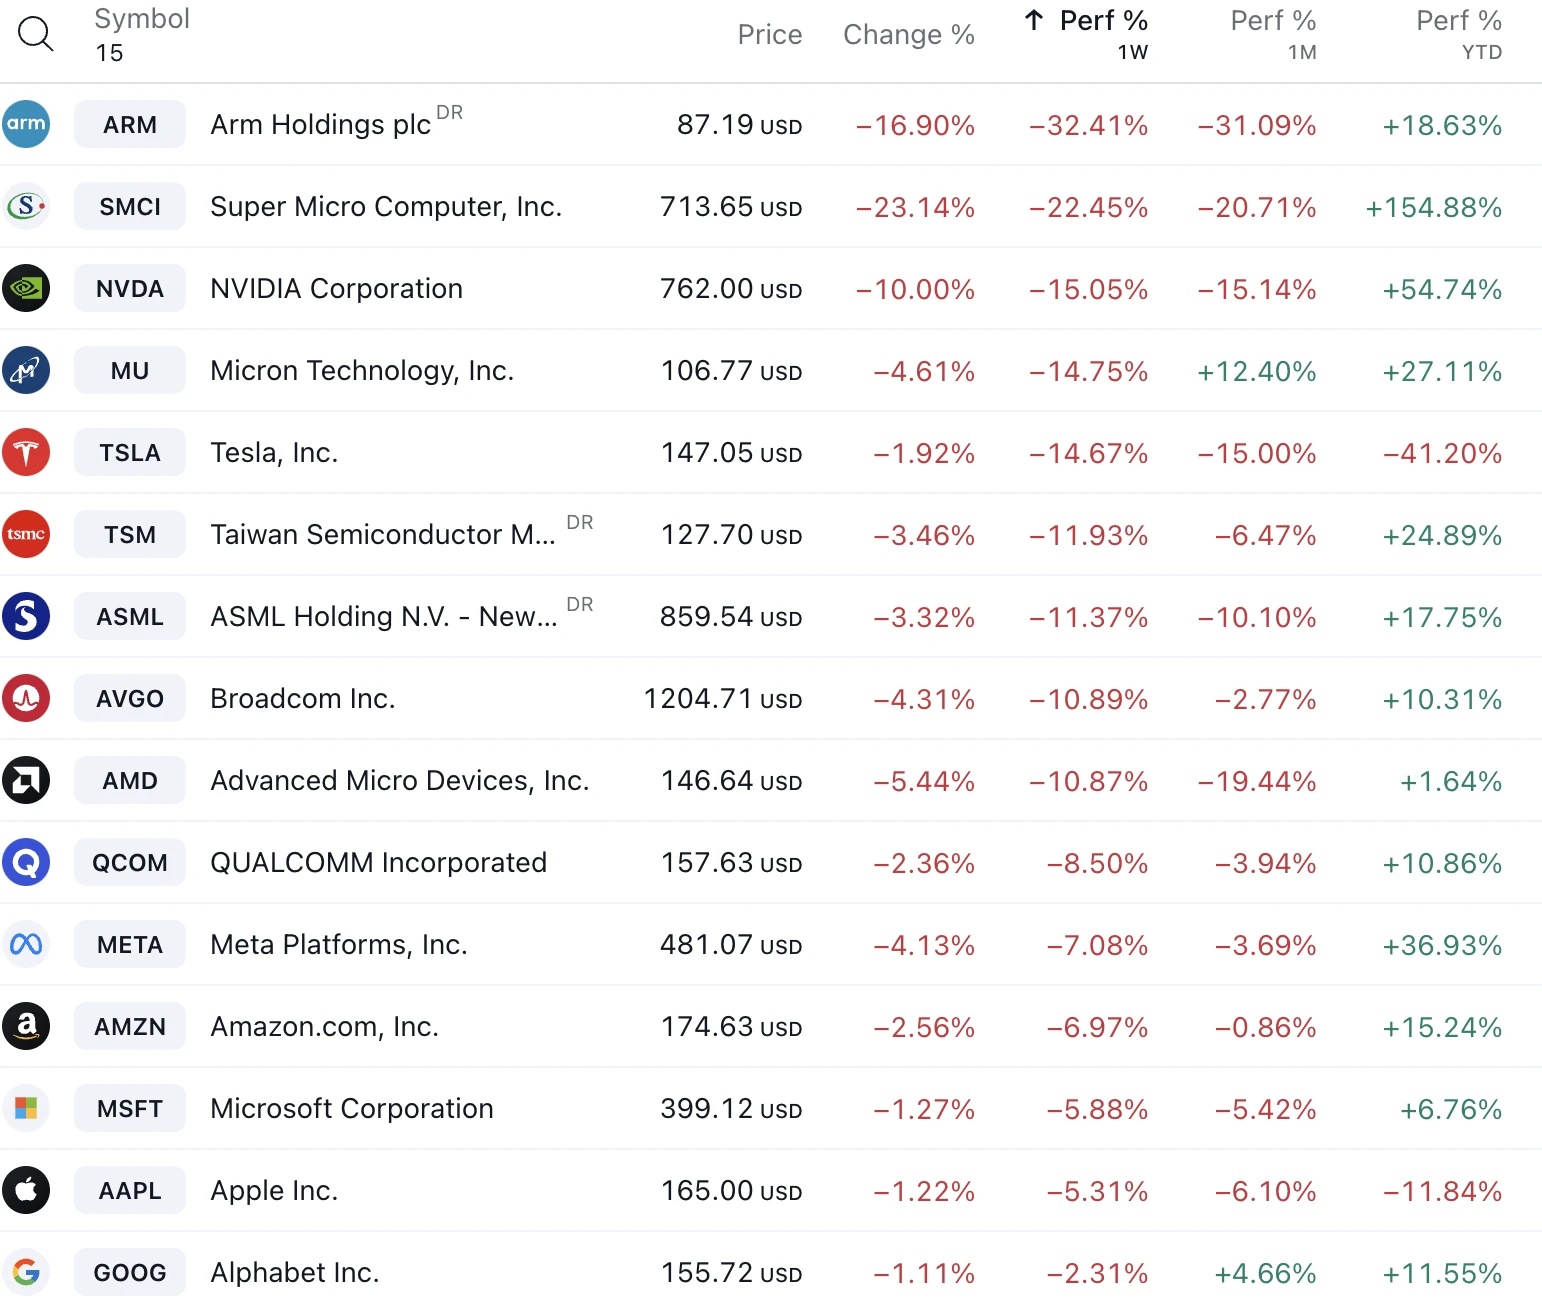
Last week, technology leaders were the biggest losers, with double-digit declines (even higher than Bitcoin). Nvidia fell 14.5% and broke through the 50-day line and the key support level of $800, ARM fell 31%, AMD fell 22%, Broadcom fell 12%, AMD fell 11%, and Tesla fell 14%. In contrast, the consumer goods and utilities sectors performed best, falling only 0.3%.
This week, the accelerated decline of semiconductor, AI and other technology stocks began with the financial report of ASML, Europes largest technology company by market value. ASMLs total new orders in the first quarter fell far short of expectations, down 61% from the previous quarter. Previously, its order volume set a record in the fourth quarter of 2023. ASML explained that the decline in new orders was mainly due to a sharp drop in demand for the most advanced EUV lithography machines. The market believes that the performance announced by ASML may be a warning to technology giants that will announce financial reports in the future.
Chip and AI stocks were then sold off after ASML and TSMC both released cautious comments on future demand. In addition, AI server maker SMCI collapsed on Friday after failing to release preliminary results, raising concerns about overall demand for AI.
The panic about NVDA seems to be a bit excessive. Its monopoly position is temporarily solid for two reasons. First, only NV link can assemble multiple chips into a large computing center. Second, CUDA developer resources are the richest in the world and cannot be surpassed for the time being.
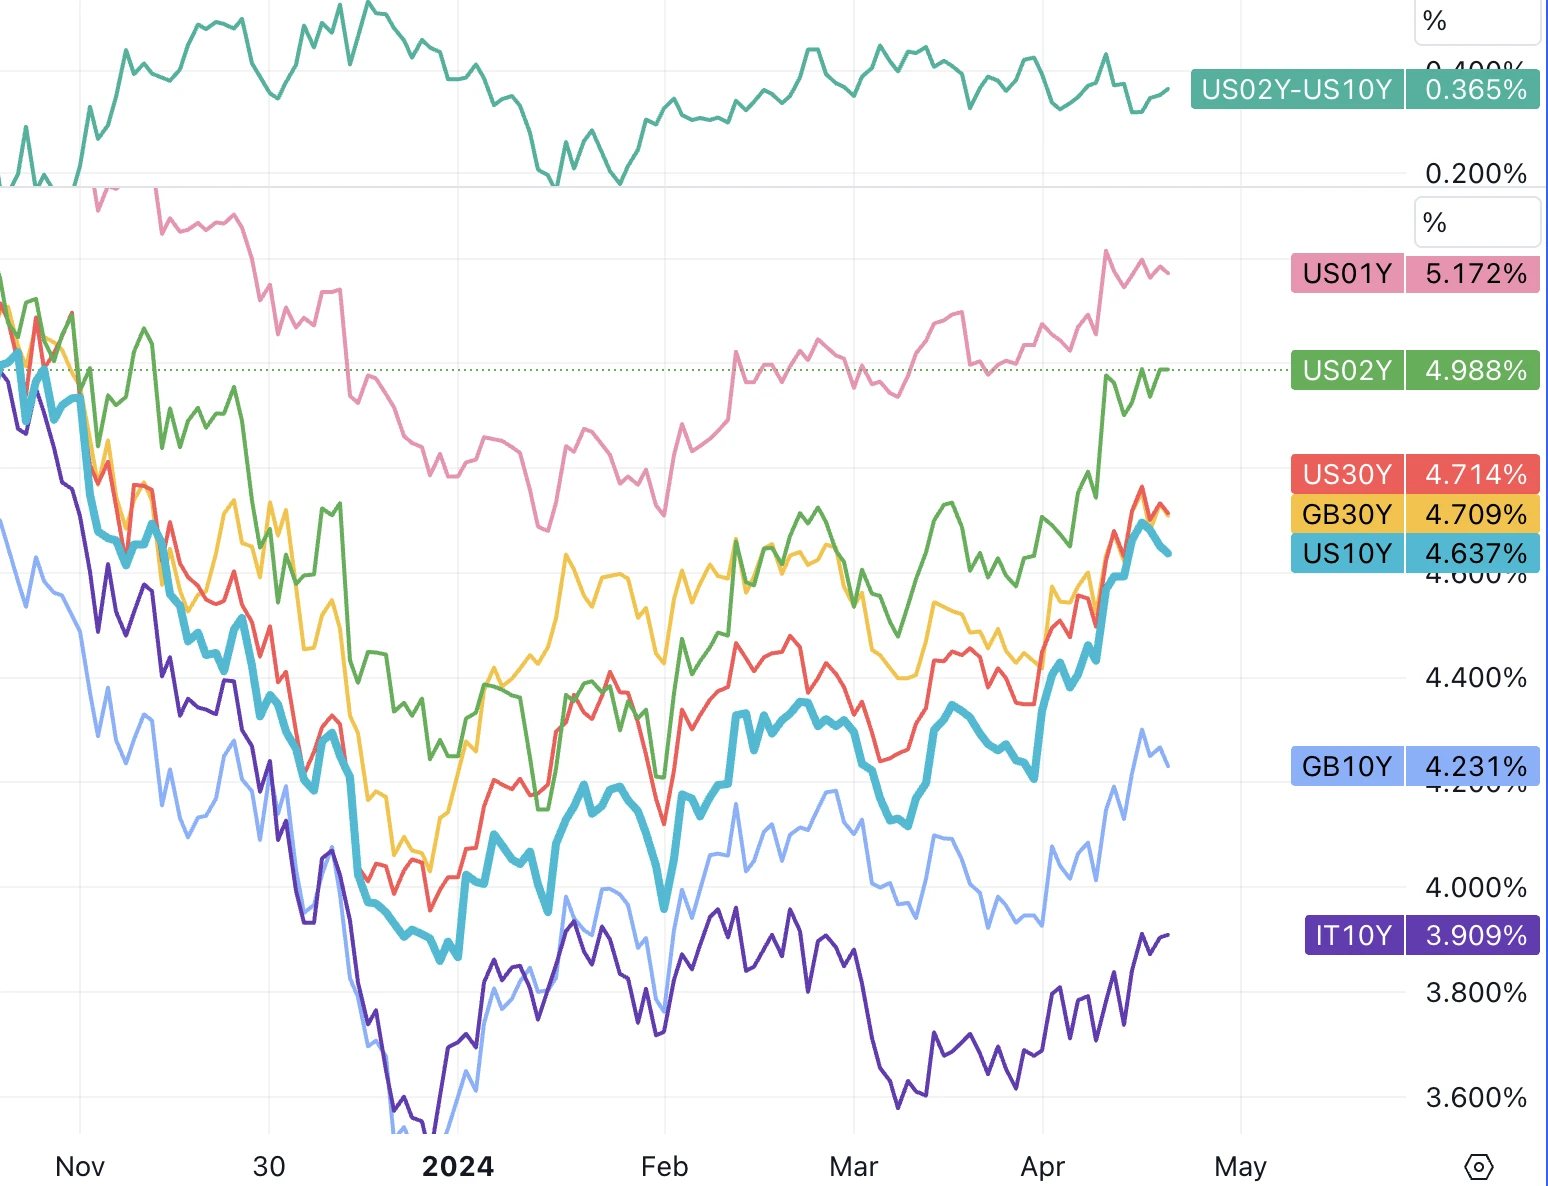
This week, Fed officials made more hawkish remarks, and the 10-year Treasury yield rose to 4.62% and the 2-year yield rose to 4.988%. Although the conflict in the Middle East intensified, the yield fell sharply in the middle of the week but soon rose back. Wall Street is no longer expecting a rate cut in June, and September has become the consensus time. However, the good news is that the ECB and BoE still expect to start cutting interest rates in the summer, which has not been postponed.
Industrial metals prices were hurt by Russian metals sanctions, with copper and aluminum hitting one-year highs. Crude oil retreated, erasing all gains for the month as Iran and Israel showed relative restraint.
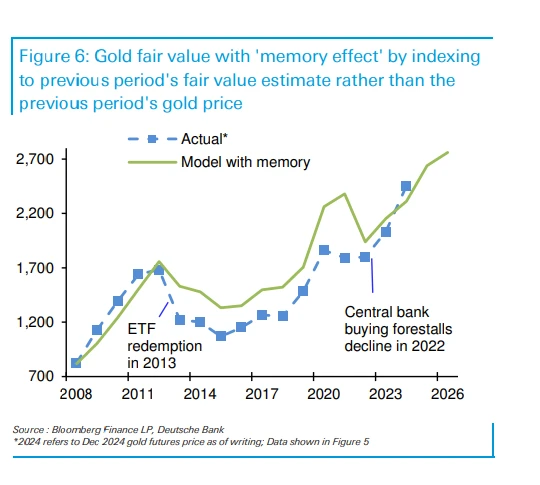
The safe-haven demand is more evident in gold, which once broke through $2,410 on Friday and closed positive for four of the five trading days. The trend of cryptocurrencies in the past month has diverged from that of precious metals, and the correlation between bonds and precious metals has also broken, which has surprised many market participants. Deutsche Bank has therefore updated its model and introduced a memory factor, fitting that this years gold price increase is paying off the debt of the past decade:
More and more senior Fed officials mentioned interest rate hikes:
New York Fed President Williams warned that if the data shows that the Fed needs to raise interest rates to achieve its goals, then the Fed will raise interest rates, and raising interest rates is not his expected baseline;
Atlanta Fed President Bostic also said he is open to raising interest rates if U.S. inflation rises;
Fed Chairman Jerome Powell acknowledged the lack of progress on inflation and that it might be appropriate to let higher interest rates work for longer, but rate hikes were not on the immediate horizon.
Data:
Retail sales in March beat expectations and earlier data was revised upward;
Business survey results were mixed;
Initial jobless claims remained low.
AI bubble burst? First ASML, now TSMC lowers 2024 global chip outlook
Our conclusion is that it is too pessimistic.
Many news reports conveyed similar meanings. TSMCs stock price plummeted 12%, even though TSMCs performance exceeded expectations (revenue increased by 13% year-on-year and net profit increased by 9%) and only released a few negative outlooks, mainly focusing on mobile phones and automotive chips (not to mention personal computers, which have been weak). The demand for AI chips was described as never-ending.
TSMCs net profit margin is 40%, the highest level in the companys history, while the industry average is only 14%, indicating that TSMC has pricing power. However, demand for traditional servers is still relatively weak and accounts for the largest share of TSMCs revenue (46% of HPC). TSMC predicts that the revenue contribution of AI servers will more than double in 2024, accounting for 10% of total revenue in 2024, and continue to grow to more than 20% in 2028.
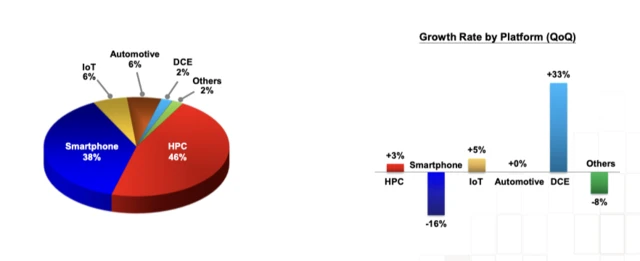
Despite good performance in the first quarter, the subsequent press conference lowered the growth rate of the semiconductor industry excluding memory in 2024 to 10% (previously expected to be over 10%), and lowered the growth rate of the foundry industry to 15% - 17% (previously expected to be 20%).
Against the backdrop of a weak recovery in the global semiconductor industry, the chill released by TSMC was quickly amplified, directly causing the collapse of chip industry stocks, including Samsung Electronics, MediaTek, ASE and other chip giants. Analysts said that the performance and expectations of semiconductor stocks in the first quarter of 2024 will be more mediocre and unable to reproduce the artificial intelligence results of 2023.
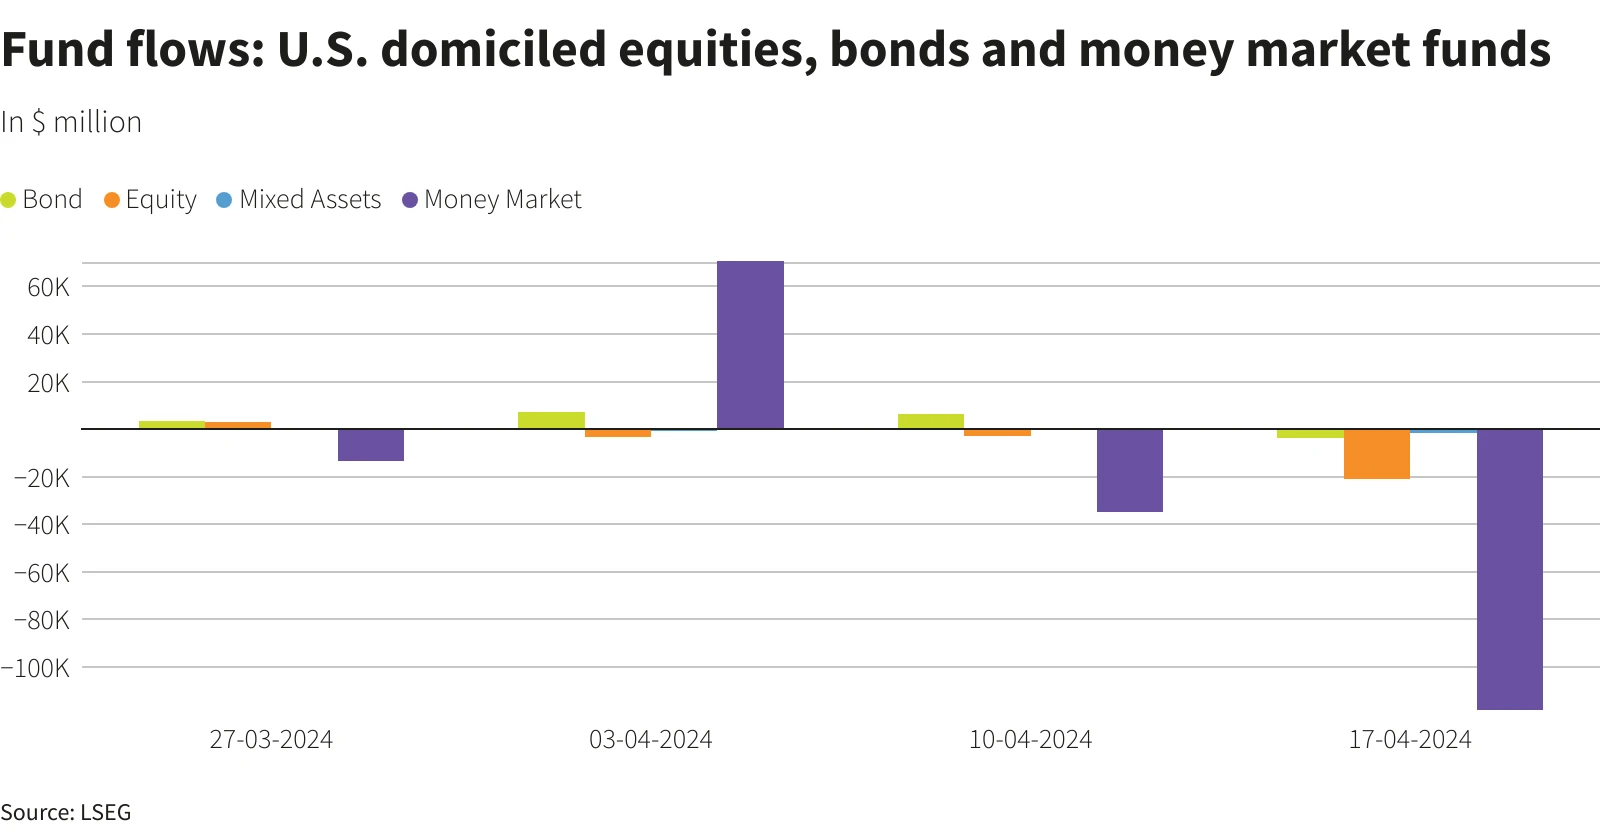
Due to Tax Day in the United States (which ends on April 15), global equity funds experienced outflows in the seven days ending April 17, with bond, stock and money market funds all affected. Tax Day can lead to reduced market liquidity as investors may need to sell assets to pay taxes. It is important to note that as Tax Day passes, the market tends to return to a state driven by fundamental factors such as corporate earnings, economic growth and monetary policy.
Fund Flow and Positions
LSEG data showed that investors sold a net $21.15 billion worth of U.S. stock funds, the most in a week since December 21, 2022, and the third consecutive week of net outflows. Money market funds had net outflows worth $118.1 billion, the largest single-week outflow since at least July 2020:
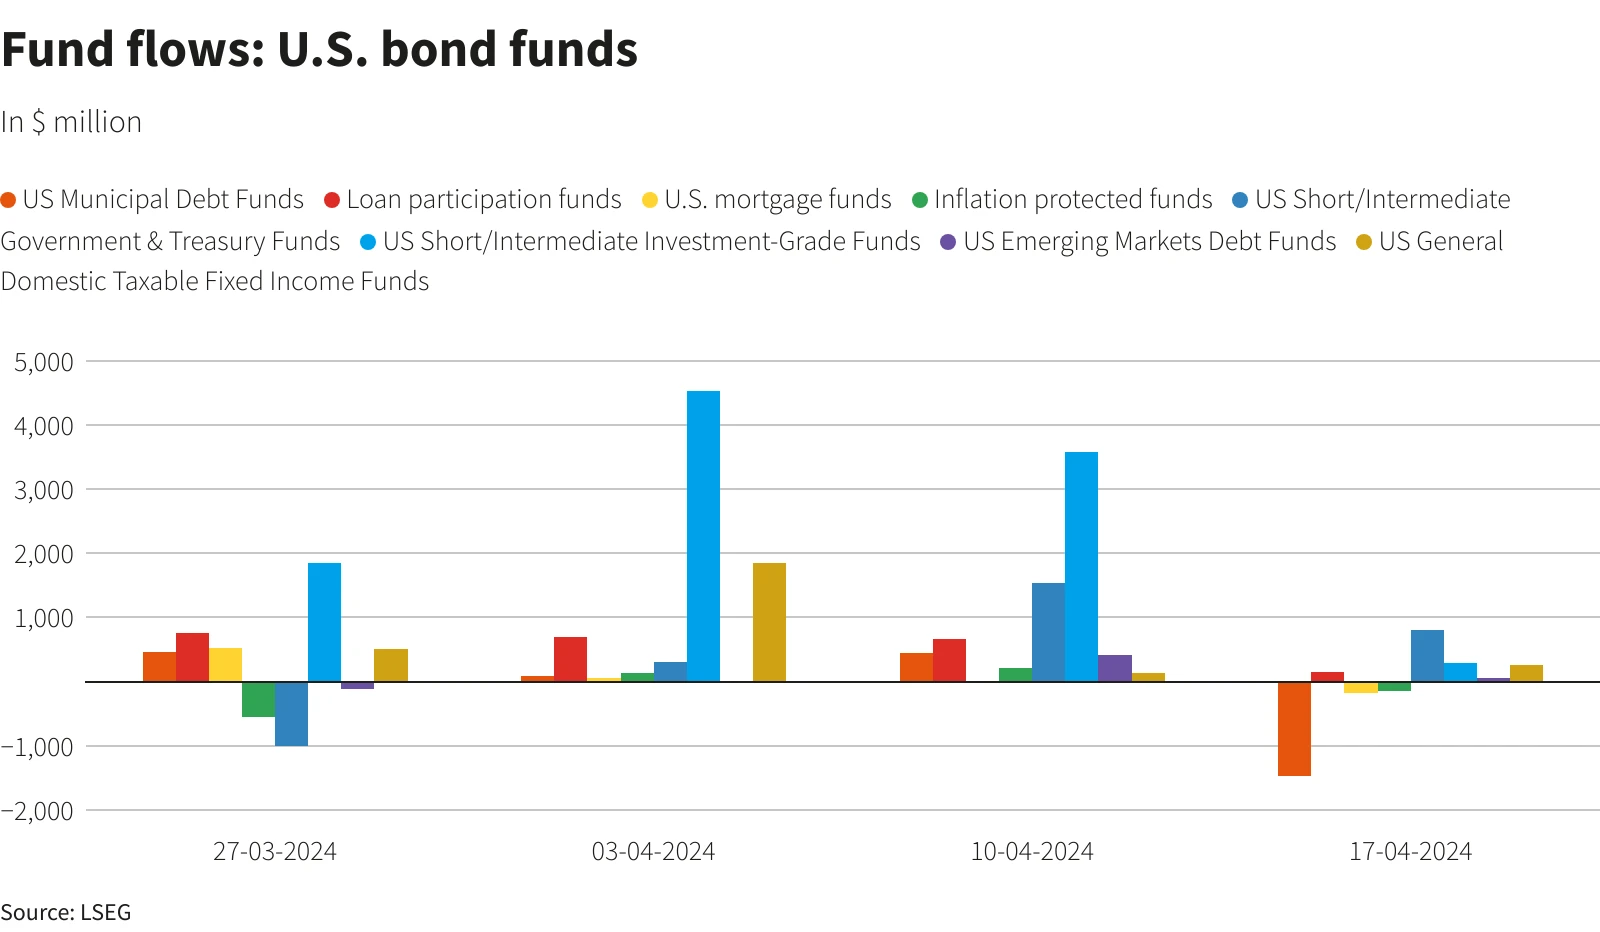
U.S. bond funds saw weekly outflows of $3.83 billion, the largest net sell-off since mid-December, mainly due to outflows from local government bonds. Medium- and short-term government bonds remain attractive:
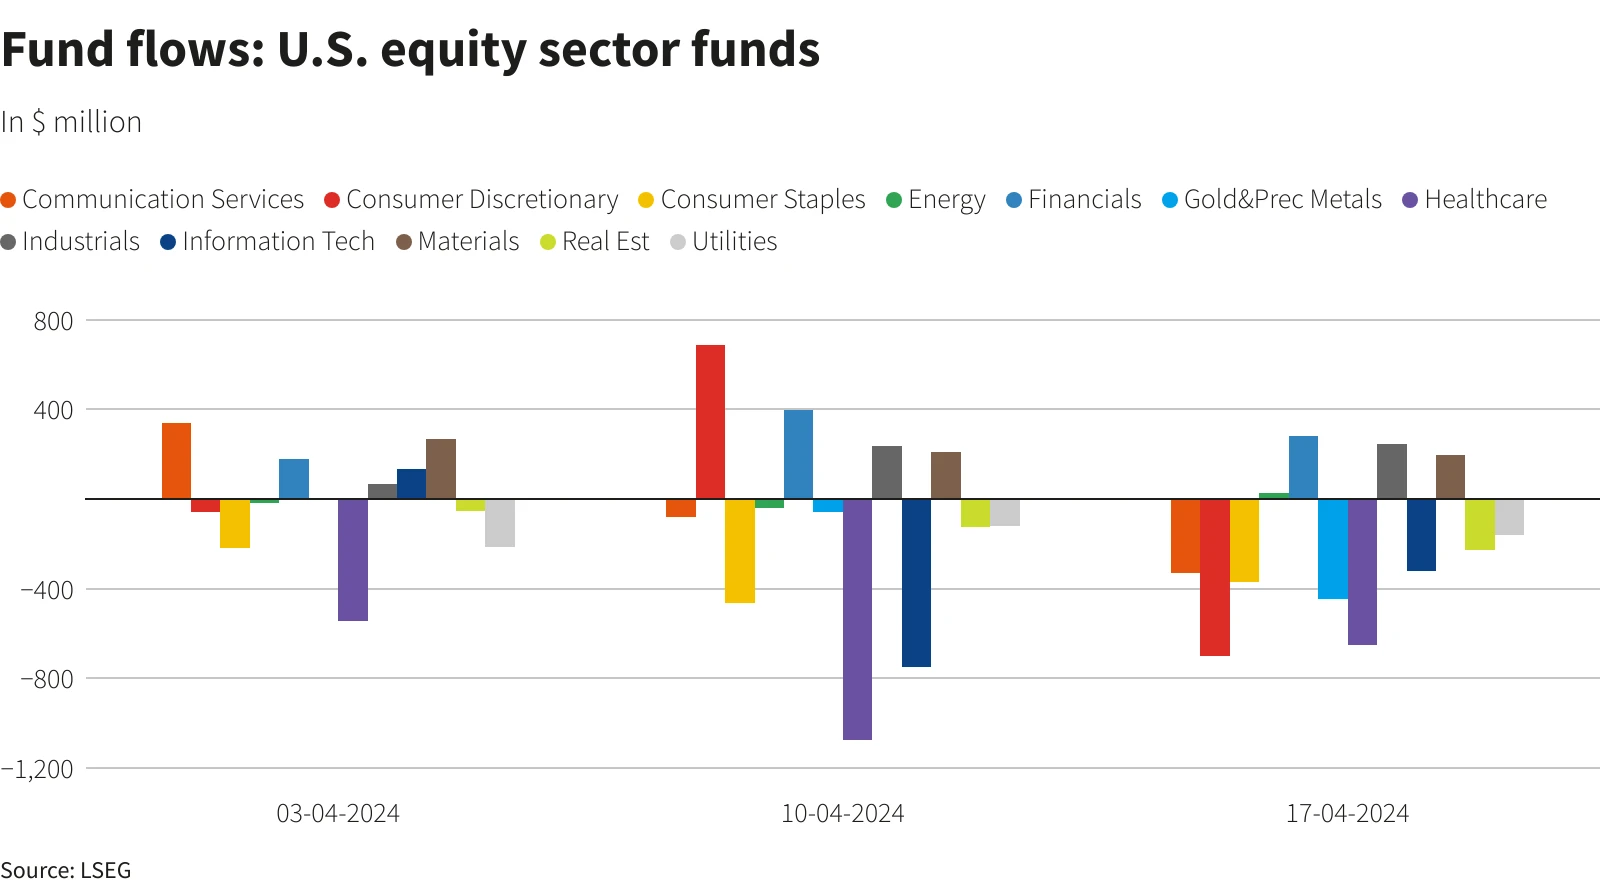
The sectors that U.S. stock investors sold the most were consumer discretionary at $701 million, healthcare at $651 million, and gold and precious metals funds at $447 million, but bought financial industry funds with a net value of approximately $281 million because longer or higher interest rates are good for financial institutions.
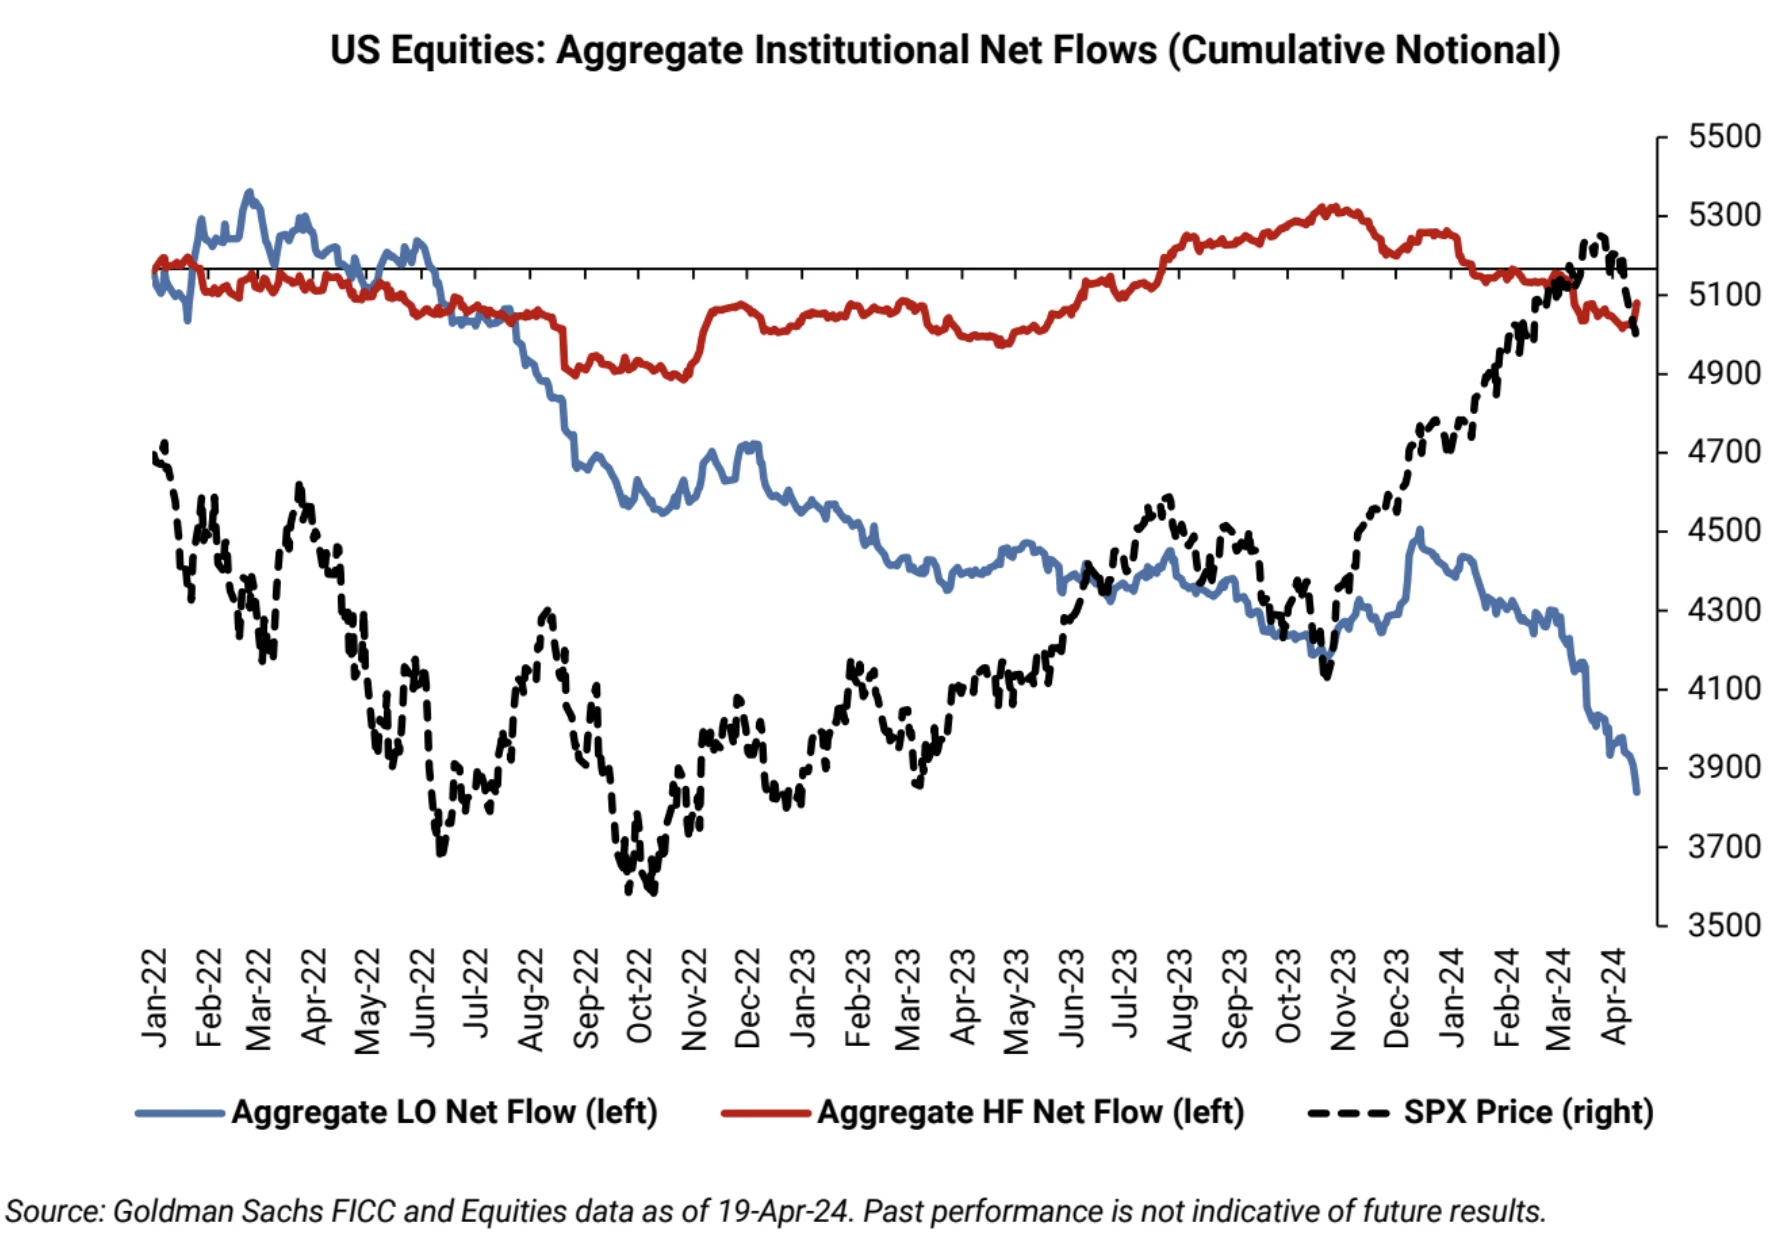
However, Goldman Sachs clients have been net buyers for two consecutive weeks. Although short positions are increasing, long positions are growing even more:
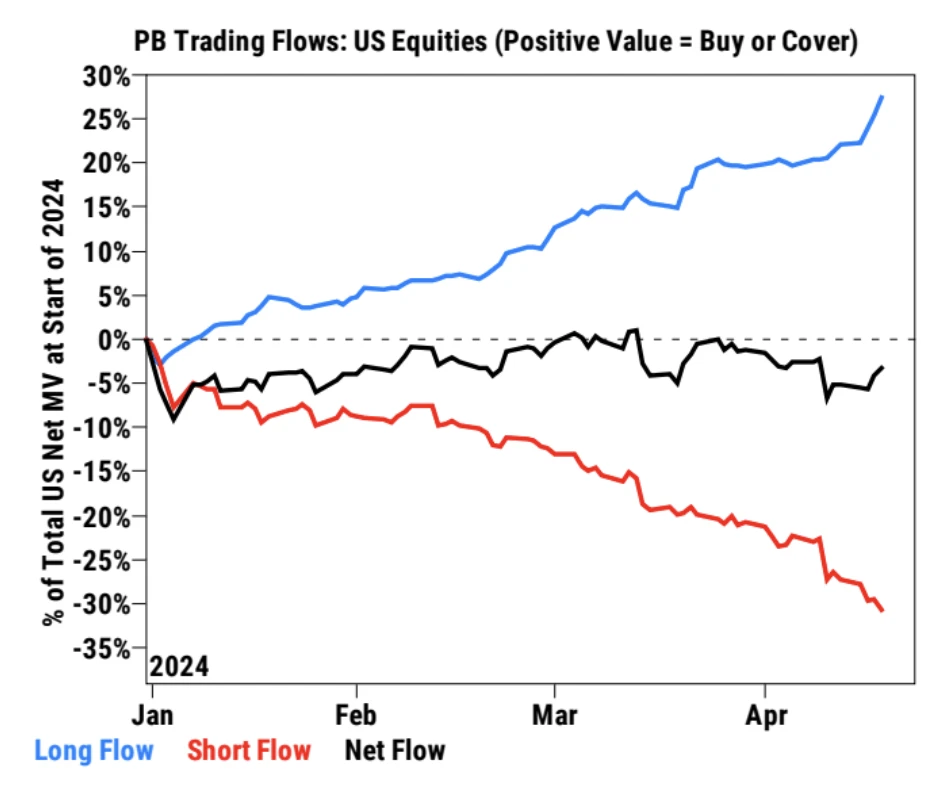
Among them, long only funds are rapidly reducing their holdings, while long-short HFs are starting to go long:
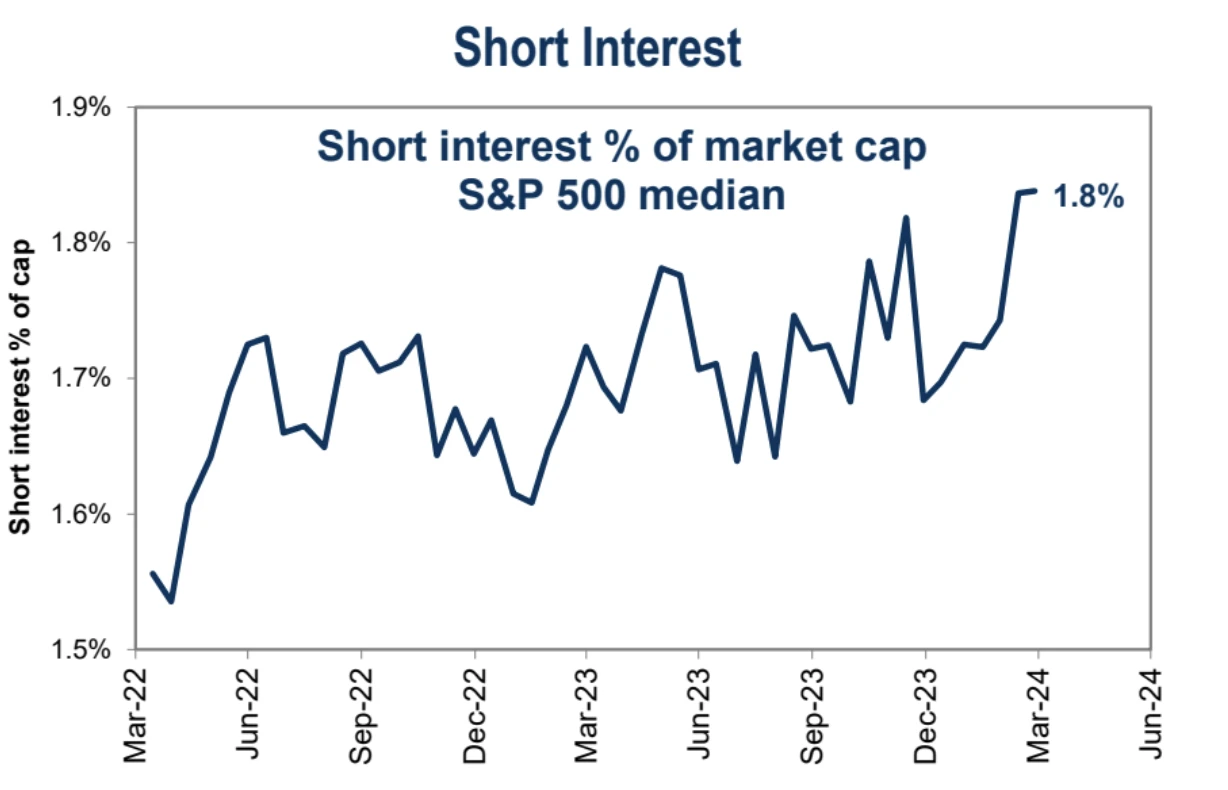
The overall US stock SI is at its highest level in at least 2 years:
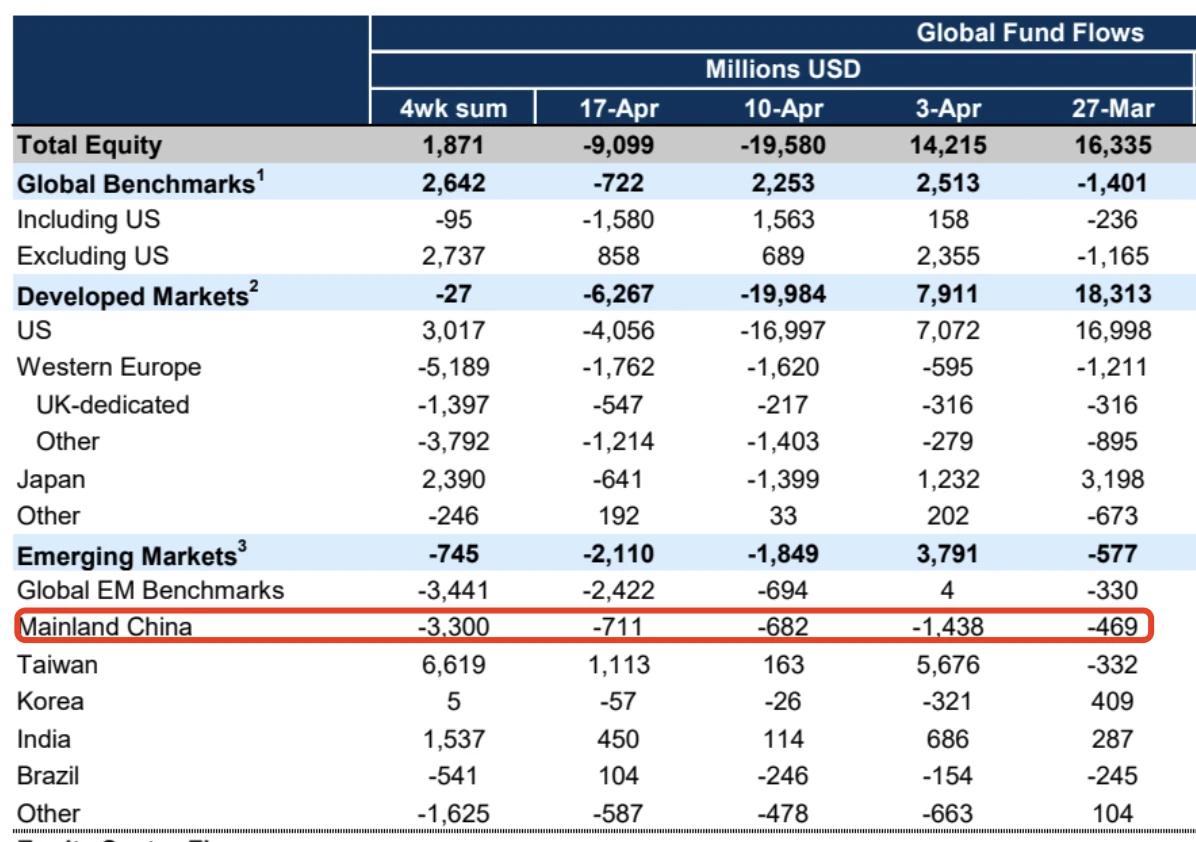
China concept funds have seen net outflows for six consecutive weeks:
Cryptocurrency
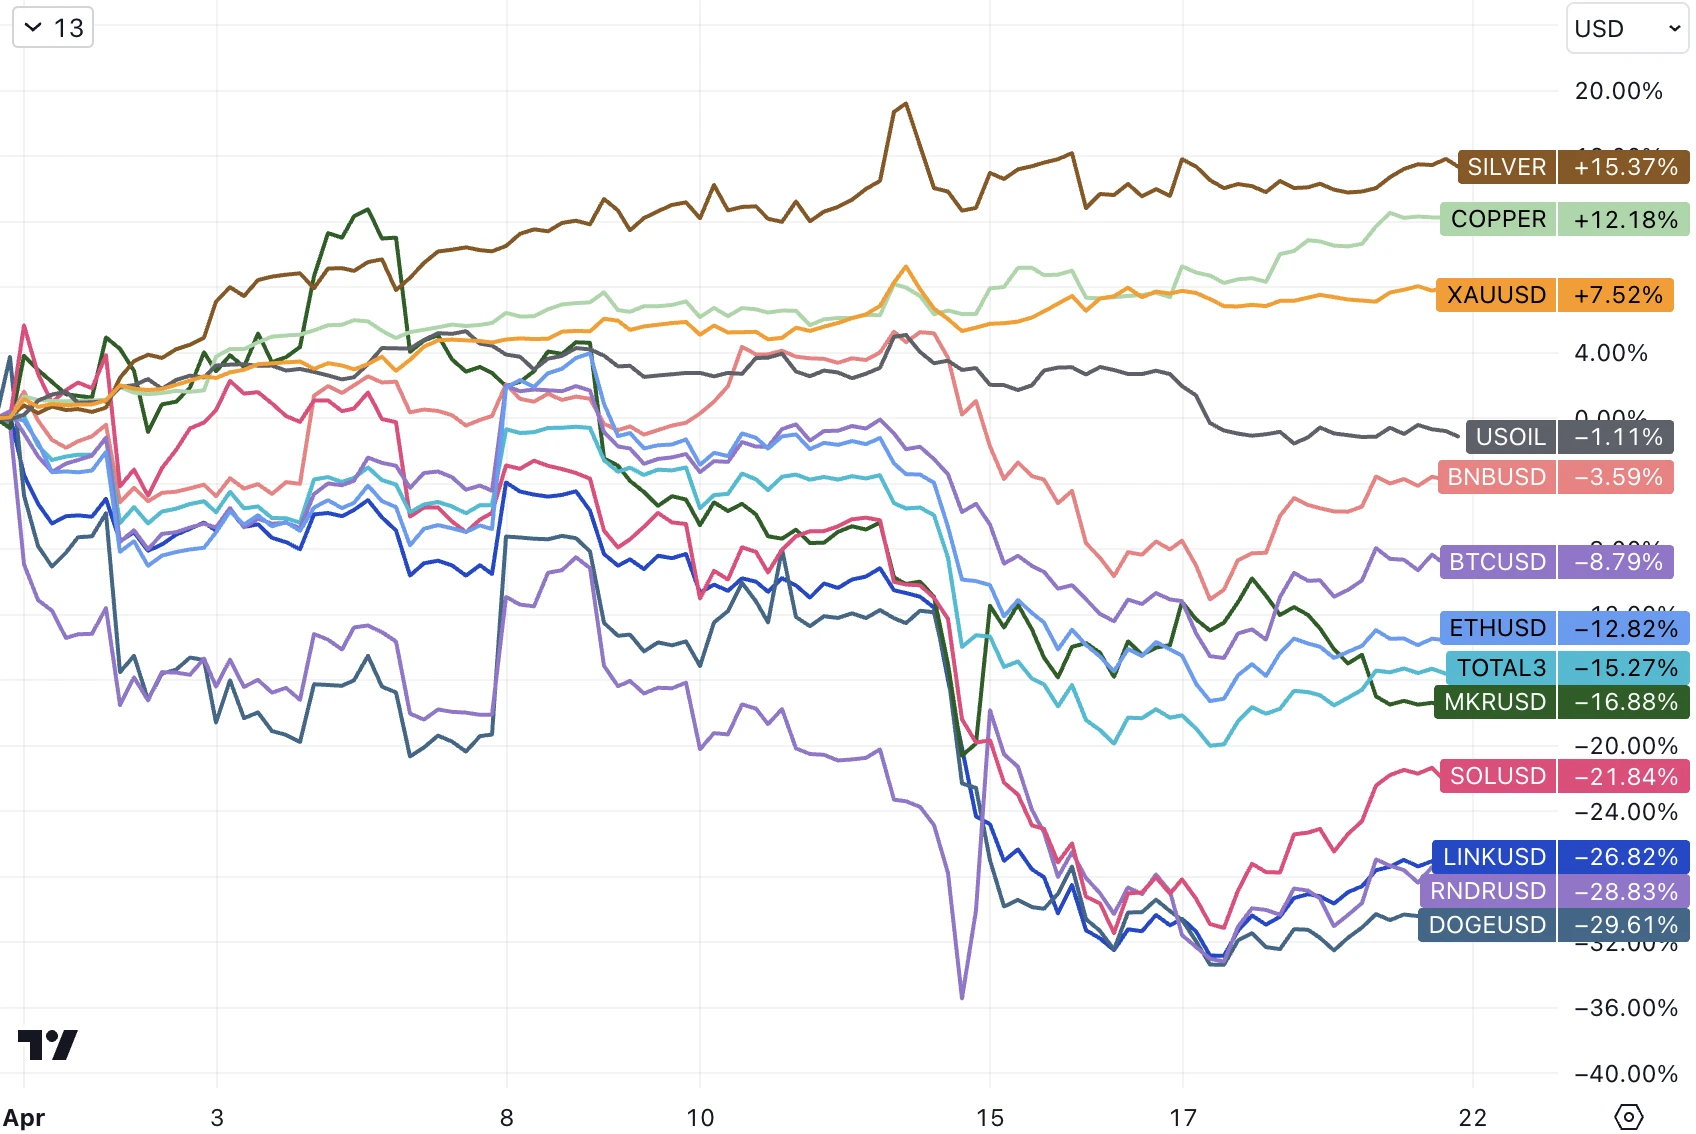
Considering that YTD cryptocurrencies as a whole are still up more than 30%, especially BTC, which only pulled back 8.8% in April compared to the stock market and other cryptocurrencies, it can be seen that this market is still quite resilient. Previous analysis pointed out that BTC is like the 3 x long nasda q1 00 index, which fell more than 15% in April. Altcoins pulled back more in April, and many well-known projects also fell by more than 40% at one point. However, as Iran and Israel perfunctorily counterattacked each other, the risk of amplifying the conflict was settled, and BTC survived the fourth halving safely, the market rebounded sharply late on Friday, and BTCs 2-day rebound was the largest in nearly a month:
April was the first monthly correction for BTC after it had risen for 7 consecutive months. The 7 monthly positive lines should be the longest consecutive positive lines since the advent of BTC, followed by the bull markets in 2013 and 2021, which rose for 6 consecutive months respectively. So it is not surprising that there was a correction of around 10% this month.
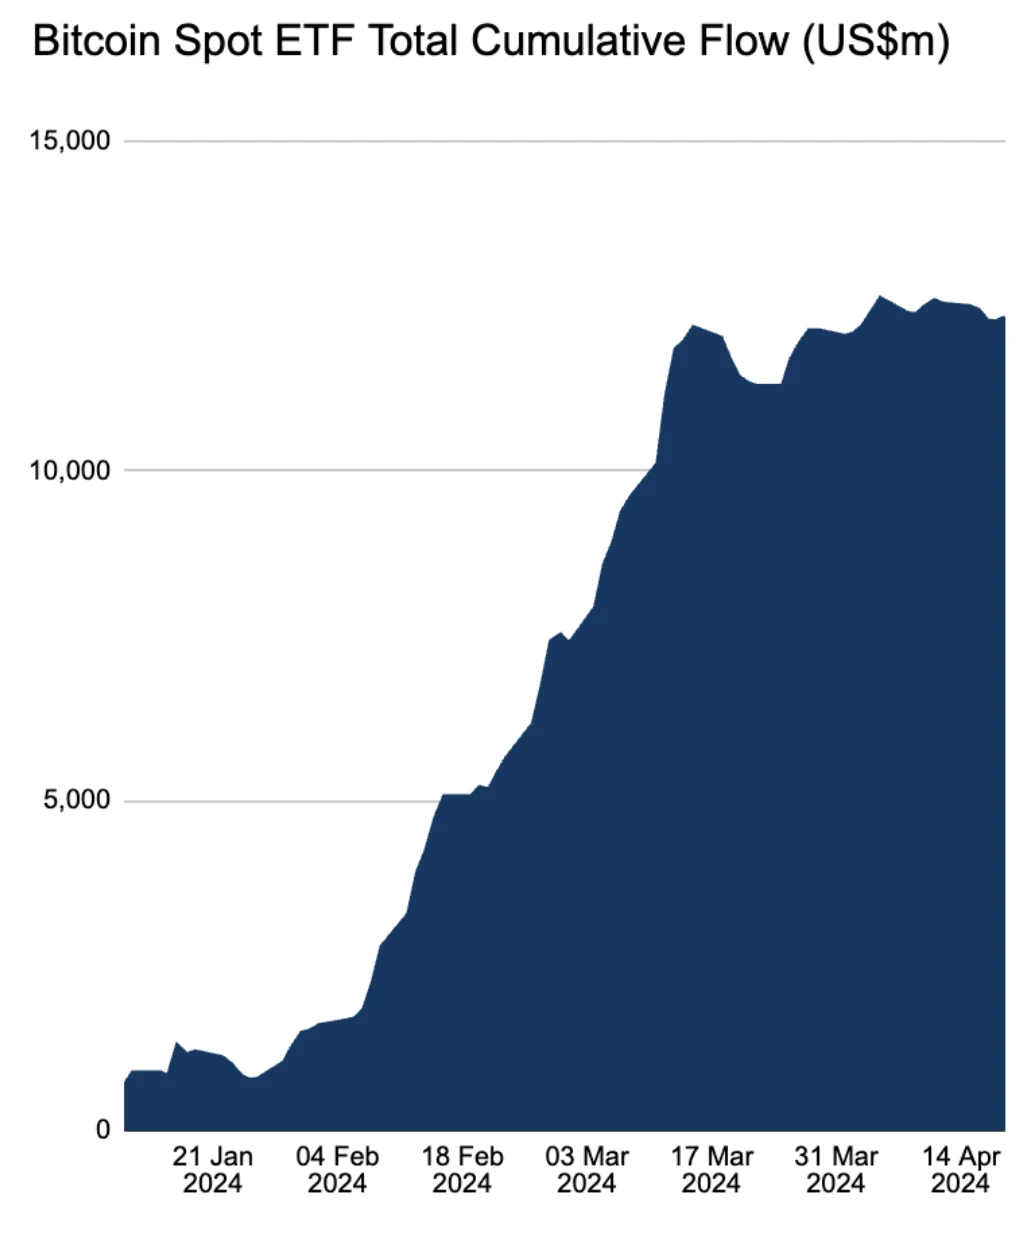
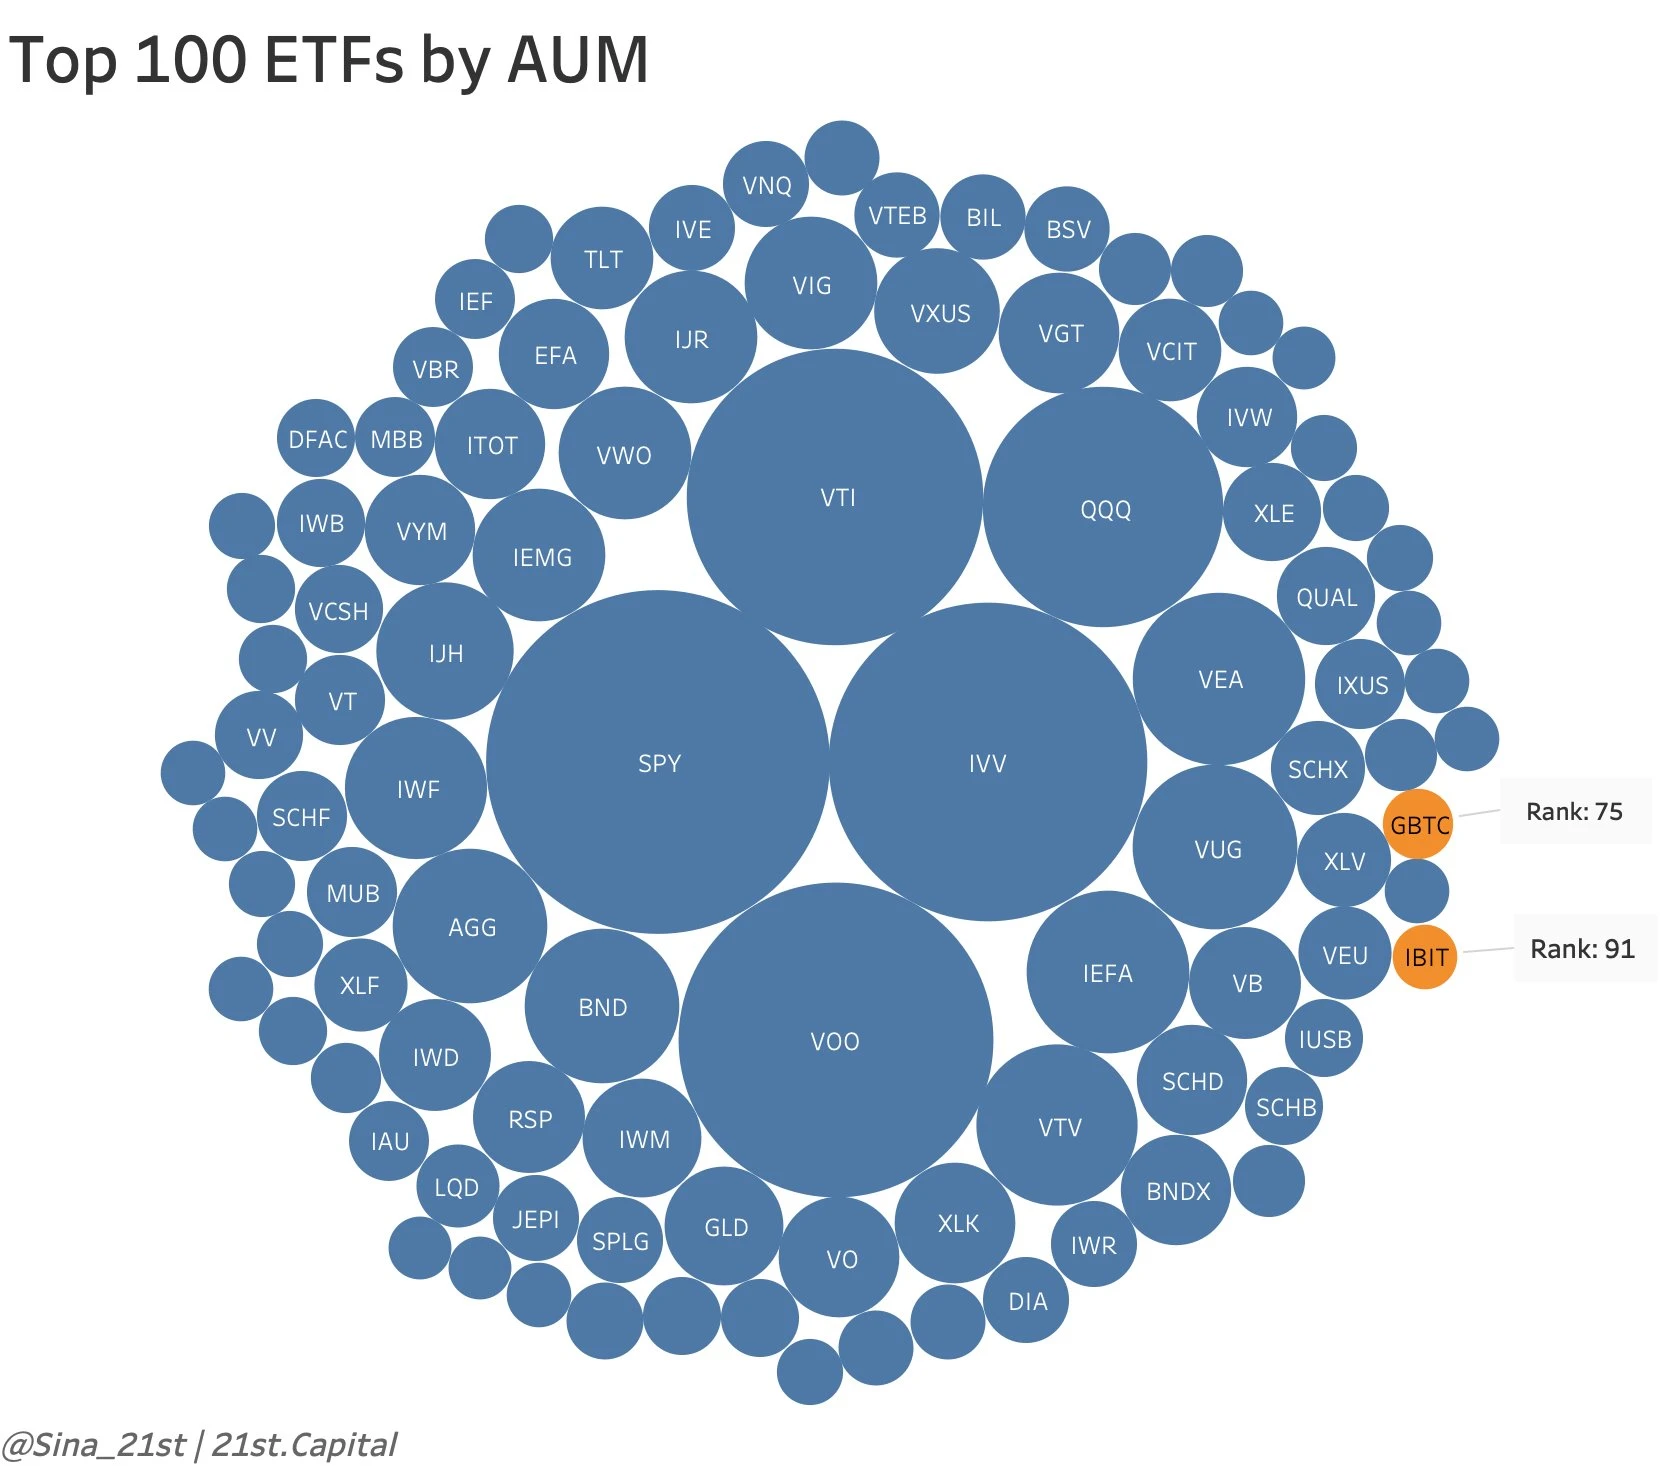
BTC spot ETFs had a small net outflow of $204 million last week. Bitwises BITB saw its first net outflow since its listing, but IBIT, FBTC, EZBC, and BRRR have never seen any outflows, which is surprising. IBIT and FBTC are the main sources of capital inflows, with inflows of $15.4 billion and $8.1 billion respectively since their listing.
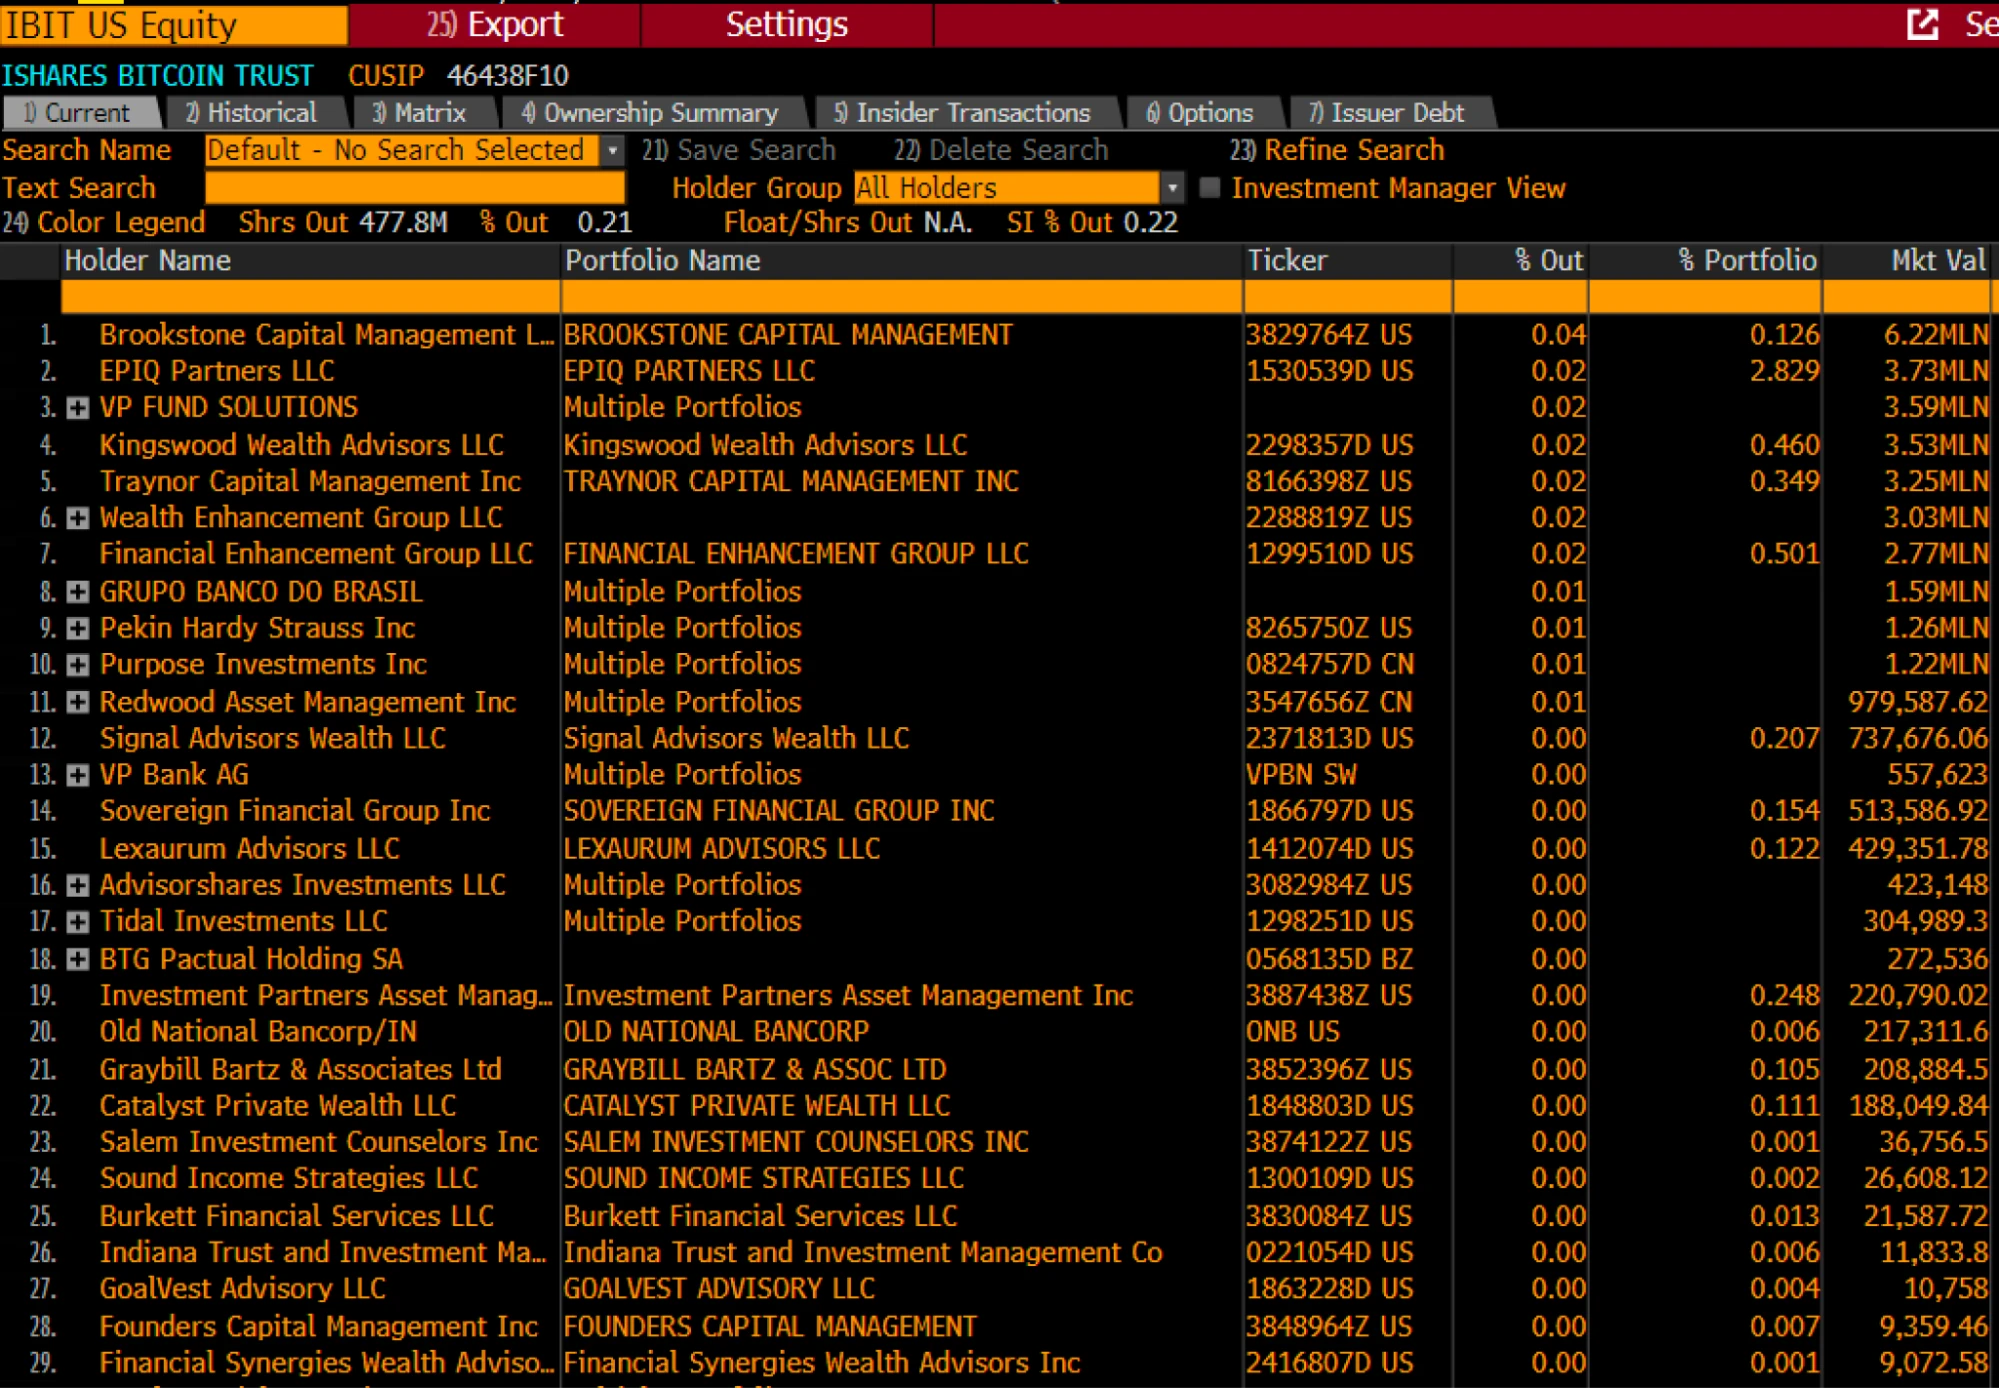
IBIT ETF currently has about 30 institutional investors, mainly funds and advisory institutions, and each institution holds a small percentage of shares. The institutions shown in the table only account for 0.2% of the total share of IBIT, and there is still a lot of room for growth.
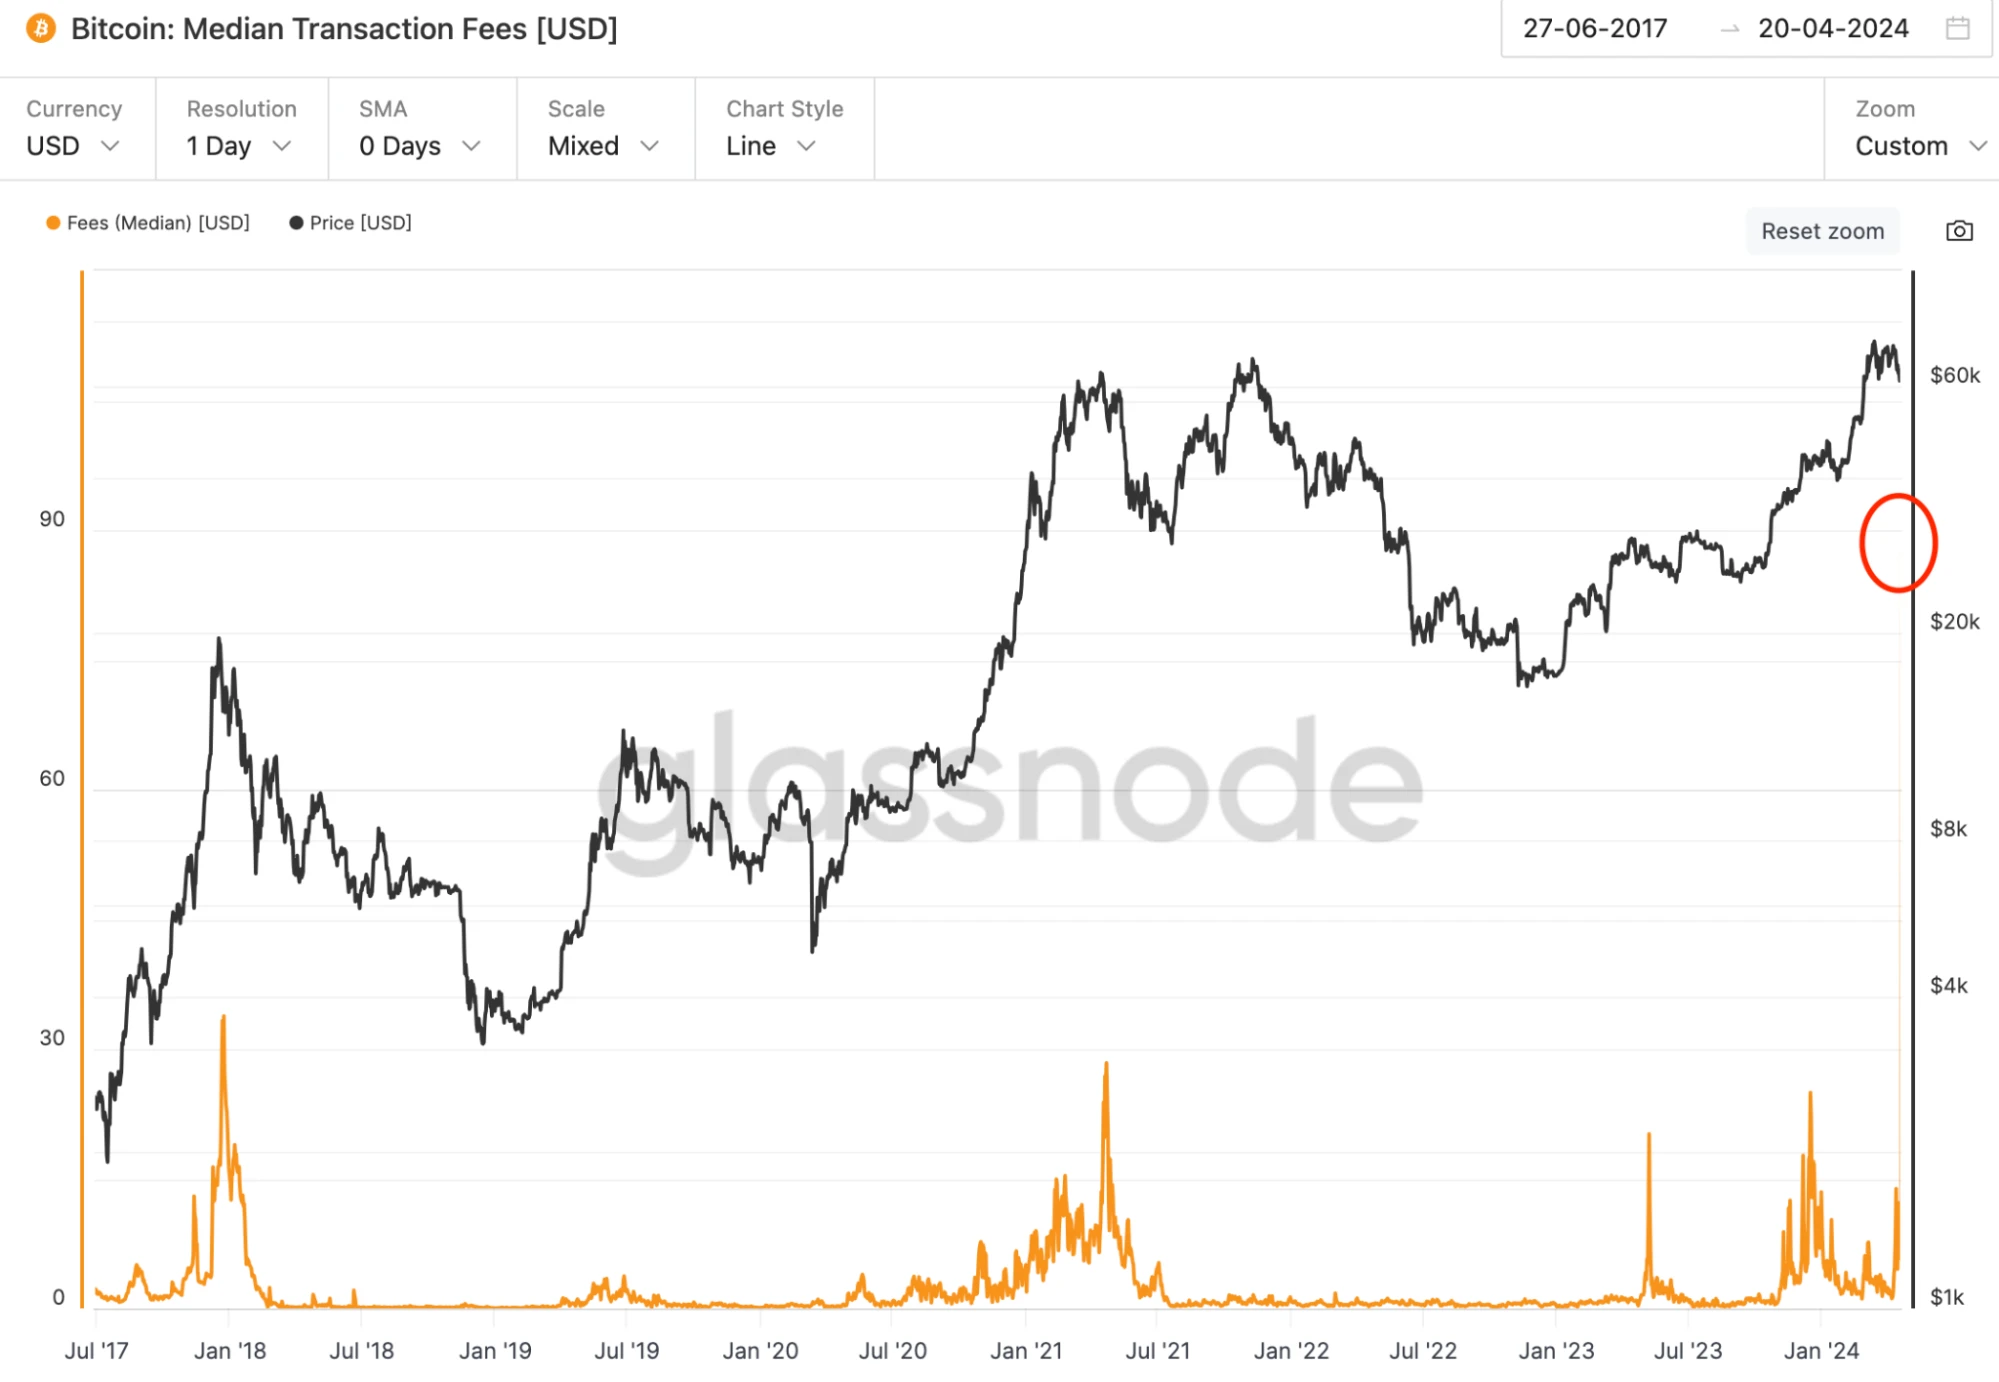
Bitcoin successfully halved on Saturday, and RUNE rune casting was launched at the same time. Due to the wealth-creating effect of the previous Ordinals inscription project, the launch of this rune immediately led to an increase in network fees. The 2024 halving block has become the most expensive block mined in Bitcoin history (37.67 BTC). The median Bitcoin network transfer fee rose to US$92 on Saturday, and miners income increased instead of decreased.
Many analysts previously worried that if the price of BTC did not rise after the continuous halving, the computing power would stagnate and the network’s security would not be able to carry greater value, causing the network to fall into a negative spiral of both price and computing power. However, judging from the activity of inscriptions, runes, and various L2s, this possibility will be greatly reduced.
The negative impact is that high transaction fees may hinder the adoption of Bitcoin as a regular payment method, especially for small transactions, which goes against the original intention of Bitcoin to expand users. Another major consequence is the increase in dust, with more than half (53.94%) of Bitcoin addresses holding less than 0.001 BTC. If fees continue to be above $60, these balances will actually become dust.
Runes can be simply understood as a protocol for issuing native FT on Bitcoin without off-chain data. The previous inscriptions were engraved in the segregated witness data, while runes are engraved in OP_RETURN, which means directly using UTXO with a very small on-chain footprint. In contrast, BRC-20 is based on ordinal theory, which is not a native component of Bitcoin. The token issuance mechanism of this protocol will also lead to a surge in the number of UTXOs and network congestion, and it can only issue NFTs with limited usage scenarios.
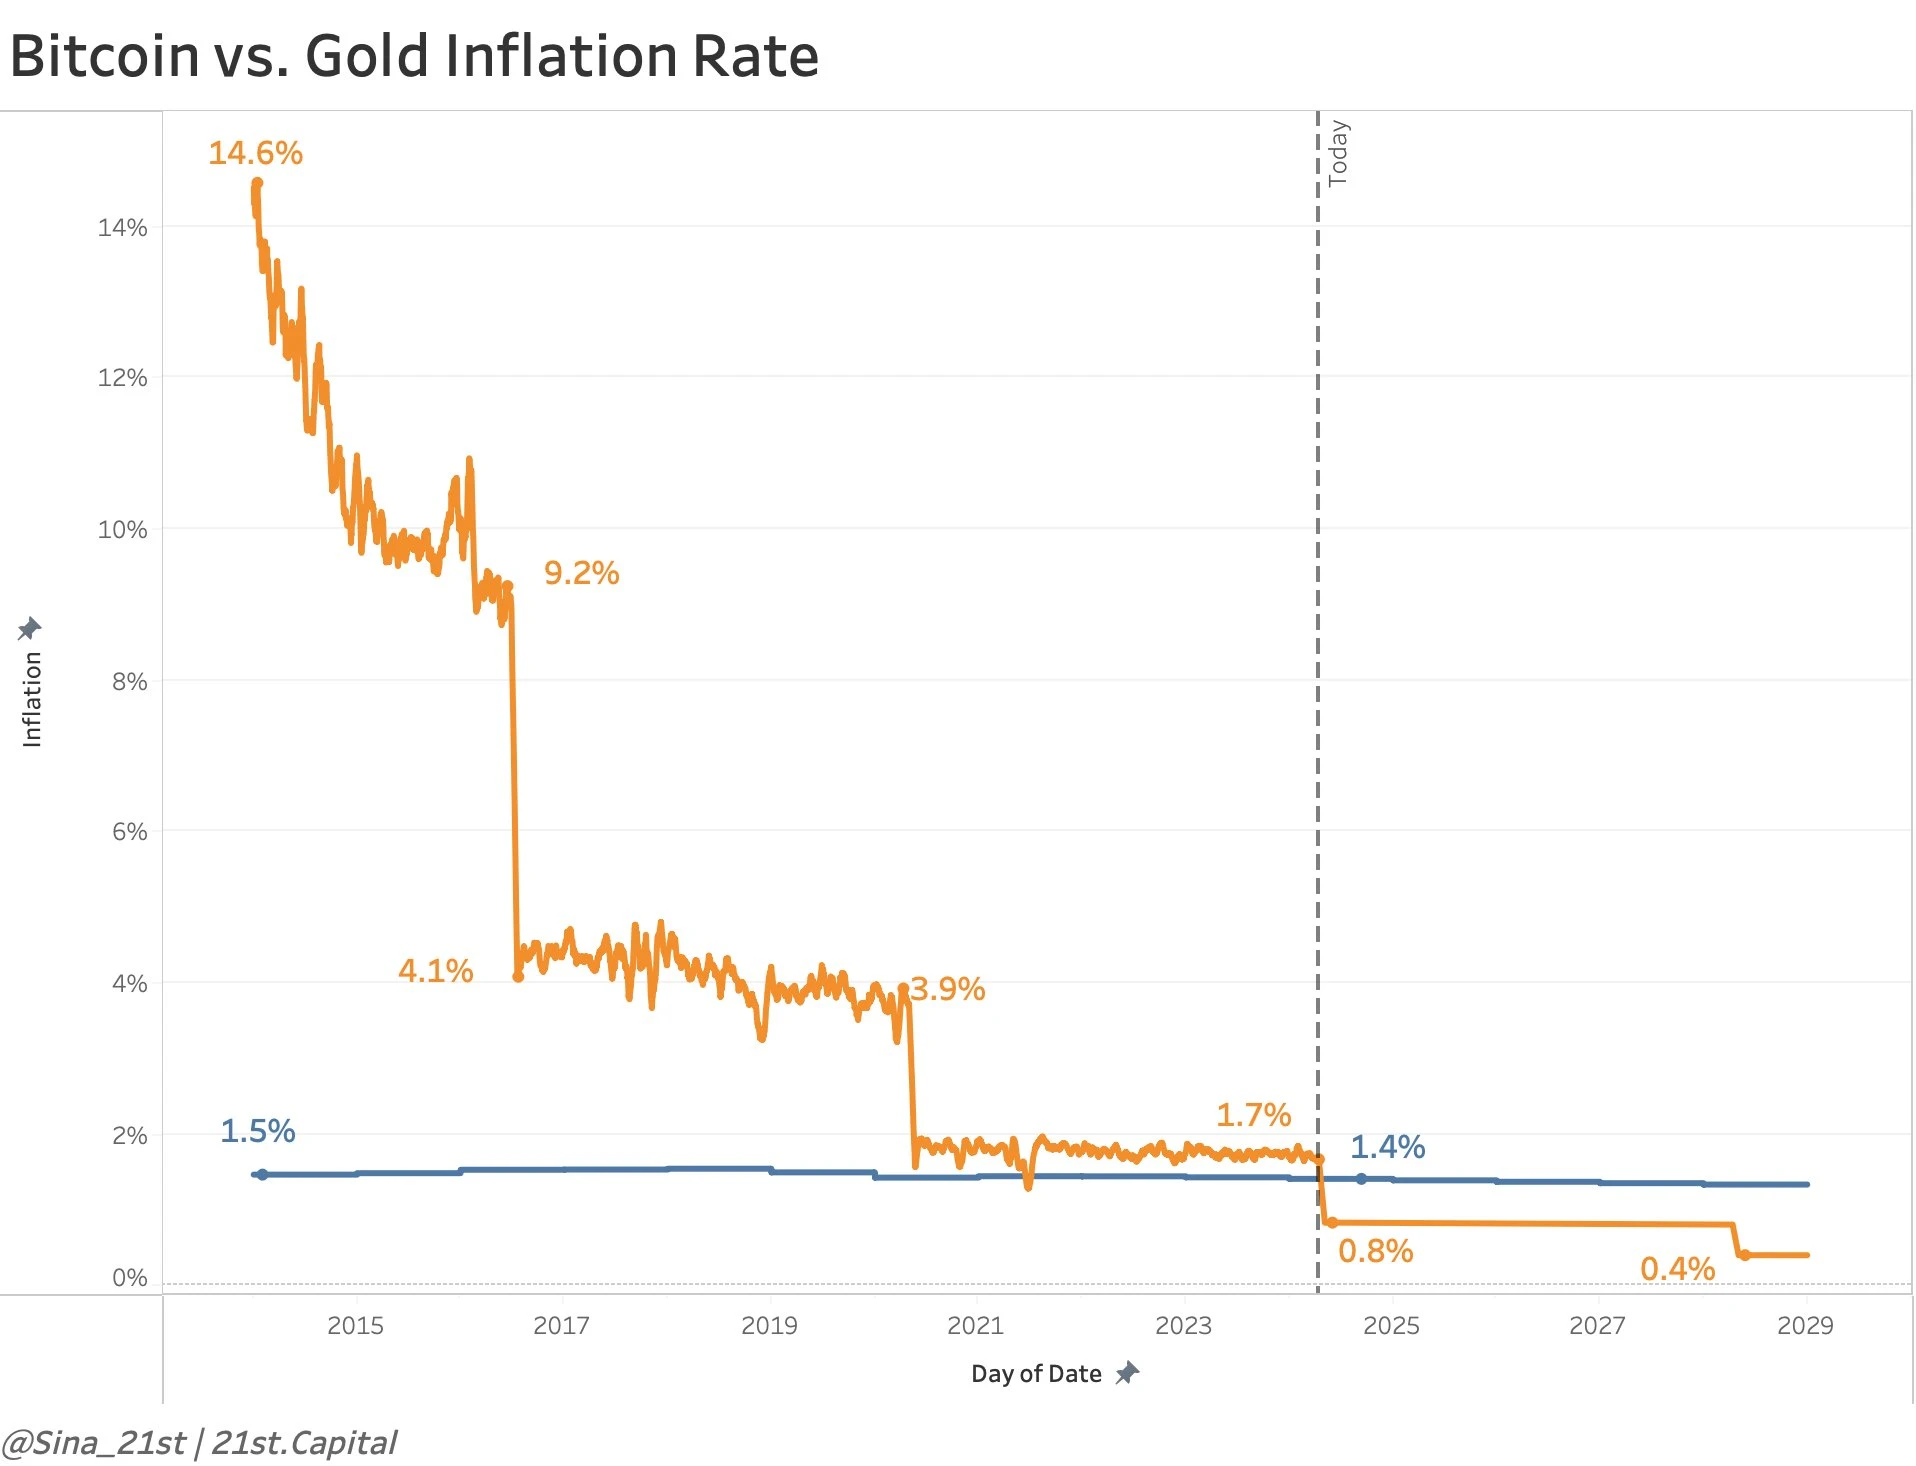
After the halving, Bitcoin’s inflation rate will drop by half to 0.8%, lower than gold’s 1.4%:
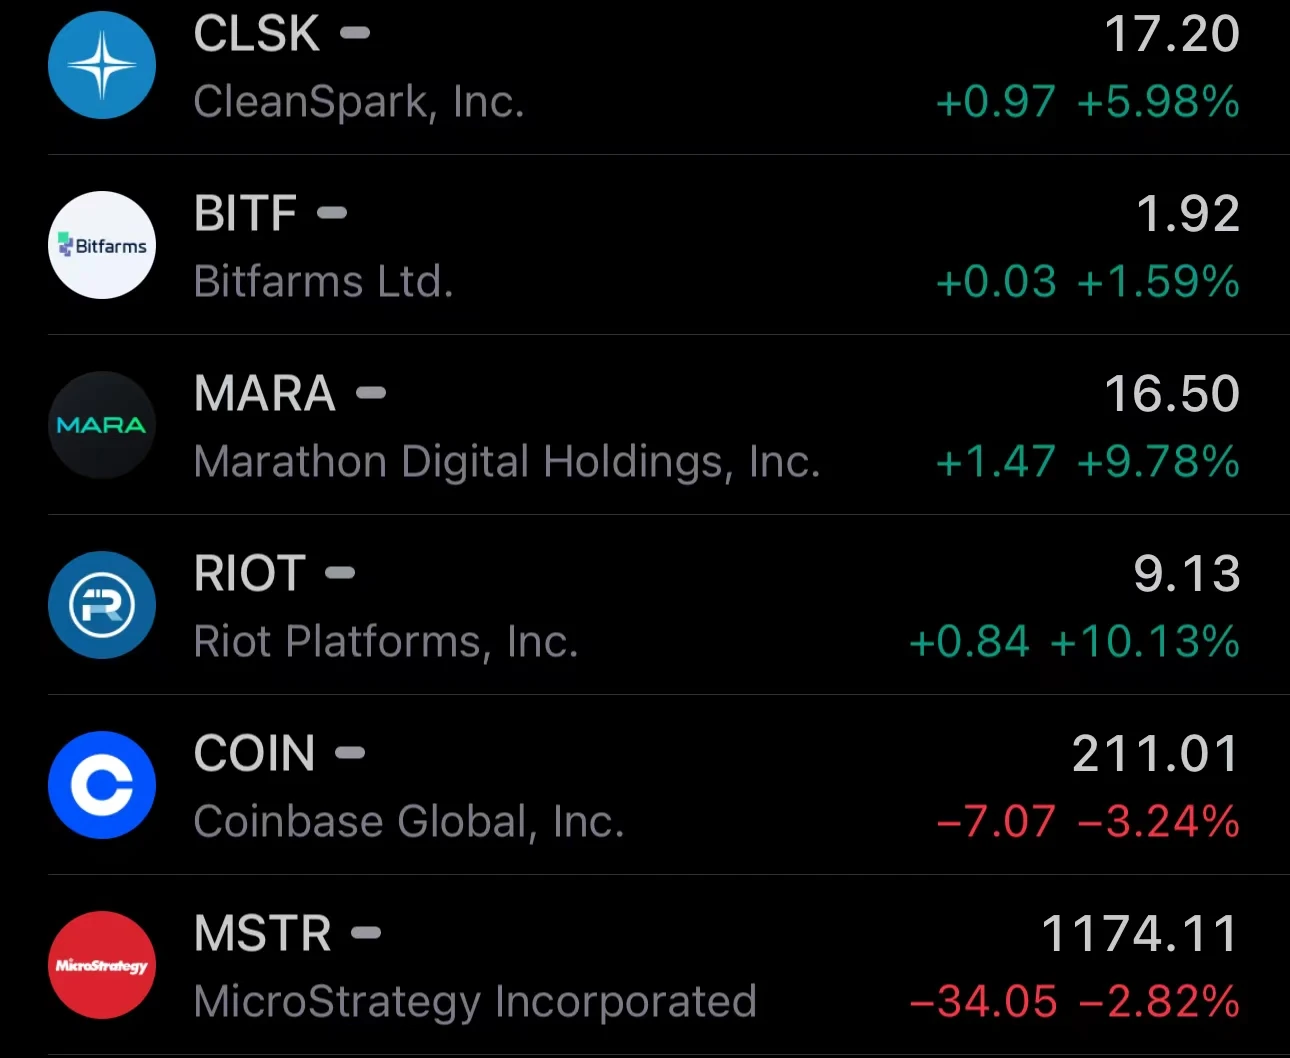
Electricity costs are the largest expense for miners, typically accounting for 75-85% of a miners total cash operating expenses. The average electricity cost for US stock miners is about $0.04/kWh. Based on this cost, VanEck estimates that the total cash cost of the top 10 listed miners after the halving is about $45,000/BTC. Despite the shrinking profits, it is likely to remain profitable. Historically, Bitcoin mining stocks have recovered strongly after the halving and outperformed spot prices in the halving year. Miner stocks seemed to react in advance on Friday:
An interesting topic: Does reflexivity occur?
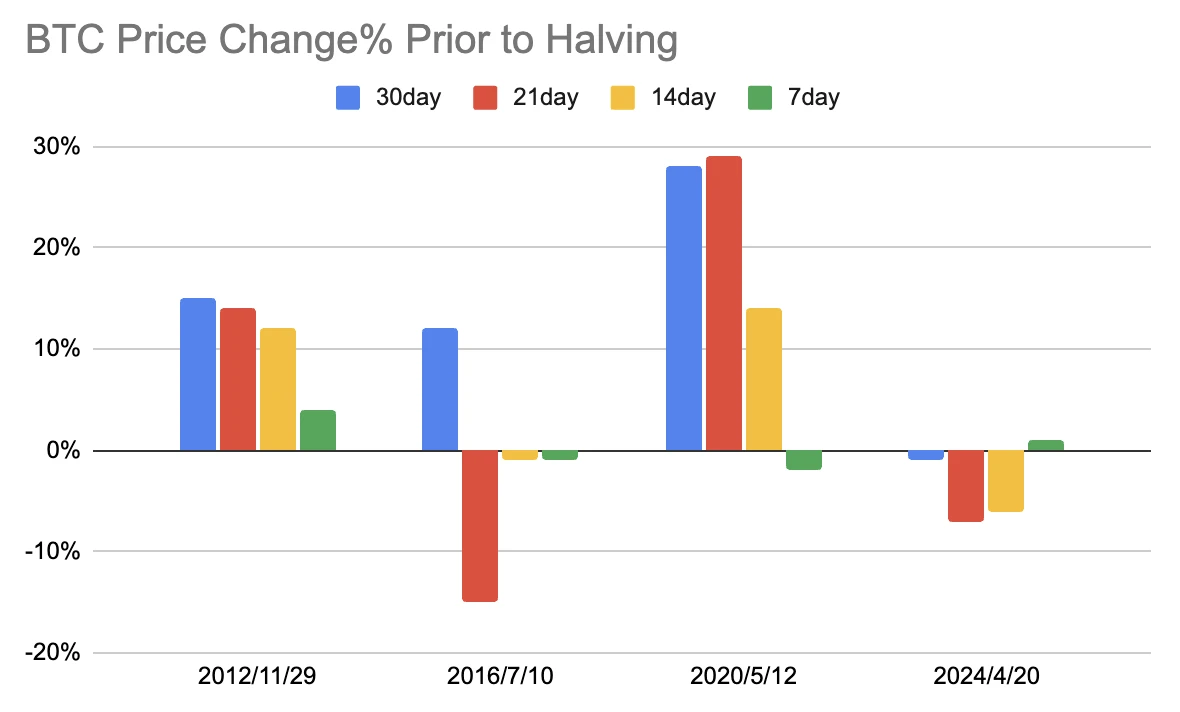
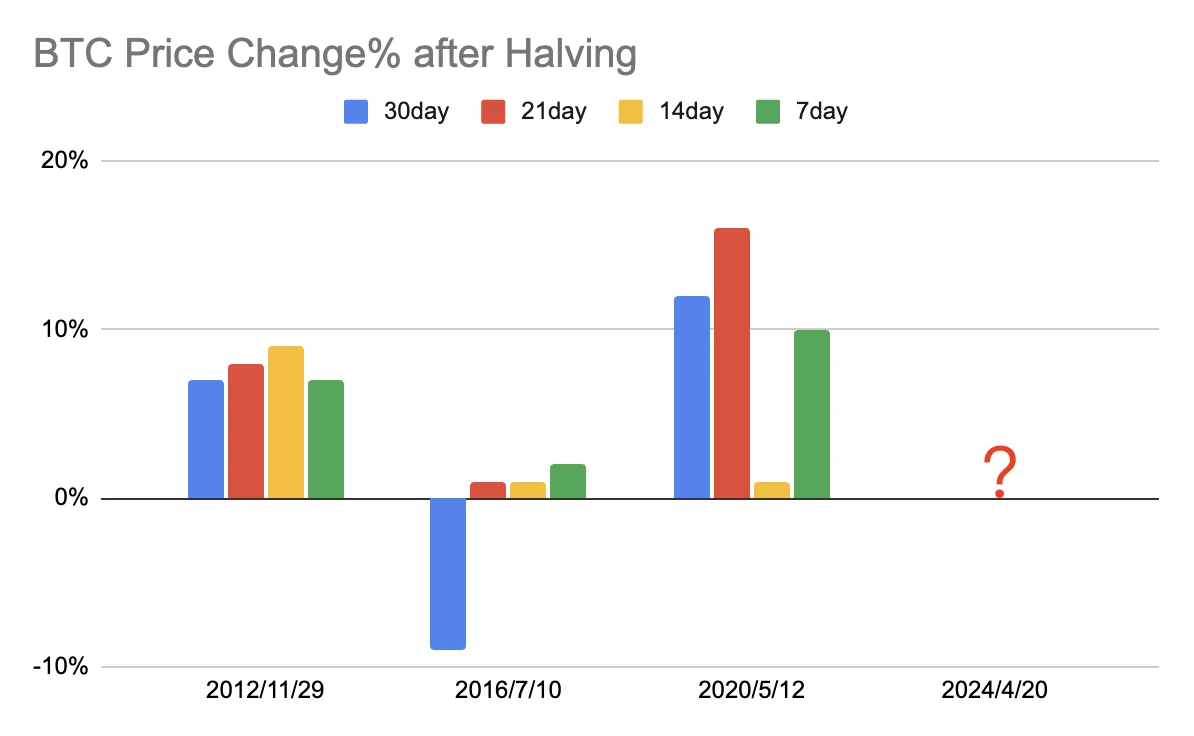
Because almost everyone knows that based on the history of the previous three times, Bitcoin will rise before the halving and fall or consolidate sideways after the halving.
Due to limited historical data, the same story was repeated in the first three times. In addition, the market was too small during the first halving in 2012 and CEX had just appeared, so the reference value is limited.
But in reality in financial markets, we don’t often see the same pattern happen repeatedly because professional investors tend to trade in advance.
So will this time be different from before?
In the history of the four halvings, this year is similar to 2016, with a sharp correction in the three weeks before the halving, reflecting that the market wanted to cash in on the positive news in advance, and the market continued to fall by more than 10% one month after the halving in 2016. In 2012 and 2020, the market rose a few weeks before and after the halving. Therefore, the view of the pessimists represented by JPM that since there has been a sharp rise before, the positive news has been digested in advance is not solid.
This week’s focus
43% of SPX constituents will release earnings this week, with Microsoft, Meta Platforms, Google and Tesla being the main players. Q1 GDP data, March PCE and manufacturing PMI values will be released this week.
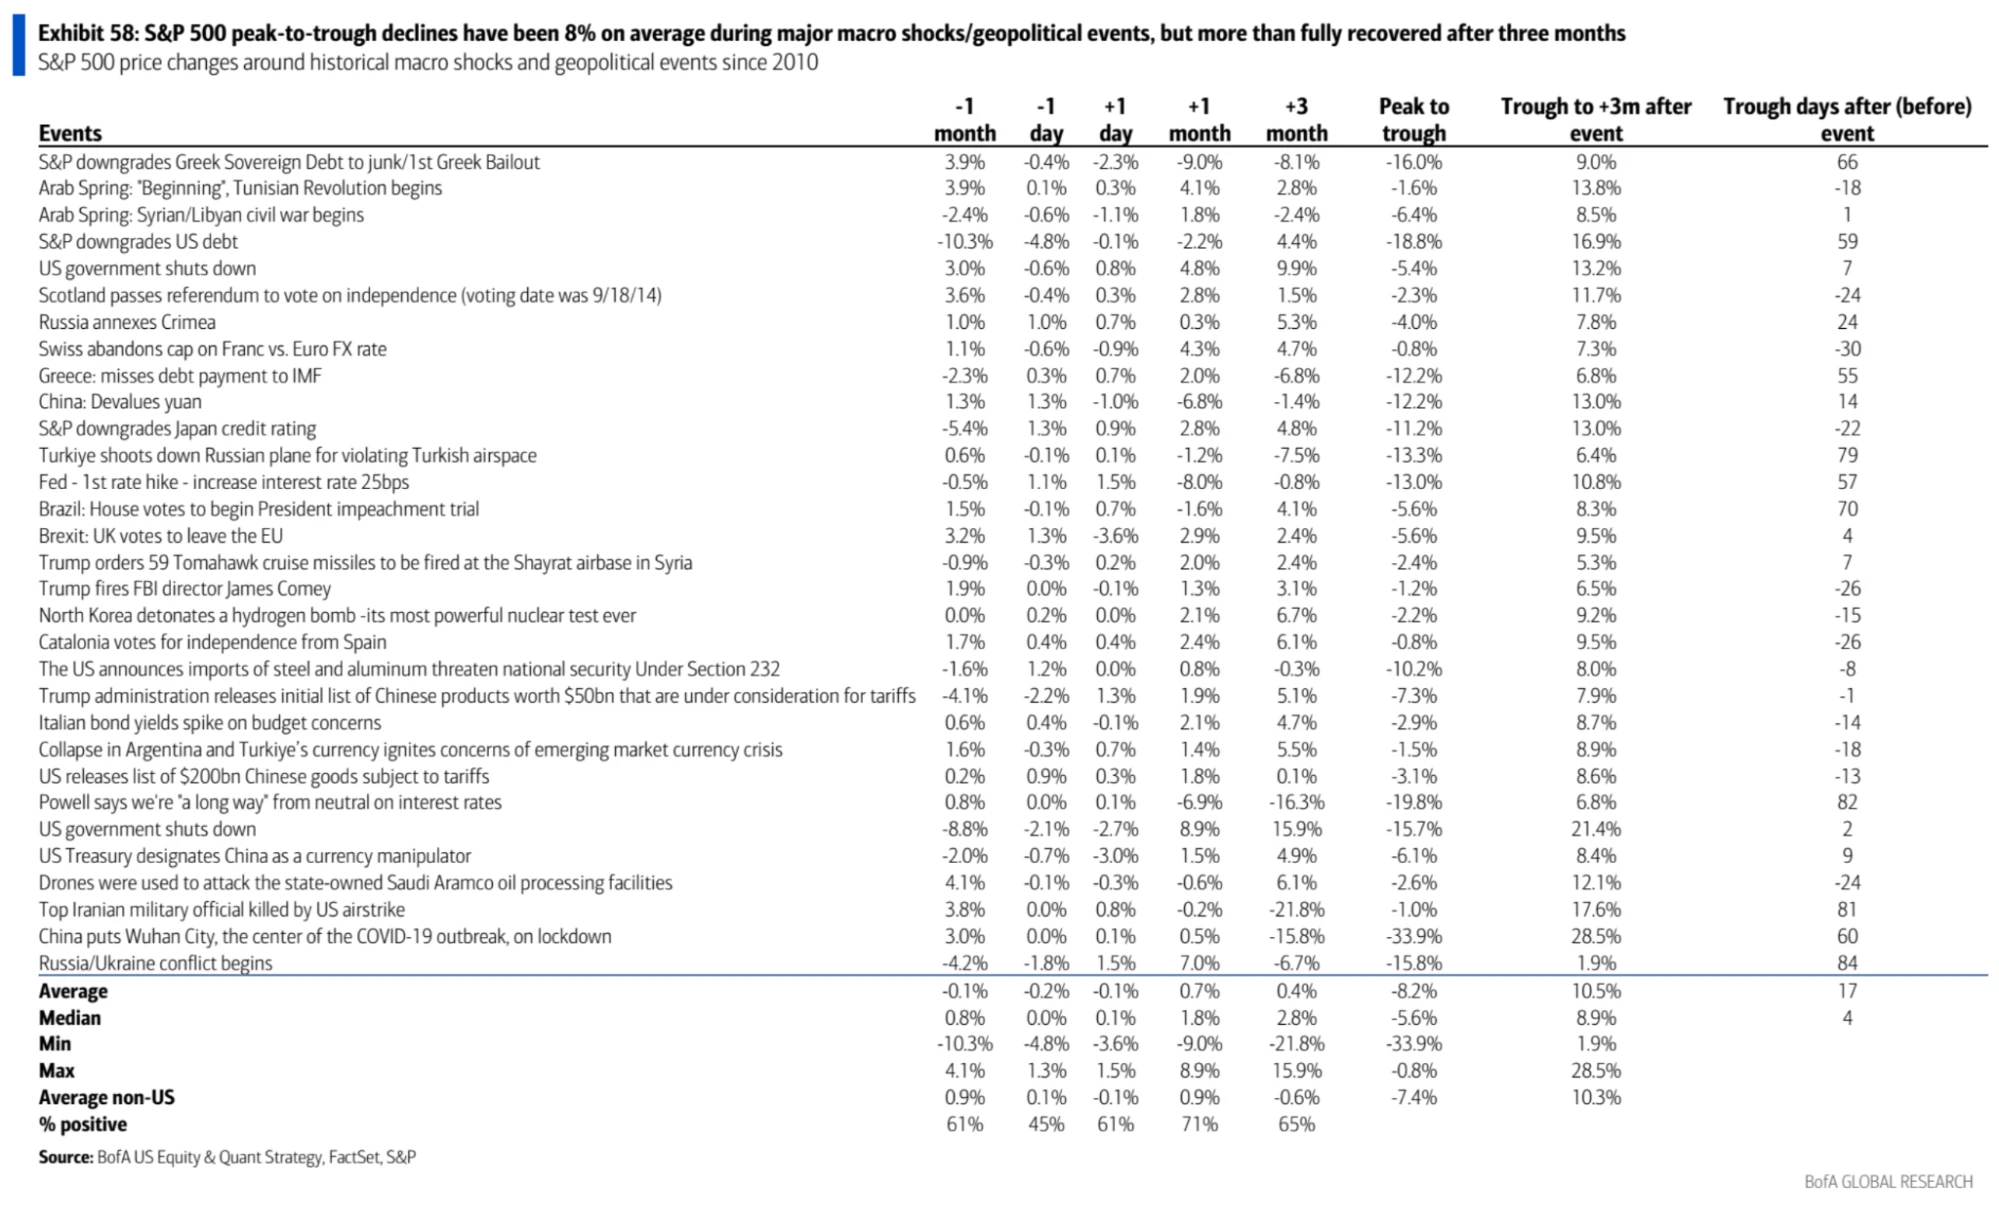
A report from Bank of America reviewed the performance of the SP 500 during major macro shocks/geopolitical events in history, pointing out that the average decline from peak to trough of the SP 500 during these major events was 8%, but it rebounded by an average of 10.5% three months later. The average number of days it took for the market to reach the trough after the event was only 17 days, with a median of only 4 days. It seems that the callback time caused by the Israeli-Palestinian conflict has exceeded this level.