


Ethereums ETF surges 18% ahead of approval
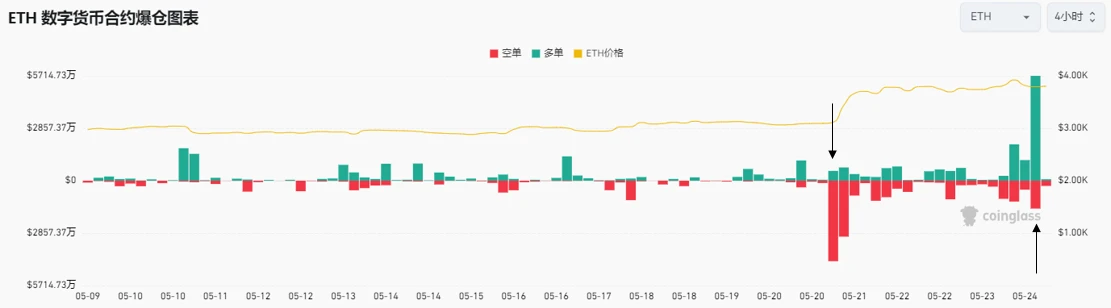
https://www.coinglass.com/en/LiquidationData
On 2024.05.20, according to Bloomberg analysts: SEC is asking exchanges to speed up the submission of Ethereum spot ETF 19 b-4 documents. Bloomberg analysts also raised the chance of Ethereum spot ETF passing on 5/23 to 75%. ETH soared 18%, and the short position liquidation volume on that day was as high as 75 million US dollars. After it was officially passed on 2024.5.23, Ethereum fell from a high of 3,950 US dollars to a low of 3,524 US dollars, and the long position liquidation volume was as high as 88.16 million US dollars, and then rebounded back to 3,800 US dollars.
On May 20, 2024, the U.S. Securities and Exchange Commission (SEC) asked exchanges to speed up the submission of 19 b-4 documents for Ethereum spot exchange-traded funds (ETFs). Bloomberg analysts predicted that the approval rate of Ethereum spot ETFs would increase to 75%. Under this news, the price of Ethereum rose sharply, up 18%. The short contract liquidation volume on that day was as high as 75 million US dollars.
However, on May 23, 2024, after the Ethereum spot ETF was officially approved, the price of Ethereum fell sharply. The highest price fell from $3,950 to the lowest price of $3,524. At this time, long contracts also exploded, with a liquidation volume of up to $88.16 million. Subsequently, the price of Ethereum rebounded and returned to $3,800.
There are about 20 days until the next Fed meeting (June 13, 2024)
https://hk.investing.com/economic-calendar/interest-rate-decision-168
Market technical and sentiment environment analysis
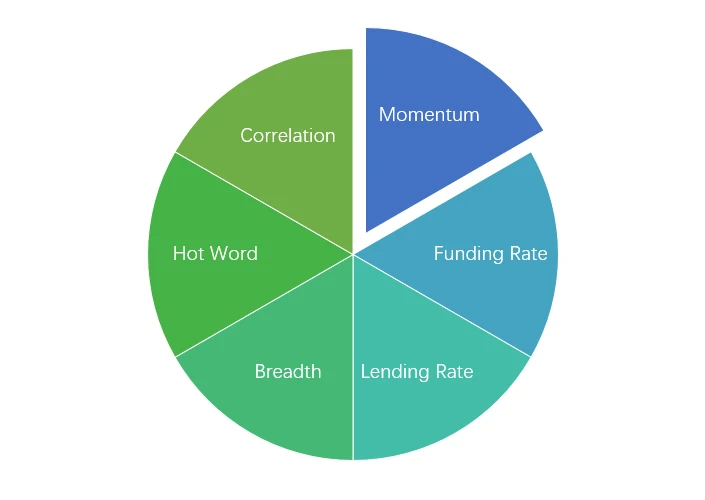
Sentiment Analysis Components

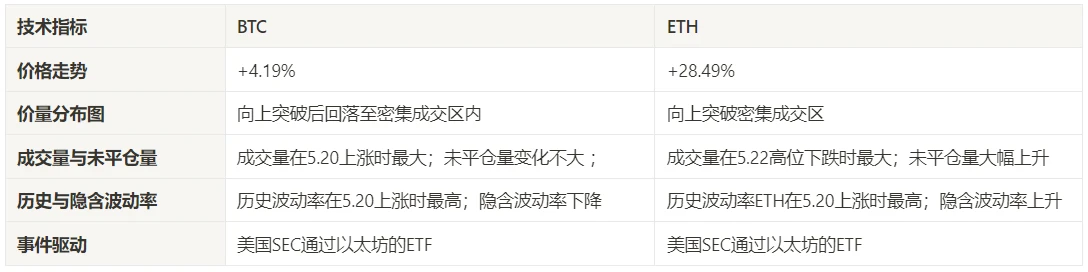
Technical indicators
Price trend
BTC price increased by +4.19% and ETH price increased by +28.49% in the past week.
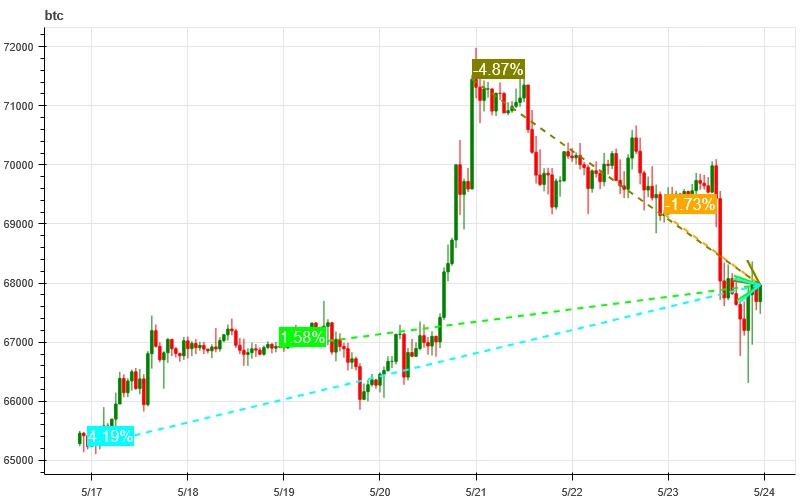
The above picture is the price chart of BTC in the past week.
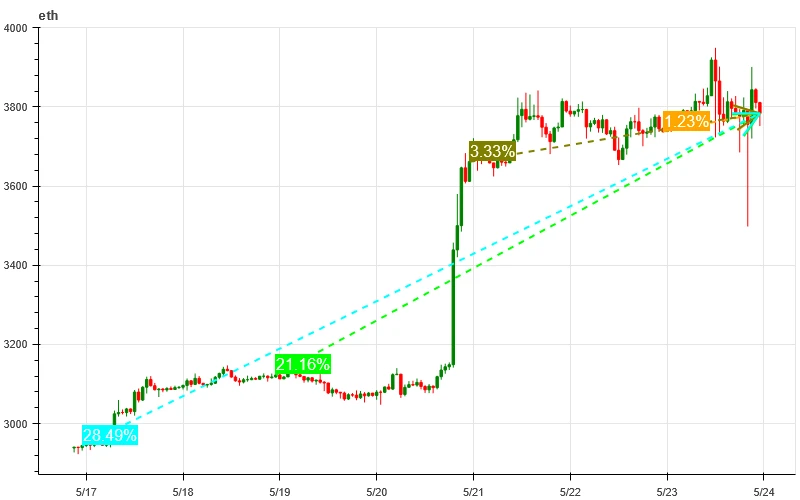
The above picture is the price chart of ETH in the past week.
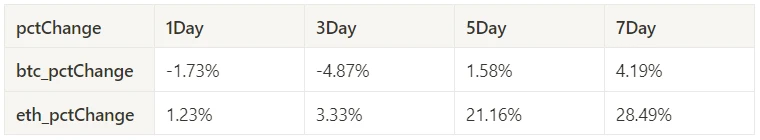
The table shows the price change rate over the past week.
Price Volume Distribution Chart (Support and Resistance)
In the past week, the BTC price broke upward and then fell back into the area of intensive trading, while the ETH price broke upward out of the area of intensive trading.
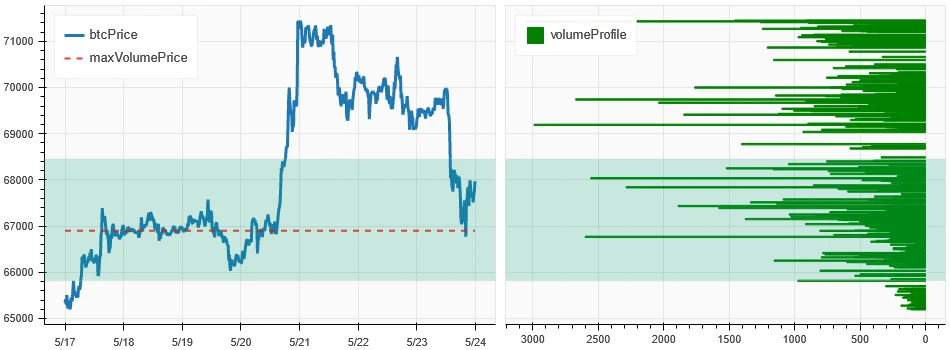
The above picture shows the distribution of BTCs dense trading areas in the past week.
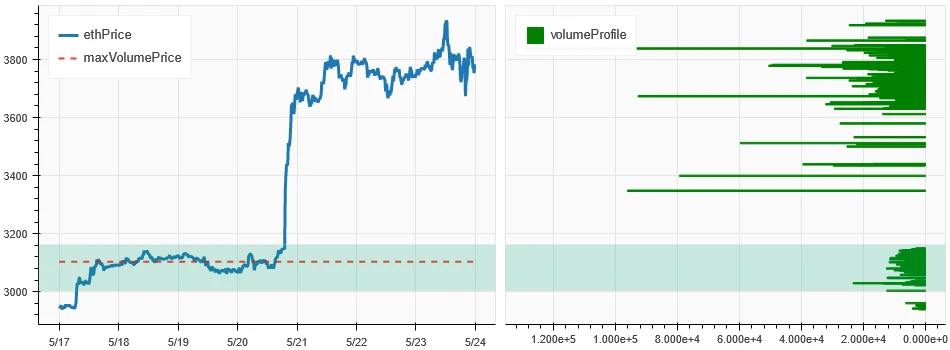
The above picture shows the distribution of ETHs dense trading areas in the past week.
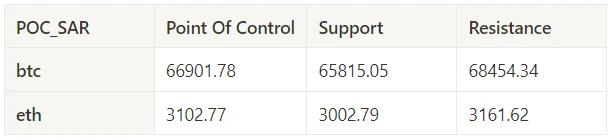
The table shows the weekly intensive trading range of BTC and ETH in the past week.
Volume and Open Interest
Over the past week, volume was largest for BTC when it rose to 5.20 and largest for ETH when it fell to 5.22 highs; open interest for BTC did not change much while ETH rose sharply.
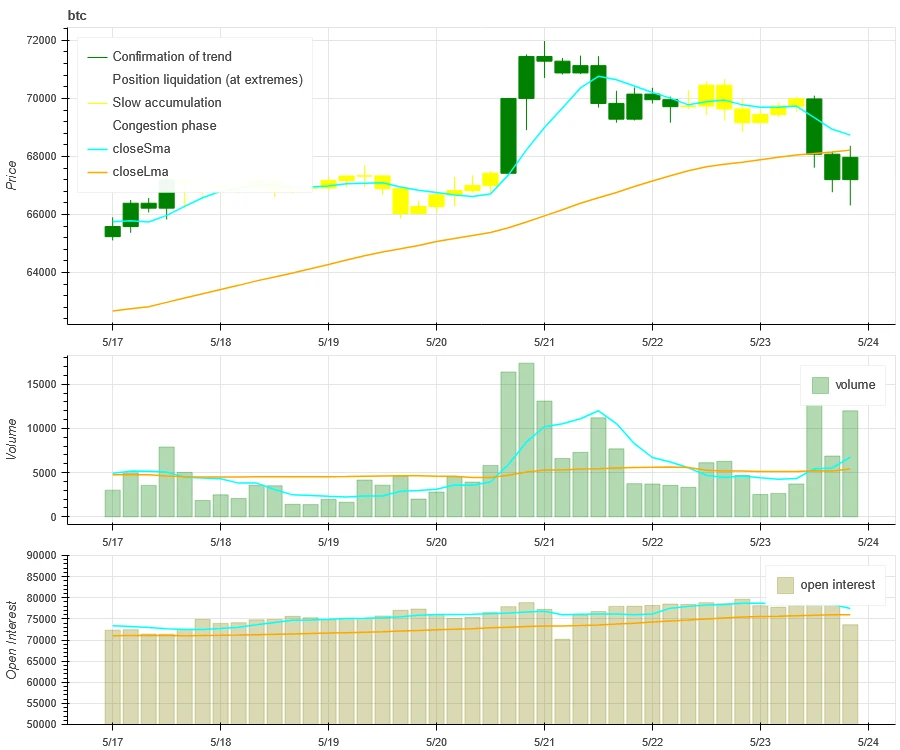
The top of the above picture shows the price trend of BTC, the middle shows the trading volume, the bottom shows the open interest, the light blue is the 1-day average, and the orange is the 7-day average. The color of the K-line represents the current state, green means the price rise is supported by the trading volume, red means closing positions, yellow means slowly accumulating positions, and black means crowded state.
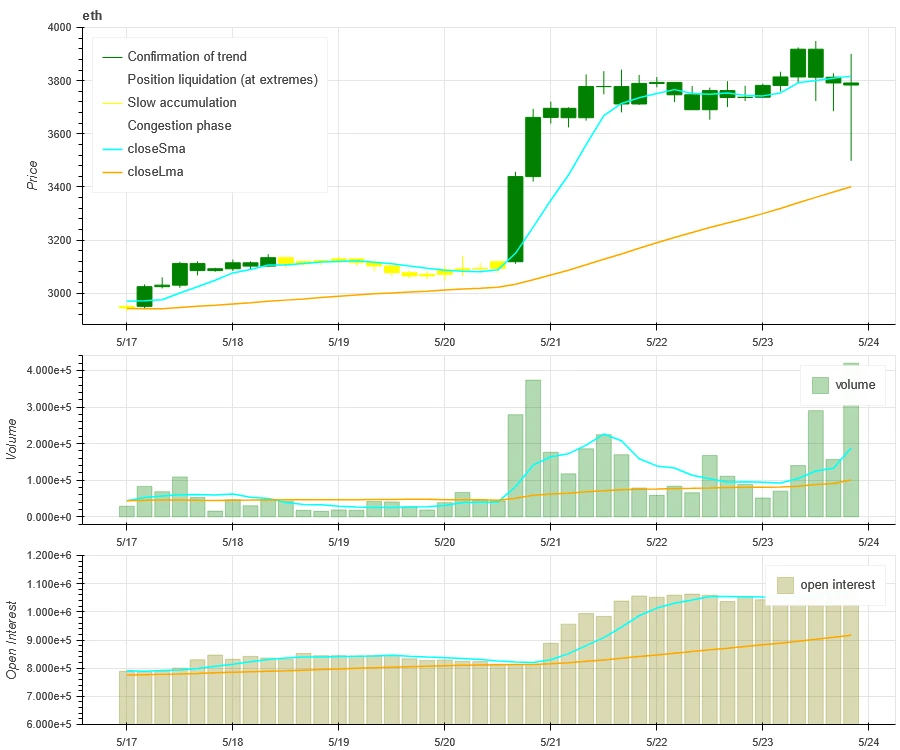
The top of the above picture shows the price trend of ETH, the middle is the trading volume, the bottom is the open interest, the light blue is the 1-day average, and the orange is the 7-day average. The color of the K-line represents the current state, green means the price rise is supported by the trading volume, red is closing positions, yellow is slowly accumulating positions, and black is crowded.
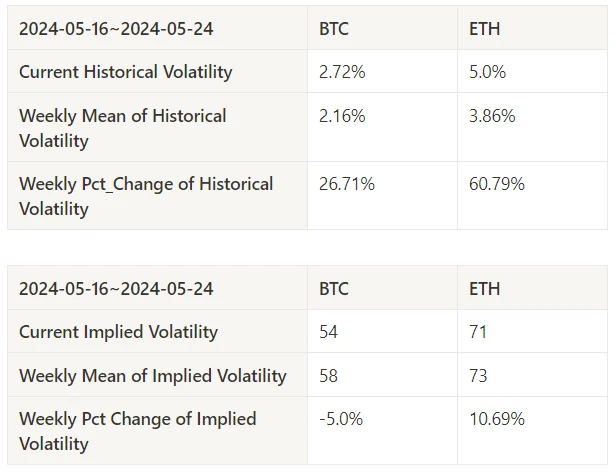
Historical Volatility vs. Implied Volatility
Historical volatility for BTC and ETH was highest this past week when it rose to 5.20; implied volatility for BTC fell while ETH rose.
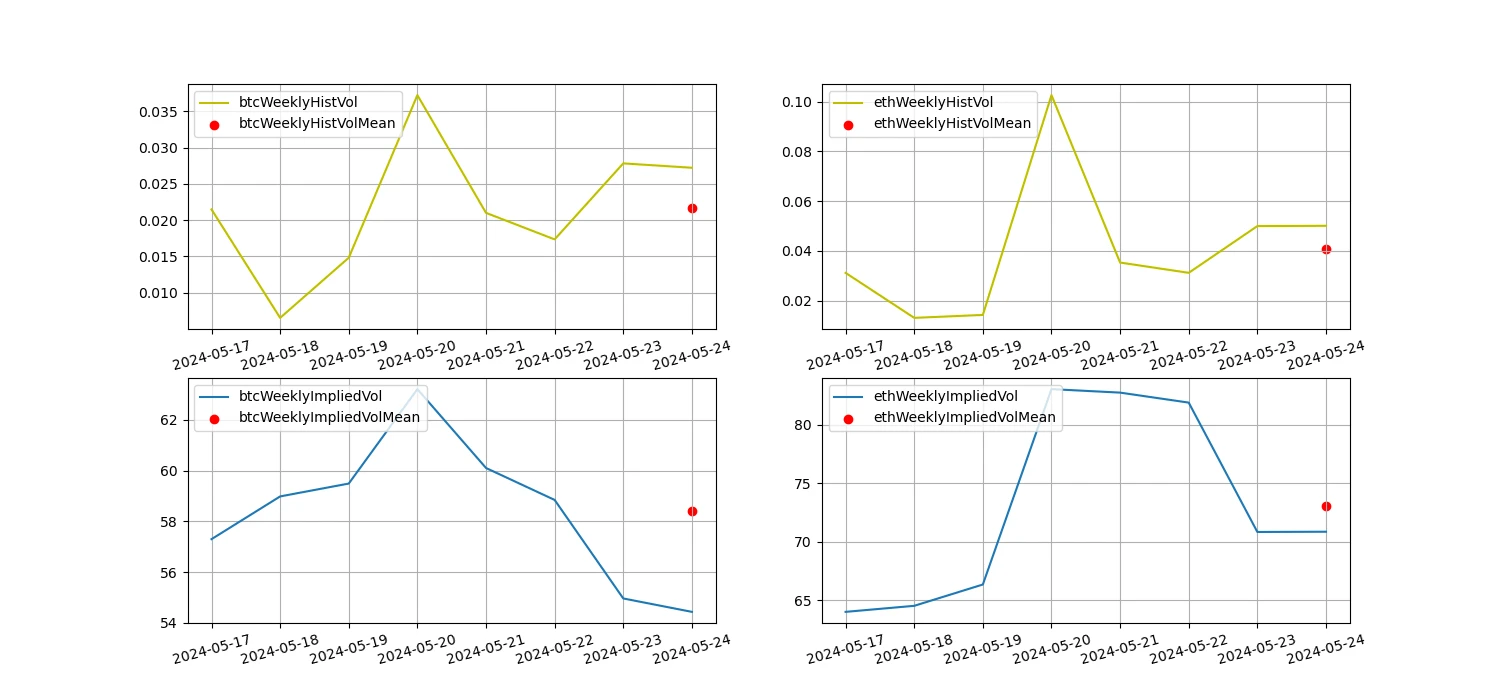
The yellow line is the historical volatility, the blue line is the implied volatility, and the red dot is its 7-day average.
Event-driven
In terms of events, this week the US SEC approved Ethereums ETF. The price rose by about 18% before the approval, and after the approval, the price fell sharply from a high and then rebounded.
Sentiment Indicators
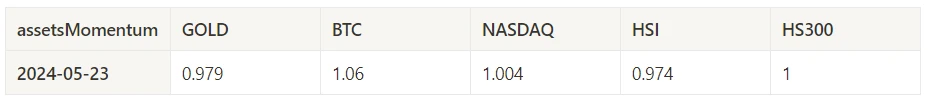
Momentum Sentiment
In the past week, among Bitcoin/Gold/Nasdaq/Hang Seng Index/CSI 300, Bitcoin was the strongest, while Hang Seng Index performed the worst.
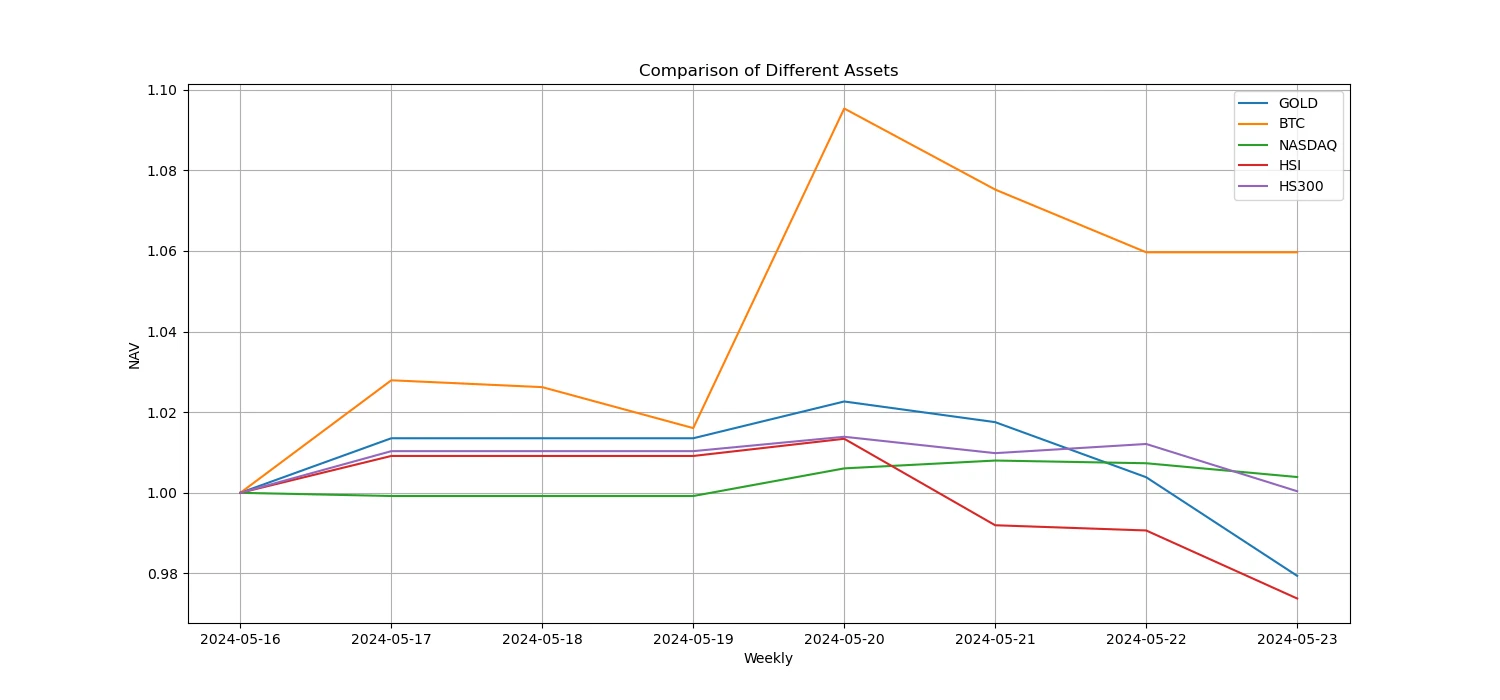
The above picture shows the trend of different assets in the past week.
Lending Rate_Lending Sentiment
The average annualized return on USD lending over the past week was 12.1%, and short-term interest rates rose slightly.
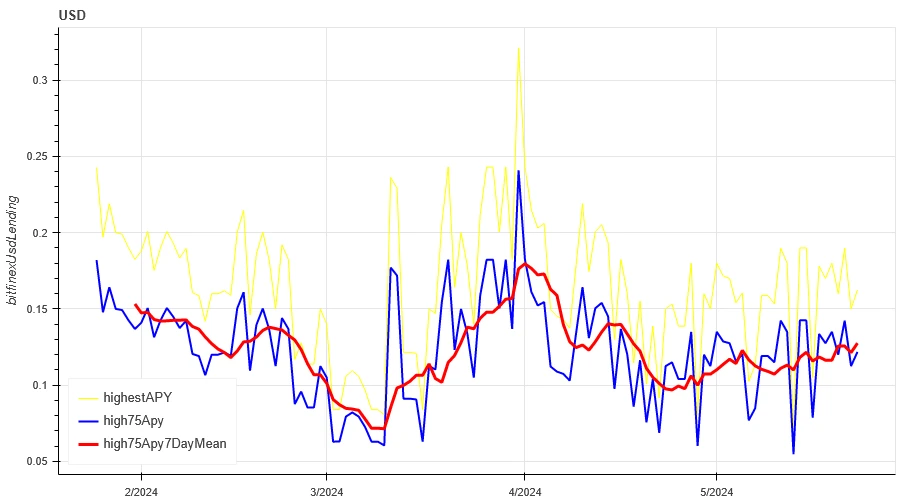
The yellow line is the highest price of USD interest rate, the blue line is 75% of the highest price, and the red line is the 7-day average of 75% of the highest price.
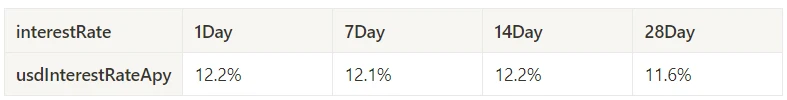
The table shows the average returns of USD interest rates at different holding days in the past
Funding Rate_Contract Leverage Sentiment
The average annualized return on BTC fees in the past week was 6.8%, and contract leverage sentiment rebounded from a low level.
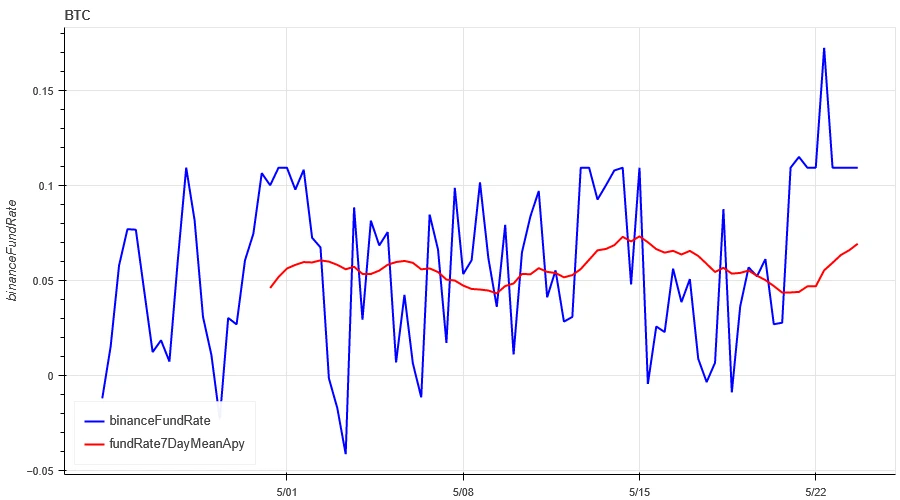
The blue line is the funding rate of BTC on Binance, and the red line is its 7-day average
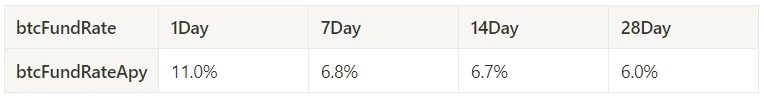
The table shows the average return of BTC fees for different holding days in the past.
Market Correlation_Consensus Sentiment
The correlation among the 129 coins selected in the past week rose to around 0.85, and the consistency between different varieties increased significantly.
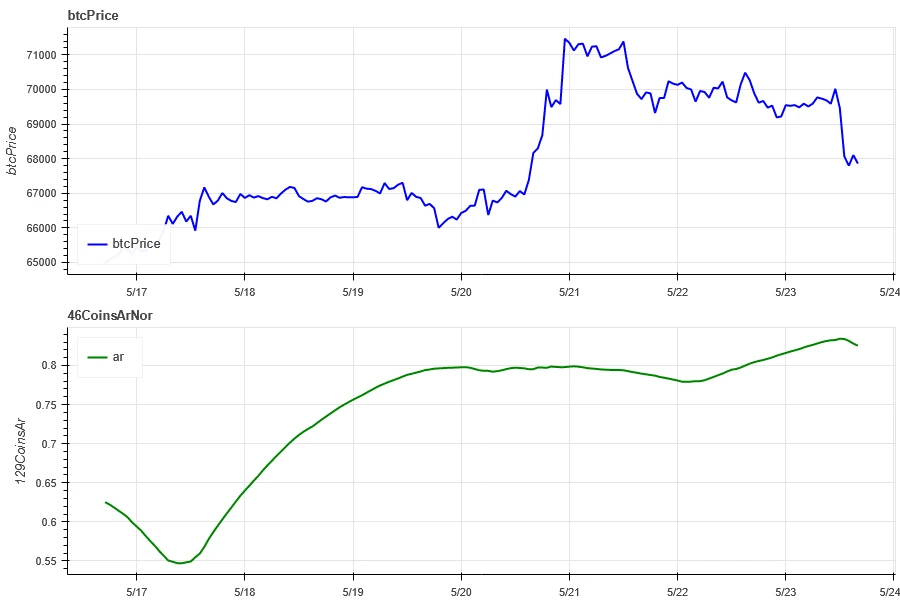
In the above figure, the blue line is the price of Bitcoin, and the green line is [1000 floki, 1000 lunc, 1000 pepe, 1000 shib, 100 0x ec, 1inch, aave, ada, agix, algo, ankr, ant, ape, apt, arb, ar, astr, atom, audio, avax, axs, bal, band, bat, bch, bigtime, blur, bnb, btc, celo, cfx, chz, ckb, comp, crv, cvx, cyber, dash, doge, dot, dydx, egld, enj, ens, eos,etc, eth, fet, fil, flow, ftm, fxs, gala, gmt, gmx, grt, hbar, hot, icp, icx, imx, inj, iost, iotx, jasmy, kava, klay, ksm, ldo, link, loom, lpt, lqty, lrc, ltc, luna 2, magic, mana, matic, meme, mina, mkr, near, neo, ocean, one, ont, op, pendle, qnt, qtum, rndr, rose, rune, rvn, sand, sei, sfp, skl, snx, sol, ssv, stg, storj, stx, sui, sushi, sxp, theta, tia, trx, t, uma, uni, vet, waves, wld, woo, xem, xlm, xmr, xrp, xtz, yfi, zec, zen, zil, zrx] overall correlation
Market Breadth_Overall Sentiment
Among the 129 coins selected in the past week, 77% of the prices were above the 30-day moving average, 31% of the prices were above the 30-day moving average relative to BTC, 20% of the prices were greater than 20% from the lowest price in the past 30 days, and 57% of the prices were less than 10% from the highest price in the past 30 days. The market breadth indicator in the past week showed that the overall market was gradually entering an upward trend.
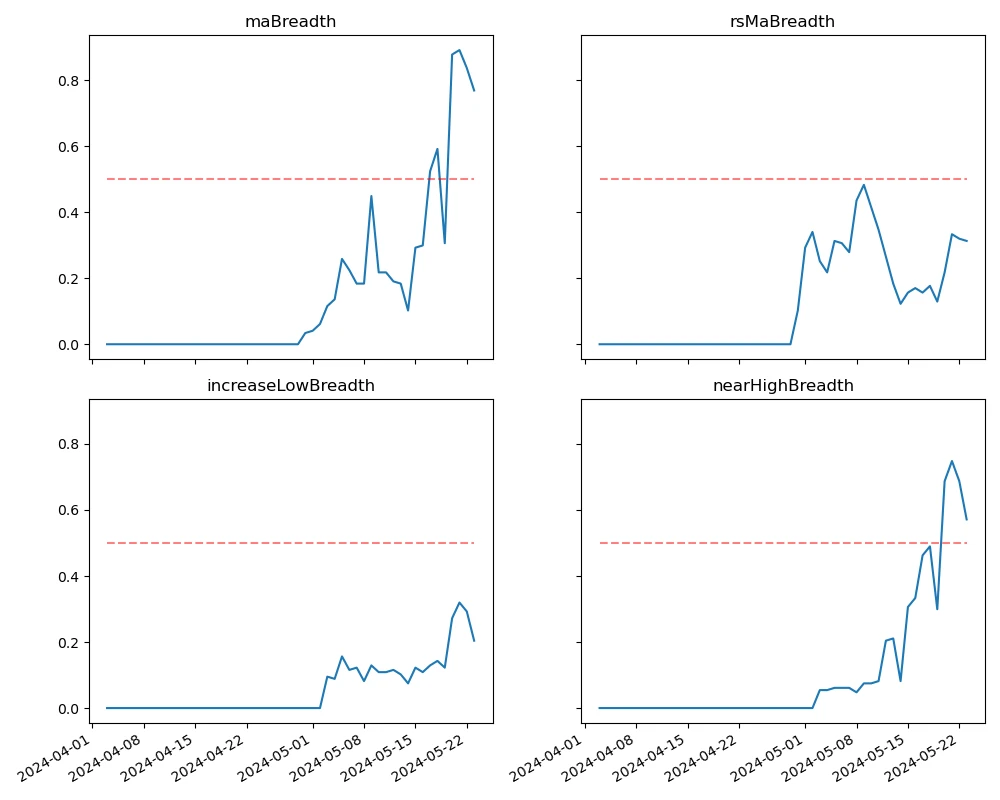
The above picture shows [bnb, btc, sol, eth, 1000 floki, 1000 lunc, 1000 pepe, 1000 sats, 1000 shib, 100 0x ec, 1inch, aave, ada, agix, ai, algo, alt, ankr, ape, apt, arb, ar, astr, atom, audio, avax, axs, bal, band, bat, bch, bigtime, blur, cake, celo, cfx, chz, ckb, comp, crv, cvx, cyber, dash, doge, dot, dydx, egld, enj, ens, eos,etc, fet, fil, flow, ftm, fxs, gala, gmt, gmx, grt, hbar, hot, icp, icx, idu, imx, inj, iost, iotx, jasmy, jto, jup, kava, klay, ksm, ldo, link, loom, lpt, lqty, lrc, ltc, luna 2, magic, mana, manta, mask, matic, meme, mina, mkr, near, neo, nfp, ocean, one, ont, op, ordi, pendle, pyth, qnt, qtum, rndr, robin, rose, rune, rvn, sand, sei, sfp, skl, snx, ssv, stg, storj, stx, sui, sushi, sxp, theta, tia, trx, t, uma, uni, vet, waves, wif, wld, woo,xai, xem, xlm, xmr, xrp, xtz, yfi, zec, zen, zil, zrx ] 30-day proportion of each width indicator

Summarize
In the past week, the prices of Bitcoin (BTC) and Ethereum (ETH) both rose on the news of the Ethereum ETF predicted by Bloomberg analysts on May 20, but after the ETF was officially passed, Ethereum rebounded after falling from a high. In this process, the historical volatility of Bitcoin and Ethereum reached its maximum. Specifically, Bitcoins trading volume reached its maximum when it rose on May 20, and Ethereums trading volume also reached its maximum when Ethereum rebounded after falling from a high on May 23. In terms of open interest, Bitcoin did not change much, while Ethereums open interest rose sharply. In addition, Bitcoins implied volatility fell, while Ethereums implied volatility rose. The funding rate rebounded from a low level, and the market breadth indicator showed that the market was gradually entering an upward trend. In terms of events, the U.S. Securities and Exchange Commission (SEC) passed the Ethereum ETF this week, causing Ethereum to rise by about 18% before passing. However, after the ETF was officially passed, the price of Ethereum rebounded after a sharp drop from a high.
Twitter: @DerivativesCN
Website: https://dcbot.ai/


