


Others are panicking but I am greedy. Can I buy BTC at the bottom?

1. The German government liquidates a large amount of Bitcoin
On-chain data shows that the German government recently transferred more than $195 million worth of Bitcoin to various crypto exchanges, including Coinbase, Kraken and Bitstamp, a move that has exacerbated market volatility. Critics believe that such a large-scale government sell-off could have a long-term negative impact on the stability of the crypto market. These Bitcoins originated from an investigation into the illegal website Movie 2 k.to, when approximately 50,000 Bitcoins were seized.
2. Panic has not occurred yet, but irrational emotions are likely to spread
Although the market implied volatility is currently at a low level, it has been on an upward trend in recent years. This shows that market sentiment is beginning to become more unstable. Although panic has not yet occurred, irrational emotions are likely to spread.
3. The opportunity to buy at the bottom comes after the real panic occurs
When there is a real panic in the market, prices tend to fall significantly below the intrinsic value of the asset. This is the best time for bargain hunters to exit, as they can buy high-value assets at very attractive prices. Investors should remain calm and wait for further developments in the market to seize the real bargain hunting opportunities.
Specific reference to several time nodes of Bitcoin:
March 2020 -33%, implied volatility 190
Bitcoin Performance: In March 2020, the price of Bitcoin fell to a low of around $4,000. The crash became known as “Black Thursday,” as Bitcoin plunged more than 50% from a high of around $9,000 in just a few days.
Bottom-picking signal: Despite the panic in the market, the plunge also provided an excellent opportunity for bottom-pickers. As governments and central banks around the world launched massive economic stimulus plans, Bitcoin rebounded rapidly in the following months, recovering and breaking through the all-time high of $20,000 by the end of the year.
May 2021 -45%, implied volatility 160
Bitcoin Performance: In May 2021, the price of Bitcoin fell to a low of around $30,000. The plunge was about half of Bitcoin’s value from its all-time high of nearly $65,000 in April.
Bottom-picking signal: Despite the panic selling in the market, bottom-pickers and long-term investors quickly stepped in, believing that the long-term prospects of Bitcoin remained optimistic. Subsequently, the price of Bitcoin gradually recovered and broke through the $60,000 level again by the end of 2021.
June and November 2022 -22%, implied volatility 110
Bitcoin Performance: In November 2022, the price of Bitcoin fell to a low of approximately $16,000. The plunge reflected a significant blow to market confidence in the crypto industry, especially a crisis of confidence in some major trading platforms.
Bottom-picking signal: Despite this, some investors believe that this is a great entry point for long-term holding of Bitcoin. As the market gradually digested the negative news, the price of Bitcoin stabilized in the following months and showed some signs of rebound.
July 2024 -8%, implied volatility rises to 57.5, bottom-fishing still needs to wait
Although the current market implied volatility has increased, it has not yet reached a real panic level. Investors should pay close attention to market trends and wait for more obvious panic signals to appear before buying at the bottom.
Summarize
The plunges and subsequent bottoms at the above time points provide valuable lessons for investors. Short-term market fluctuations should not affect the assessment of the long-term value of Bitcoin. After waiting for panic selling to occur, calm investors can often find undervalued assets and get rich returns when the market recovers.
There are about 24 days until the next Federal Reserve interest rate meeting (2024.08.01)
https://hk.investing.com/economic-calendar/interest-rate-decision-168
Market technical and sentiment environment analysis

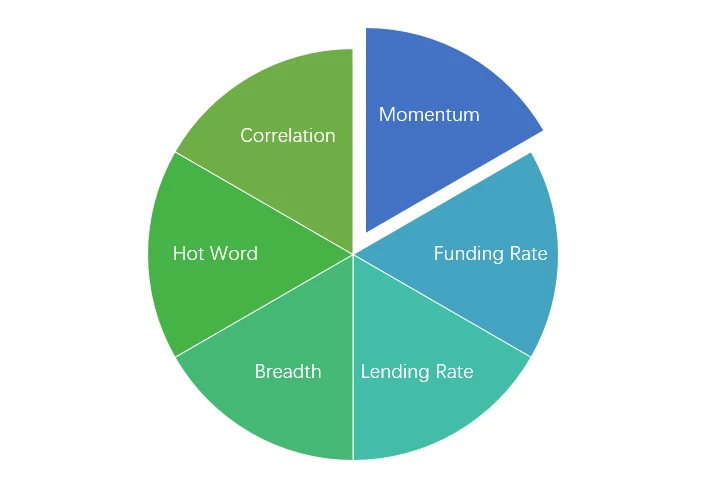
Sentiment Analysis Components

Technical indicators
Price trend
BTC price fell -7.55% and ETH price fell -11.32% in the past week.
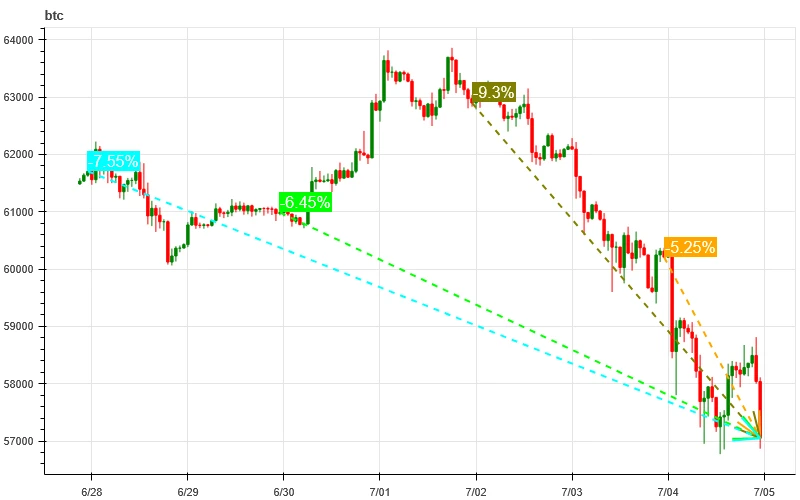
The above picture is the price chart of BTC in the past week.
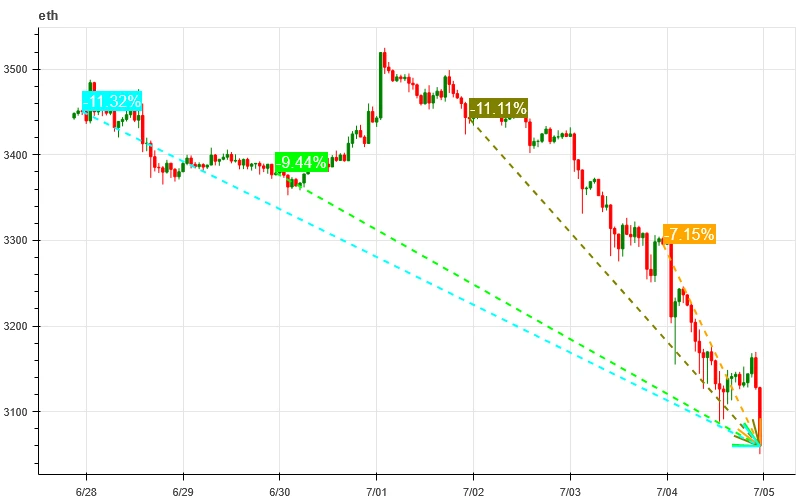
The above picture is the price chart of ETH in the past week.
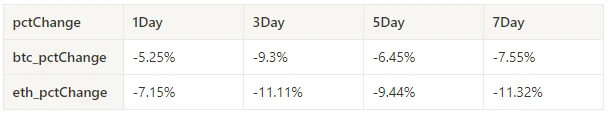
The table shows the price change rate over the past week.
Price Volume Distribution Chart (Support and Resistance)
Over the past week, BTC and ETH continued to fall after breaking down from the dense trading area at 7.04.
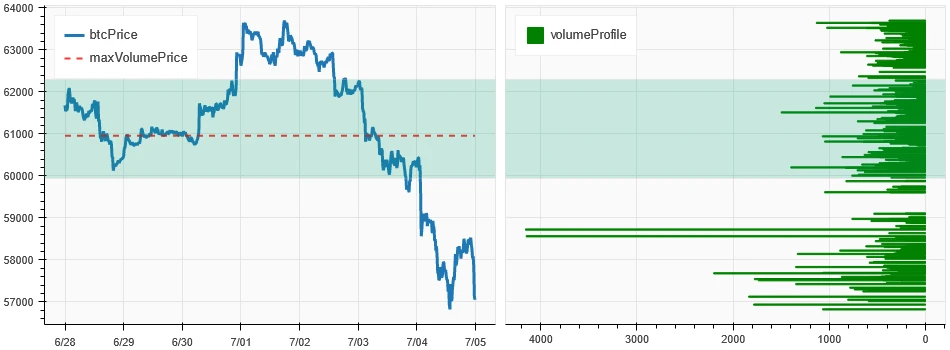
The above picture shows the distribution of BTCs dense trading areas in the past week.
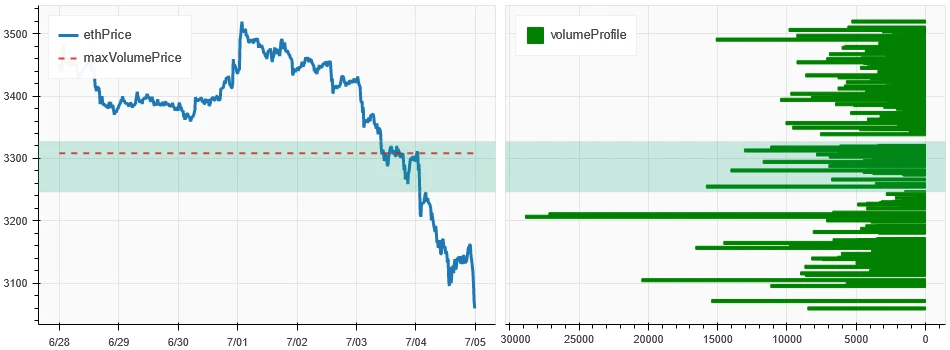
The above picture shows the distribution of ETHs dense trading areas in the past week.
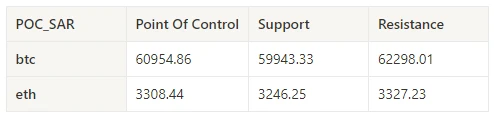
The table shows the weekly intensive trading range of BTC and ETH in the past week.
Volume and Open Interest
Over the past week, BTC and ETH had the largest trading volume when they fell on July 4; open interest for both BTC and ETH continued to rise.
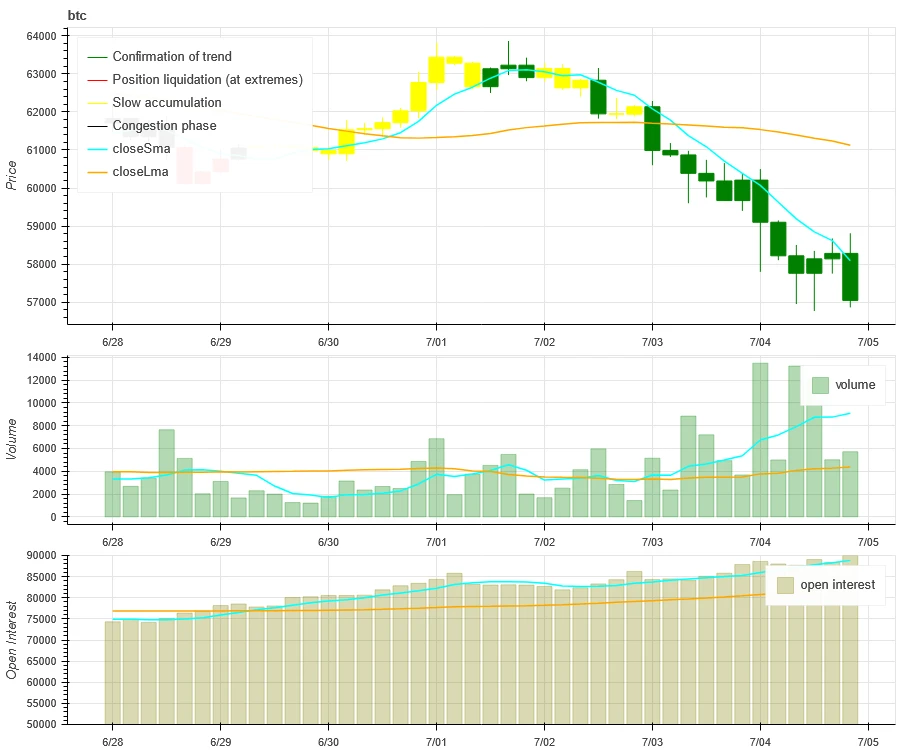
The top of the above picture shows the price trend of BTC, the middle shows the trading volume, the bottom shows the open interest, the light blue is the 1-day average, and the orange is the 7-day average. The color of the K-line represents the current state, green means the price rise is supported by the trading volume, red means closing positions, yellow means slowly accumulating positions, and black means crowded state.
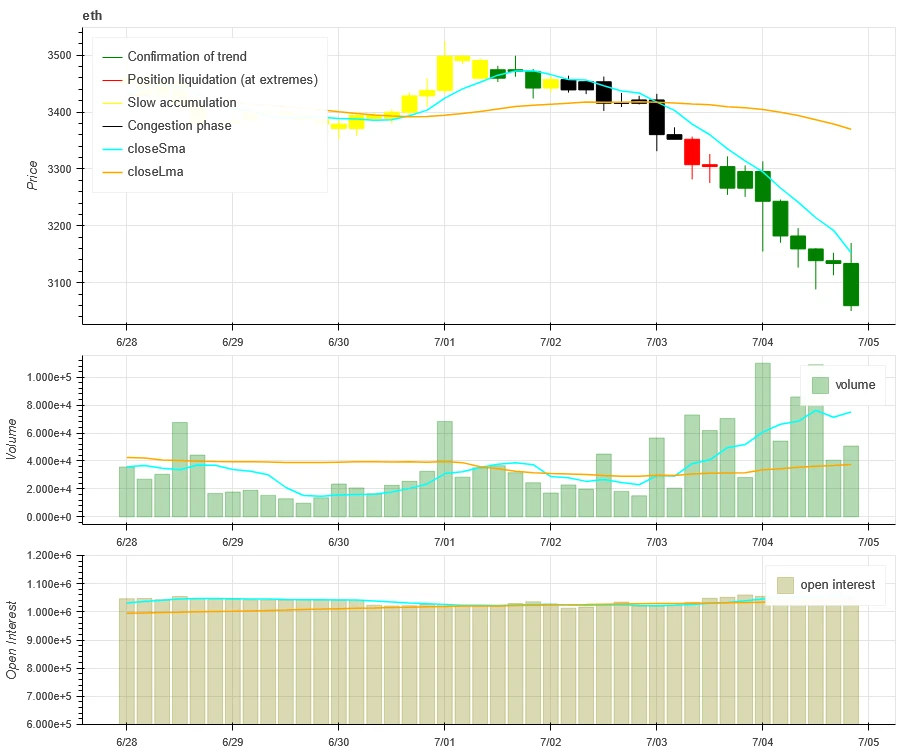
The top of the above picture shows the price trend of ETH, the middle is the trading volume, the bottom is the open interest, the light blue is the 1-day average, and the orange is the 7-day average. The color of the K-line represents the current state, green means the price rise is supported by the trading volume, red is closing positions, yellow is slowly accumulating positions, and black is crowded.
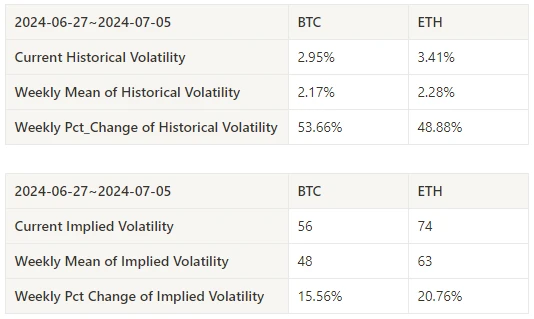
Historical Volatility vs. Implied Volatility
In the past week, the historical volatility of BTC and ETH was the highest when it fell to 7.4; the implied volatility of BTC and ETH rose simultaneously.
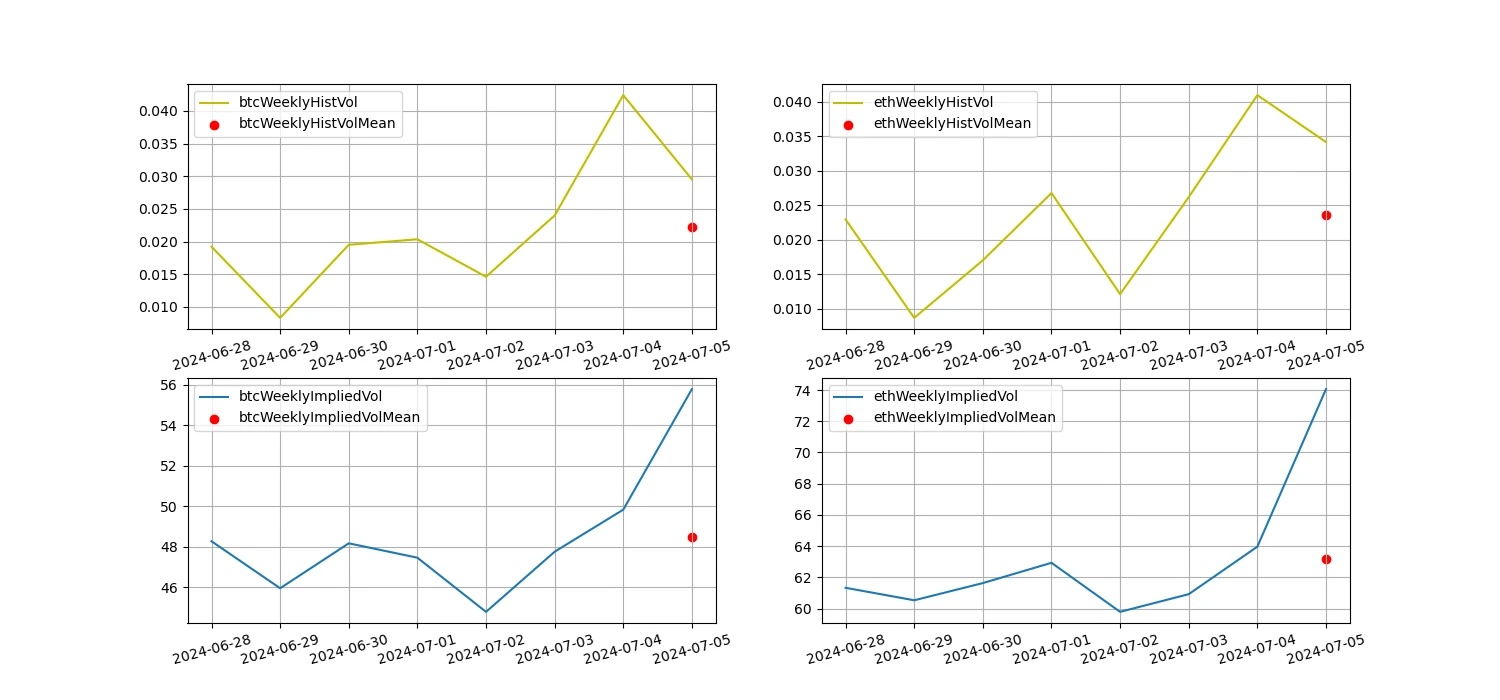
The yellow line is the historical volatility, the blue line is the implied volatility, and the red dot is its 7-day average.
Event-driven
No data was released in the past week.
Sentiment Indicators
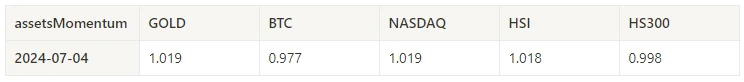
Momentum Sentiment
In the past week, among Bitcoin/Gold/Nasdaq/Hang Seng Index/SSE 300, gold was the strongest, while Bitcoin performed the worst.
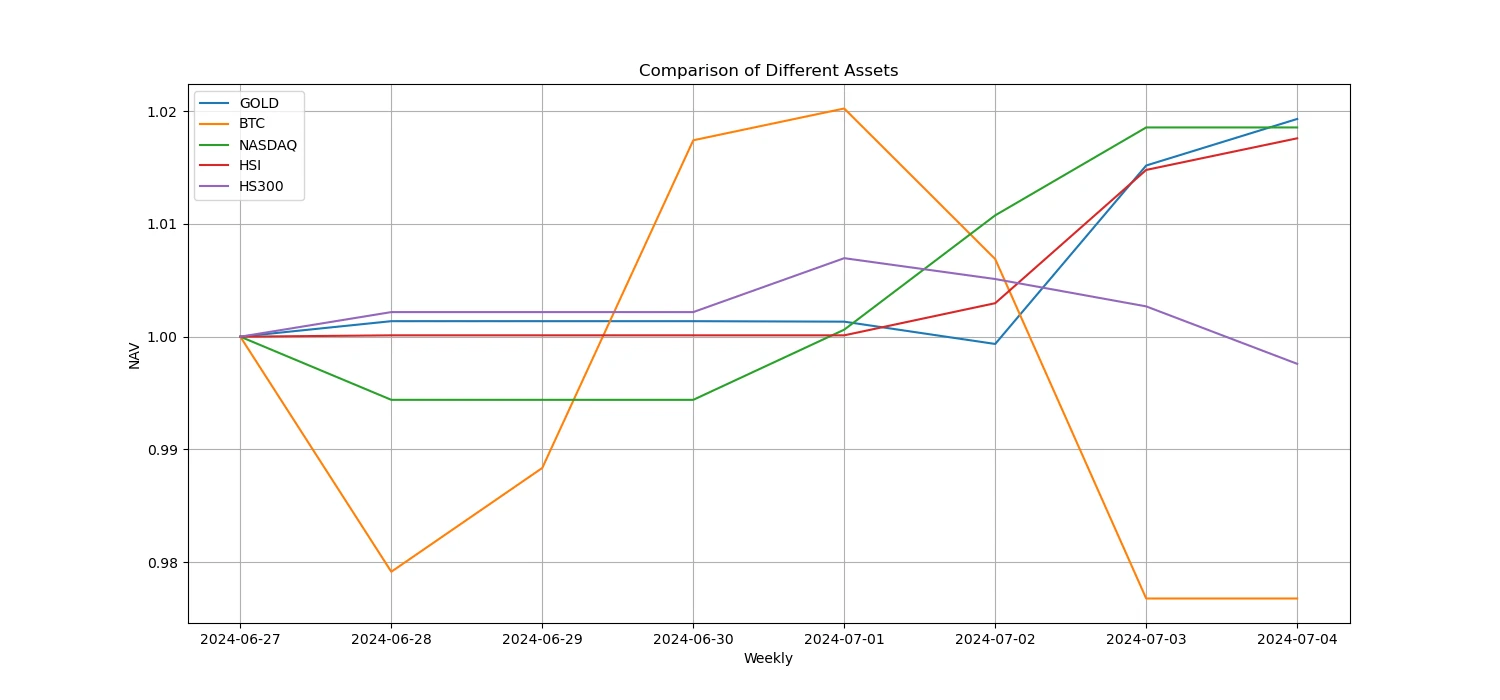
The above picture shows the trend of different assets in the past week.
Lending Rate_Lending Sentiment
The average annualized return on USD lending over the past week was 11.4%, and short-term interest rates remained at 12.8%.
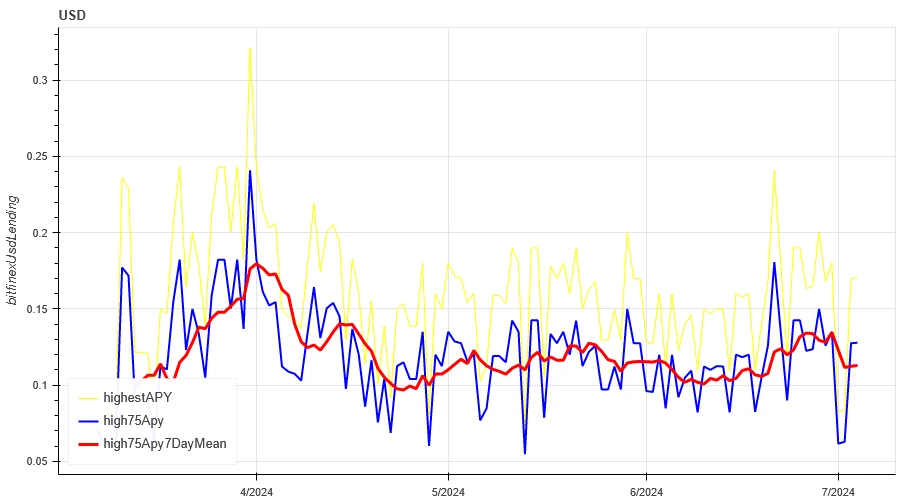
The yellow line is the highest price of USD interest rate, the blue line is 75% of the highest price, and the red line is the 7-day average of 75% of the highest price.
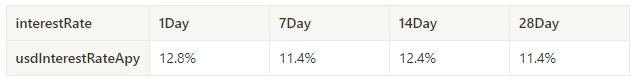
The table shows the average returns of USD interest rates for different holding days in the past
Funding Rate_Contract Leverage Sentiment
The average annualized return on BTC fees in the past week was 10.9%, and contract leverage sentiment remained at a low level.
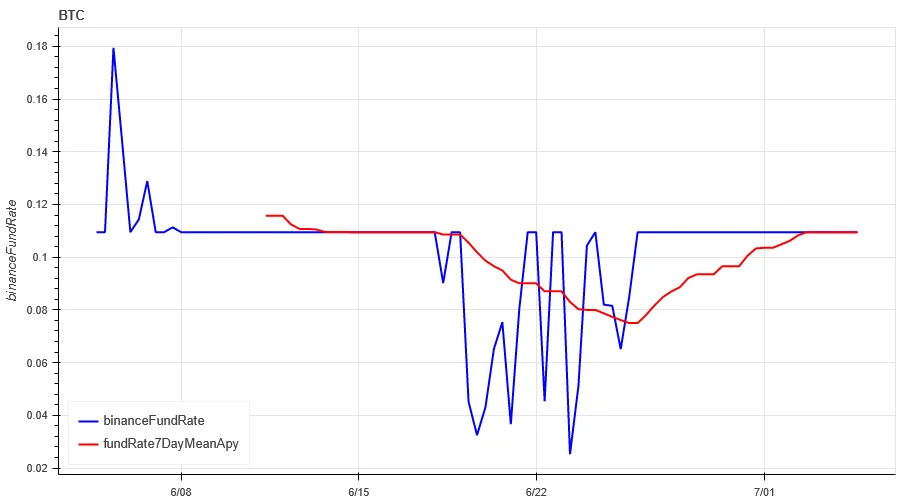
The blue line is the funding rate of BTC on Binance, and the red line is its 7-day average
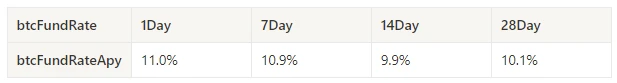
The table shows the average return of BTC fees for different holding days in the past.
Market Correlation_Consensus Sentiment
The correlation among the 129 coins selected in the past week dropped to around 0.73, and the consistency between different varieties increased significantly.
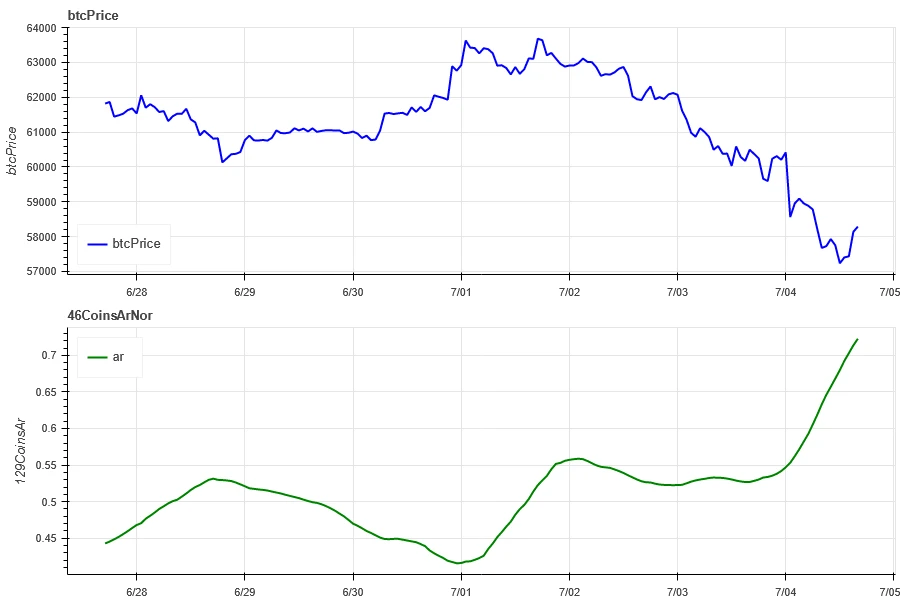
In the above picture, the blue line is the price of Bitcoin, and the green line is [1000 floki, 1000 lunc, 1000 pepe, 1000 shib, 100 0x ec, 1inch, aave, ada, agix, algo, ankr, ant, ape, apt, arb, ar, astr, atom, audio, avax, axs, bal, band, bat, bch, bigtime, blur, bnb, btc, celo, cfx, chz, ckb, comp, crv, cvx, cyber, dash, doge, dot, dydx, egld, enj, ens, eos,etc, eth, fet, fil, flow, ftm, fxs, gala, gmt, gmx, grt, hbar, hot, icp, icx, imx, inj, iost, iotx, jasmy, kava, klay, ksm, ldo, link, loom, lpt, lqty, lrc, ltc, luna 2, magic, mana, matic, meme, mina, mkr, near, neo, ocean, one, ont, op, pendle, qnt, qtum, rndr, rose, rune, rvn, sand, sei, sfp, skl, snx, sol, ssv, stg, storj, stx, sui, sushi, sxp, theta, tia, trx, t, uma, uni, vet, waves, wld, woo, xem, xlm, xmr, xrp, xtz, yfi, zec, zen, zil, zrx] overall correlation
Market Breadth_Overall Sentiment
Among the 129 coins selected in the past week, 3.9% of the coins were priced above the 30-day moving average, 16.5% of the coins were priced above the 30-day moving average relative to BTC, 2.3% of the coins were more than 20% away from the lowest price in the past 30 days, and 2.3% of the coins were less than 10% away from the highest price in the past 30 days. The market breadth indicator in the past week showed that most coins in the overall market continued to fall.
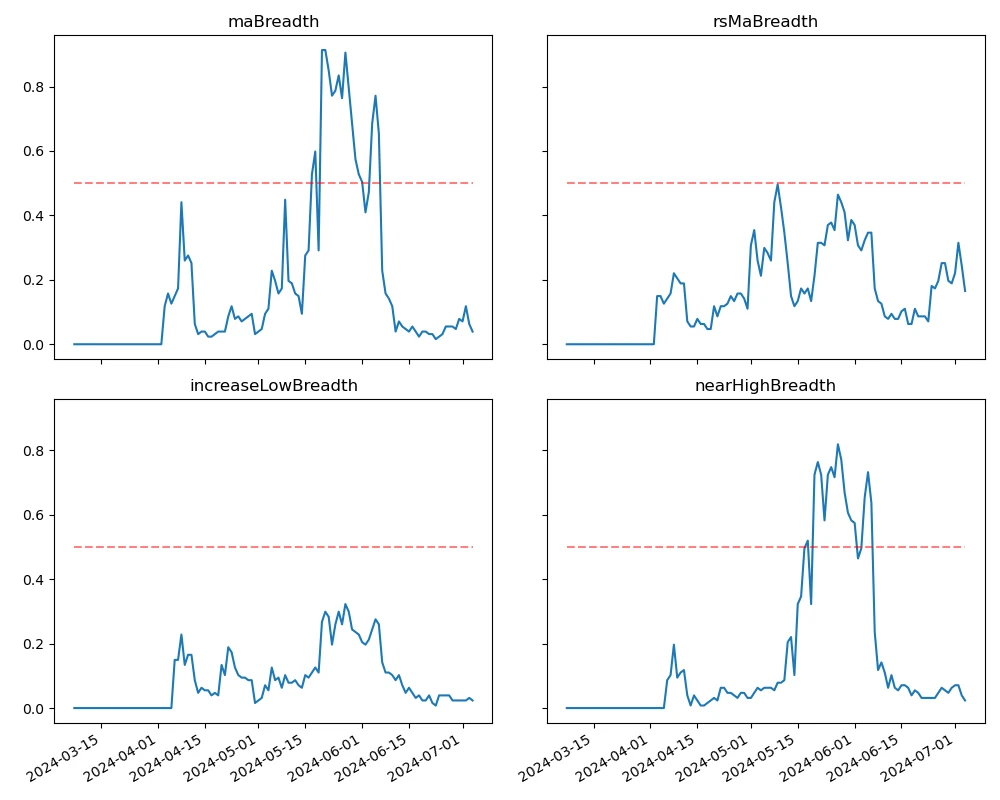
The above picture shows [bnb, btc, sol, eth, 1000 floki, 1000 lunc, 1000 pepe, 1000 sats, 1000 shib, 100 0x ec, 1inch, aave, ada, agix, ai, algo, alt, ankr, ape, apt, arb, ar, astr, atom, avax, axs, bal, band, bat, bch, bigtime, blur, cake, celo, cfx, chz, ckb, comp, crv, cvx, cyber, dash, doge, dot, dydx, egld, enj, ens, eos,etc, fet, fil, flow, ftm, fxs, gala, gmt, gmx, grt, hbar, hot, icp, icx, idu, imx, inj, iost, iotx, jasmy, jto, jup, kava, klay, ksm, ldo, link, loom, lpt, lqty, lrc, ltc, luna 2, magic, mana, manta, mask, matic, meme, mina, mkr, near, neo, nfp, ocean, one, ont, op, ordi, pendle, pyth, qnt, qtum, rndr, robin, rose, rune, rvn, sand, sei, sfp, skl, snx, ssv, stg, storj, stx, sui, sushi, sxp, theta, tia, trx, t, uma, uni, vet, waves, wif, wld, woo,xai, xem, xlm, xmr, xrp, xtz, yfi, zec, zen, zil, zrx ] 30-day proportion of each width indicator

Summarize
Over the past week, the prices of Bitcoin (BTC) and Ethereum (ETH) continued to fall, while the volatility and trading volume of these two cryptocurrencies reached the highest level during the decline on July 4. The open interest of Bitcoin and Ethereum has increased. In addition, the implied volatility of Bitcoin and Ethereum has also increased simultaneously. Bitcoins funding rate remains at a low level, which may reflect the continued low leverage sentiment of market participants towards Bitcoin. Market breadth indicators show that most cryptocurrencies continue to fall, indicating that the overall market has maintained a weak trend over the past week.
Twitter: @ https://x.com/CTA_ChannelCmt
Website: channelcmt.com


