


Mild inflation data, price range fluctuations
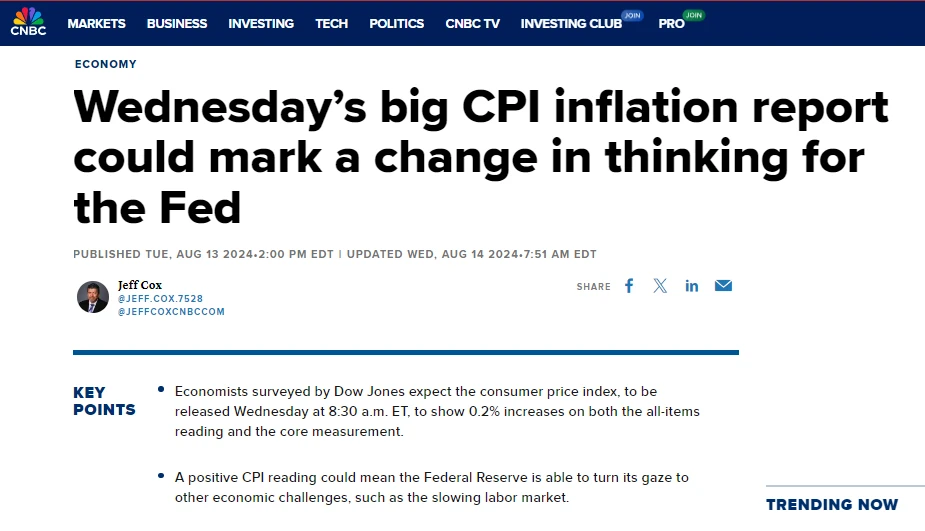
Image source: https://www.cnbc.com/2024/08/13/wednesdays-cpi-report-could-mark-a-change-in-thinking-for-the-fed.html?qsearchterm=CPI
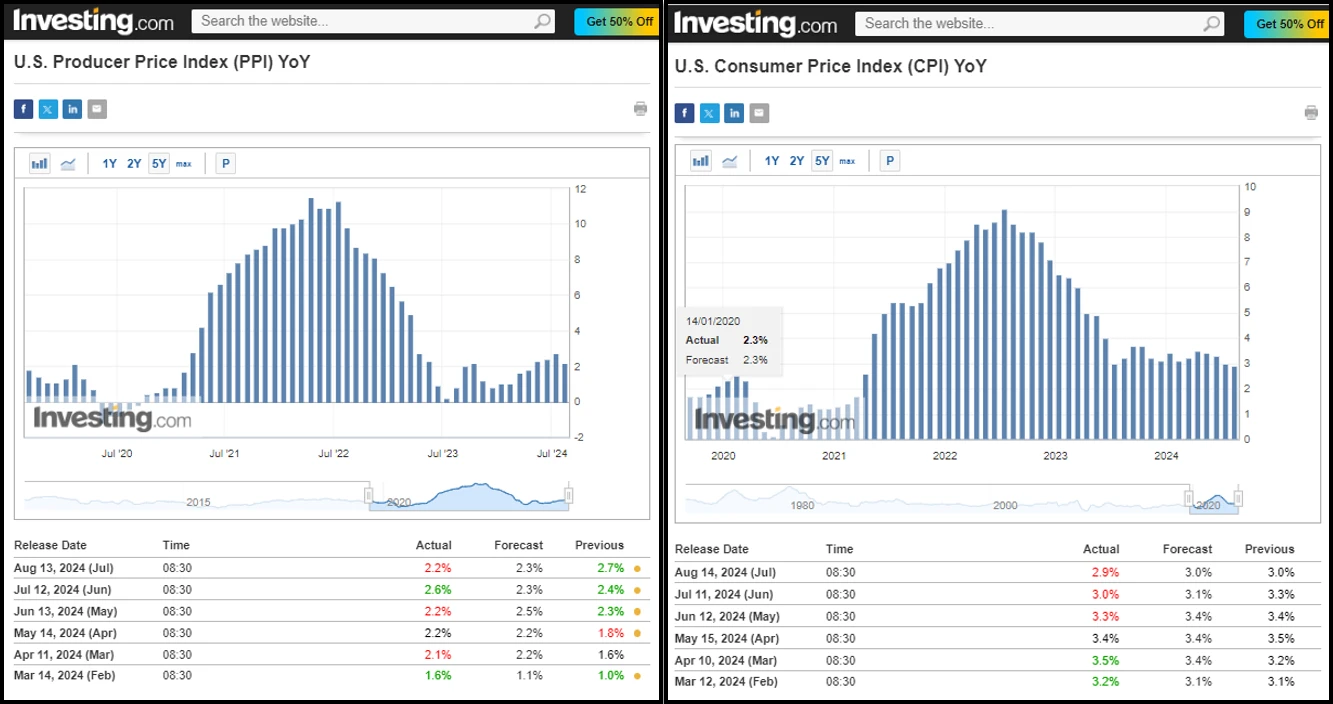
Image source: https://hk.investing.com/
This week, two important inflation data, PPI and CPI, were released. CNBC said the data showed that the United States has passed the environment of ultra-high inflation. Moderate inflation data may mean that the Federal Reserve can turn its attention to other economic challenges, such as employment rate.
Data: PPI data, an indicator of producer inflation, showed that prices rose by only 0.2% in July and were up about 2.2% year-on-year. This figure is now very close to the Feds 2% target, indicating that market expectations for the central bank to start cutting interest rates are basically on target.
CPI data, an indicator of consumer inflation, showed a year-on-year growth rate of 2.9% over the past 12 months, a figure that, while much lower than the high point in mid-2022, is still far from the Feds 2% target.
In terms of market conditions: After the release of the PPI data at 20:30 on the evening of the 13th, Hong Kong time, the market began to rise, and Bitcoin rose from 59,000 to around 61,500. It was not until the release of the CPI data at 20:30 on the 14th that the market began to fall, and Bitcoin fell from 61,500 to around 58,000.
Future events: The latest employment rate data will be released on September 6, the latest CPI and PPI data will be released on September 11 and 12, and the Federal Reserve will hold its interest rate decision at 02:00 Hong Kong time on September 19. September will be a critical node. If the Federal Reserve decides to cut interest rates, the market may bring a new round of surprises.
There are about 33 days until the next Federal Reserve interest rate meeting (September 19, 2024)
https://hk.investing.com/economic-calendar/interest-rate-decision-168
Market technical and sentiment environment analysis
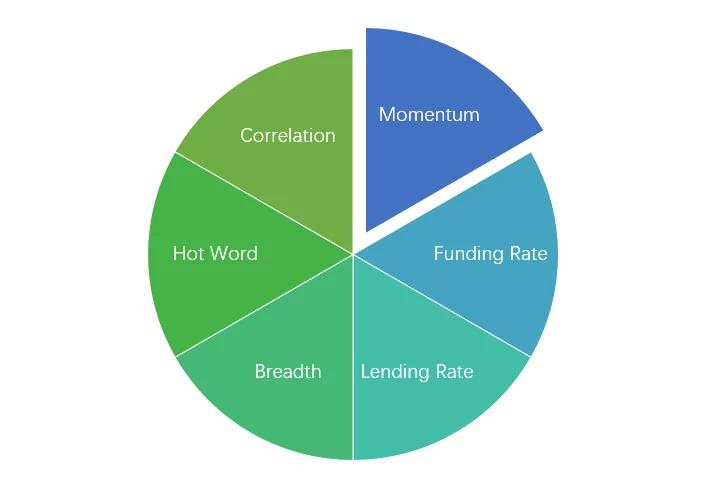
Sentiment Analysis Components

Technical indicators
Price Trends
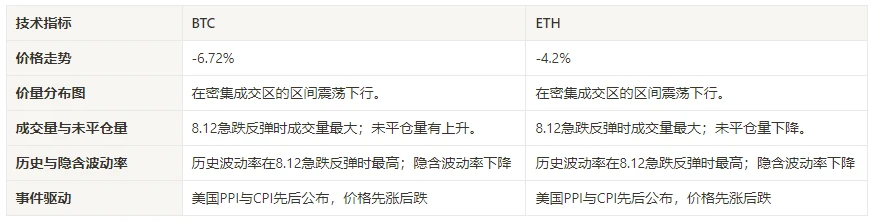
BTC price fell -6.72% and ETH price fell -4.2% in the past week.
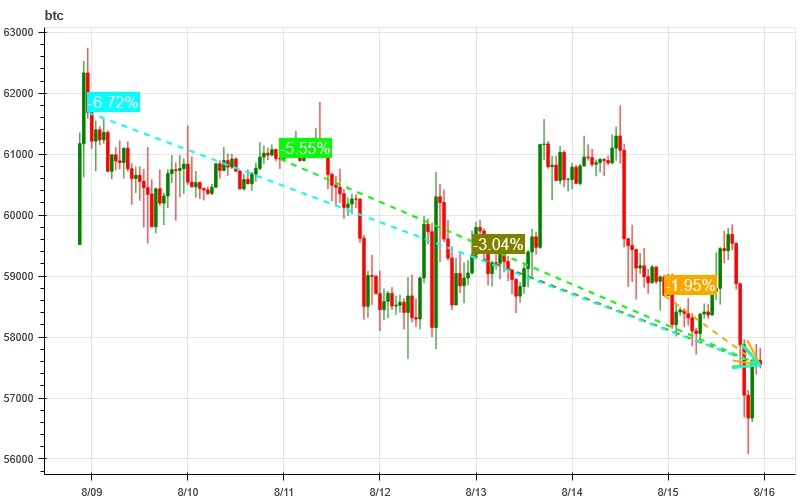
The above picture is the price chart of BTC in the past week.
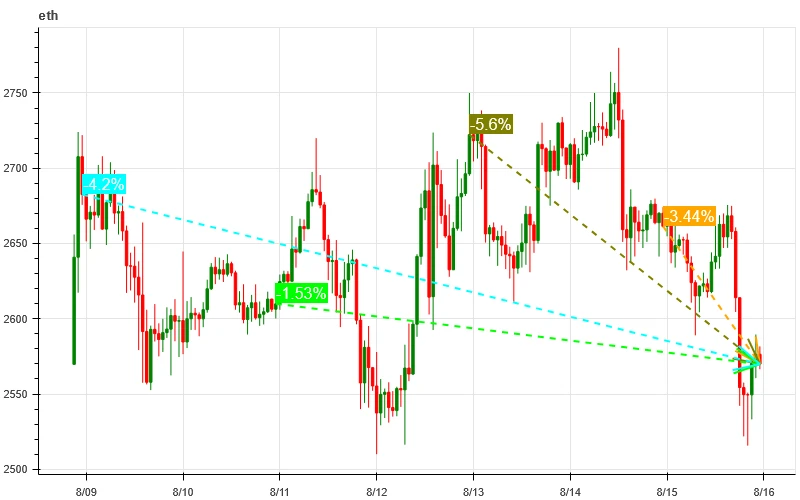
The above picture is the price chart of ETH in the past week.
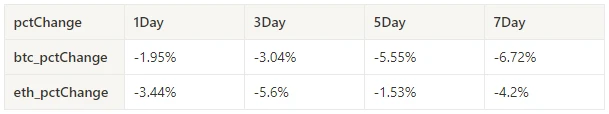
The table shows the price change rate over the past week.
Price Volume Distribution Chart (Support and Resistance)
In the past week, both BTC and ETH have been fluctuating downward in a range of dense trading areas.
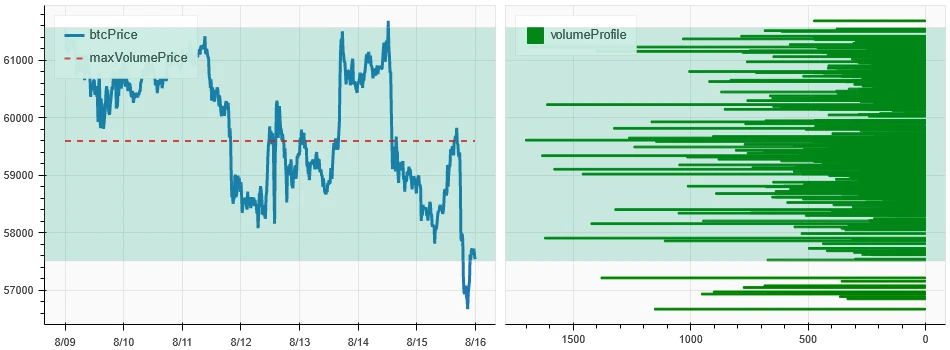
The above picture shows the distribution of BTCs dense trading areas in the past week.
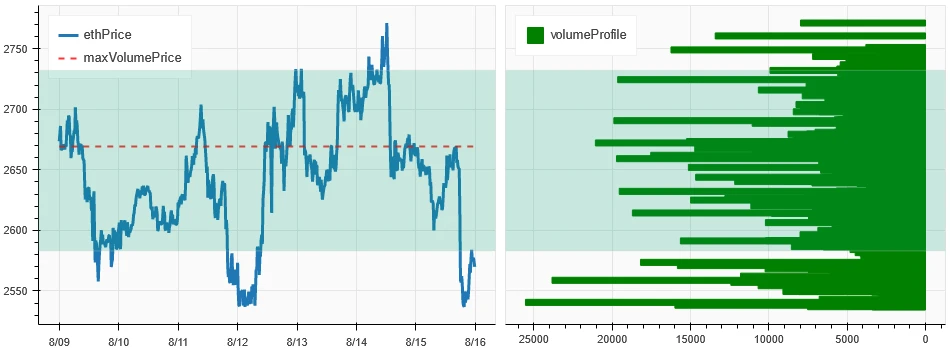
The above picture shows the distribution of ETHs dense trading areas in the past week.
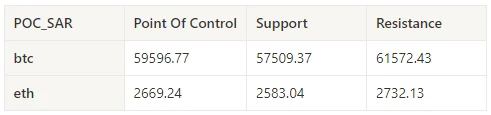
The table shows the weekly intensive trading range of BTC and ETH in the past week.
Volume and Open Interest
In the past week, both BTC and ETH had the largest trading volume when they rebounded sharply on August 12; the open interest of BTC increased while that of ETH decreased.
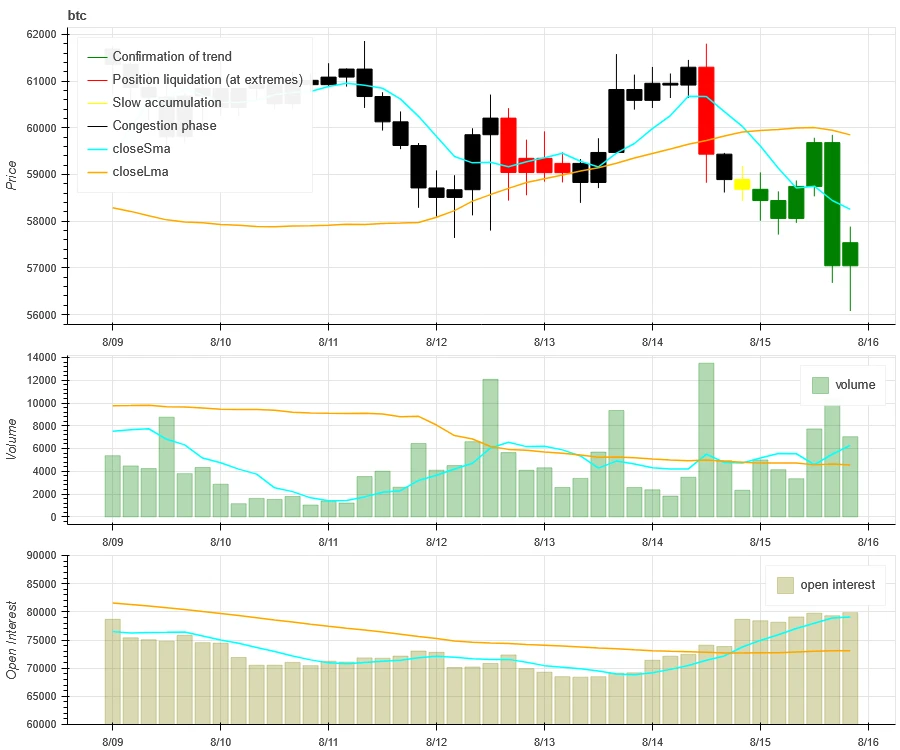
The top of the above picture shows the price trend of BTC, the middle shows the trading volume, the bottom shows the open interest, the light blue is the 1-day average, and the orange is the 7-day average. The color of the K-line represents the current state, green means the price rise is supported by the trading volume, red means closing positions, yellow means slowly accumulating positions, and black means crowded state.
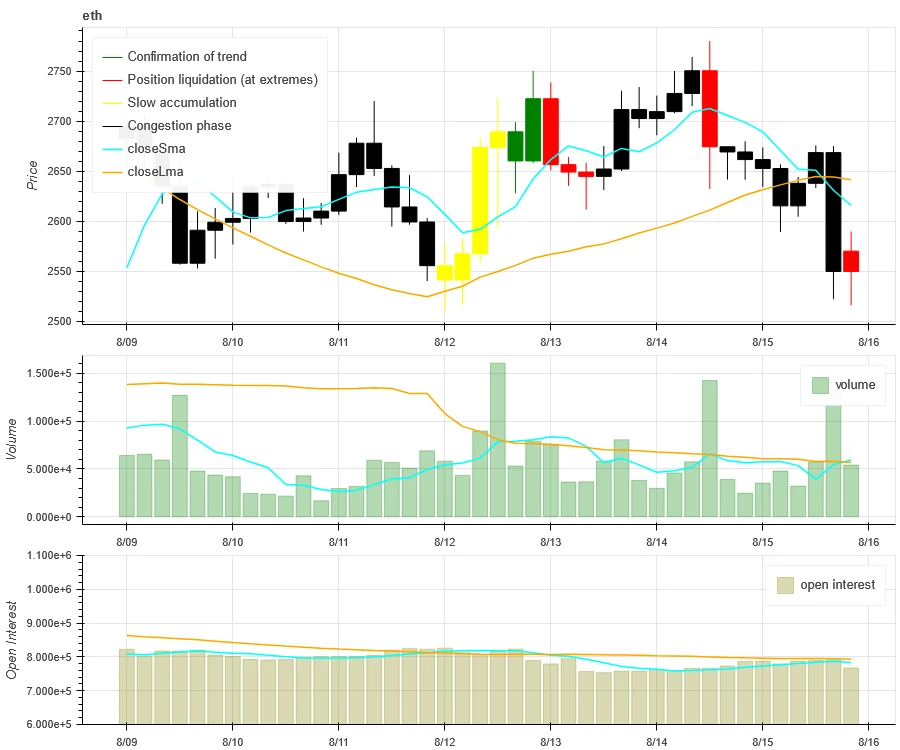
The top of the above picture shows the price trend of ETH, the middle is the trading volume, the bottom is the open interest, the light blue is the 1-day average, and the orange is the 7-day average. The color of the K-line represents the current state, green means the price rise is supported by the trading volume, red is closing positions, yellow is slowly accumulating positions, and black is crowded.
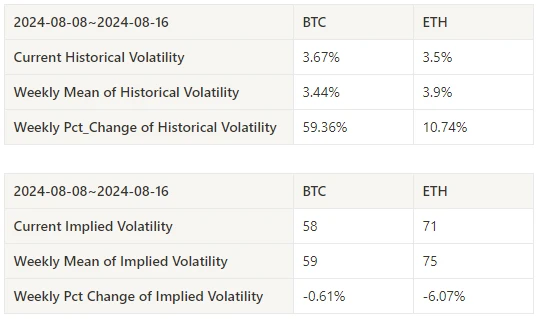
Historical Volatility vs. Implied Volatility
In the past week, the historical volatility of BTC and ETH was the highest when they rebounded sharply on August 12; the implied volatility of BTC and ETH both decreased.
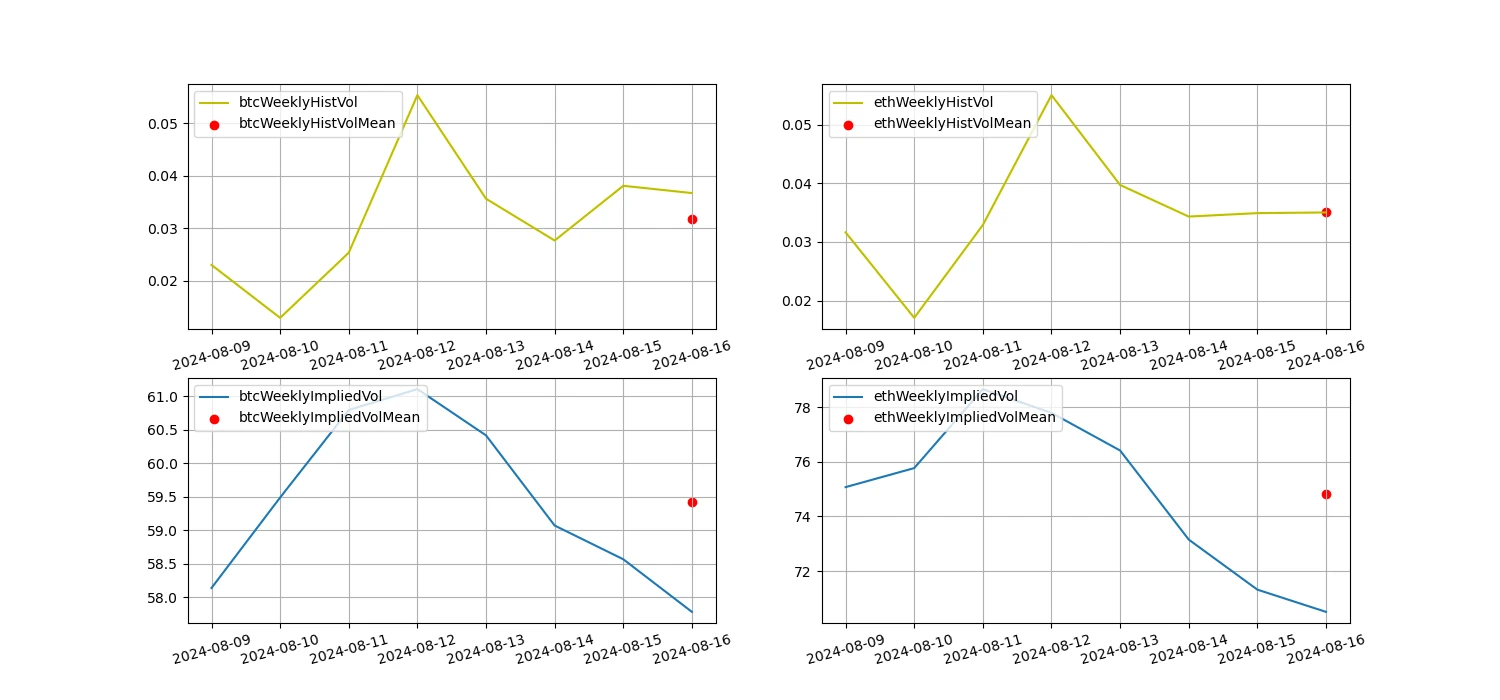
The yellow line is the historical volatility, the blue line is the implied volatility, and the red dot is its 7-day average.
Event-driven
The PPI and CPI inflation data were released this past week. After the PPI data was released at 20:30 on the evening of the 13th Hong Kong time, the market began to rise, and Bitcoin rose from 59,000 to around 61,500. It was not until 20:30 on the 14th when the CPI data was released that the market began to fall, and Bitcoin fell from 61,500 to around 58,000.
Sentiment Indicators
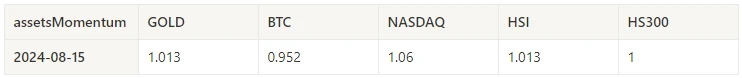
Momentum Sentiment
In the past week, among Bitcoin/Gold/Nasdaq/Hang Seng Index/SSE 300, Nasdaq was the strongest, while Bitcoin performed the worst.
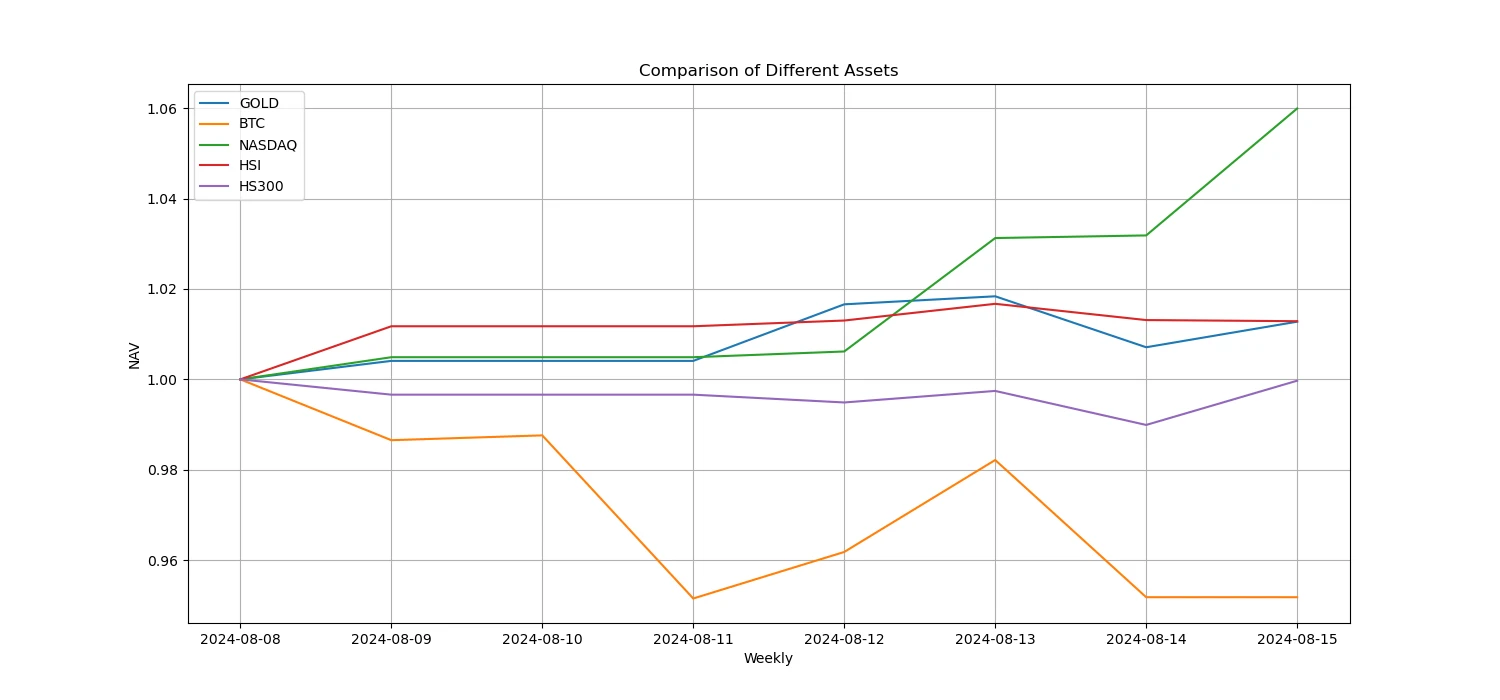
The above picture shows the trend of different assets in the past week.
Lending Rate_Lending Sentiment
The average annualized return on USD lending over the past week was 8.1%, and short-term interest rates remained at 6.7%.
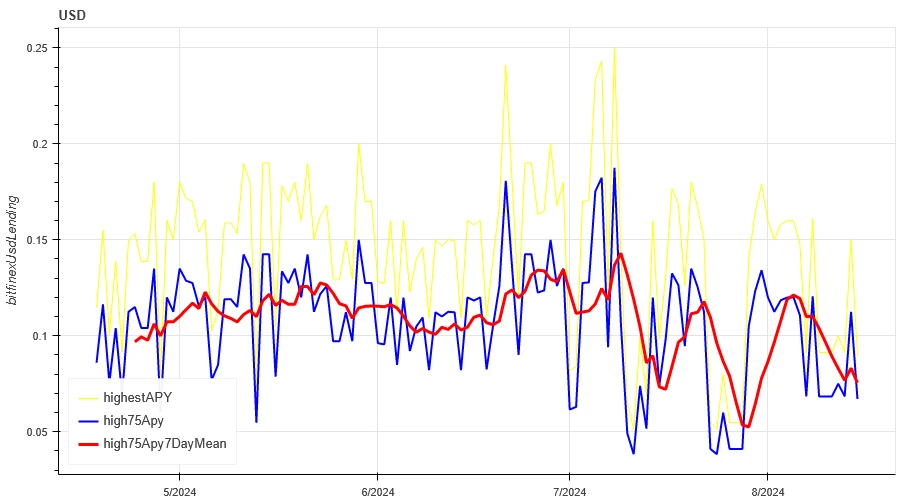
The yellow line is the highest price of USD interest rate, the blue line is 75% of the highest price, and the red line is the 7-day average of 75% of the highest price.
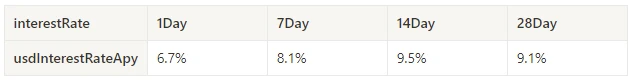
The table shows the average returns of USD interest rates at different holding days in the past
Funding Rate_Contract Leverage Sentiment
The average annualized return on BTC fees in the past week was 0.2%, and contract leverage sentiment continued to decline.
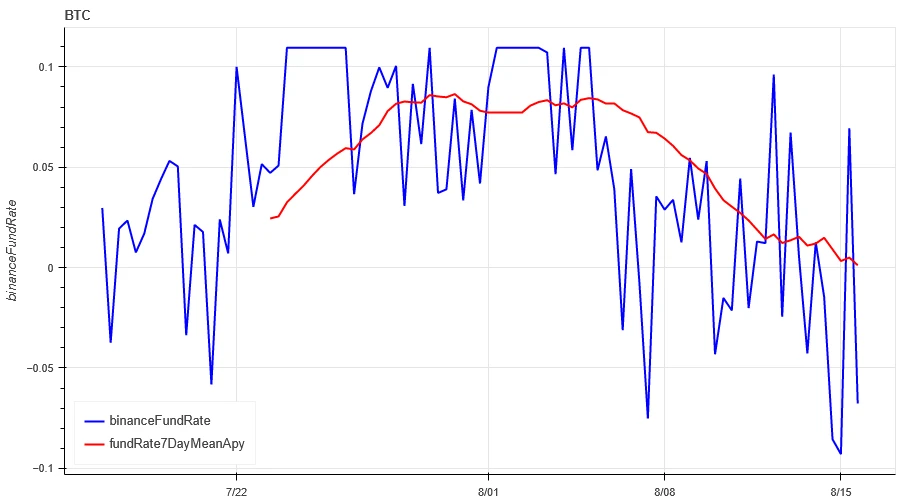
The blue line is the funding rate of BTC on Binance, and the red line is its 7-day average
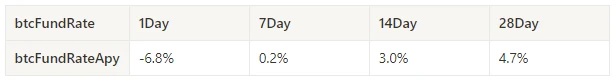
The table shows the average return of BTC fees for different holding days in the past.
Market Correlation_Consensus Sentiment
The correlation among the 129 coins selected in the past week was around 0.45, and the consistency between different varieties has dropped from a high level.
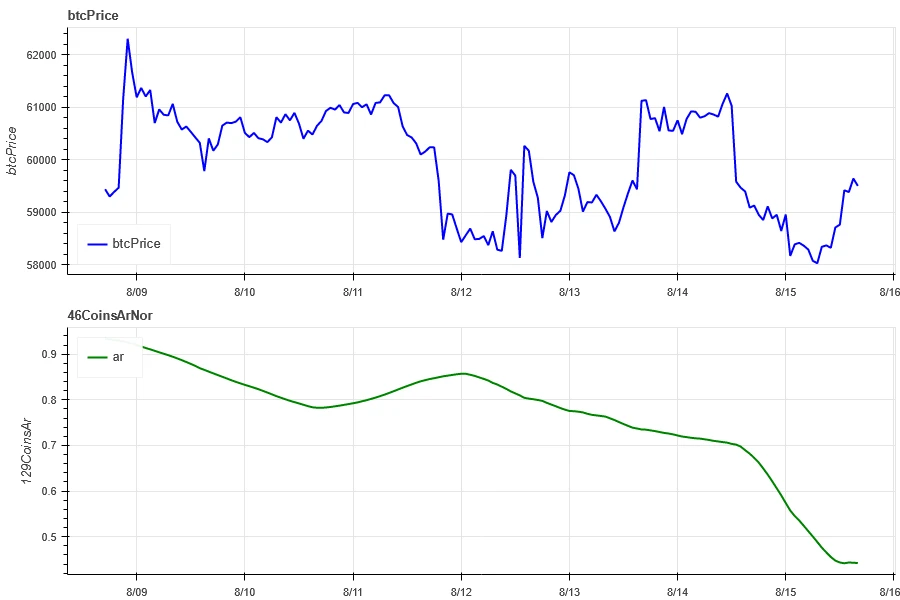
In the above picture, the blue line is the price of Bitcoin, and the green line is [1000 floki, 1000 lunc, 1000 pepe, 1000 shib, 100 0x ec, 1inch, aave, ada, agix, algo, ankr, ant, ape, apt, arb, ar, astr, atom, audio, avax, axs, bal, band, bat, bch, bigtime, blur, bnb, btc, celo, cfx, chz, ckb, comp, crv, cvx, cyber, dash, doge, dot, dydx, egld, enj, ens, eos,etc, eth, fet, fil, flow, ftm, fxs, gala, gmt, gmx, grt, hbar, hot, icp, icx , imx, inj, iost, iotx, jasmy, kava, klay, ksm, ldo, link, loom, lpt, lqty, lrc, ltc, luna 2, magic, mana, matic, meme, mina, mkr, near, neo, ocean, one, ont, op, pendle, qnt, qtum, rndr, rose, rune, rvn, sand, sei, sfp, skl, snx , sol, ssv, stg, storj, stx, sui, sushi, sxp, theta, tia, trx, t, uma, uni, vet, waves, wld, woo, xem, xlm, xmr, xrp, xtz, yfi, zec, zen, zil, zrx] overall correlation
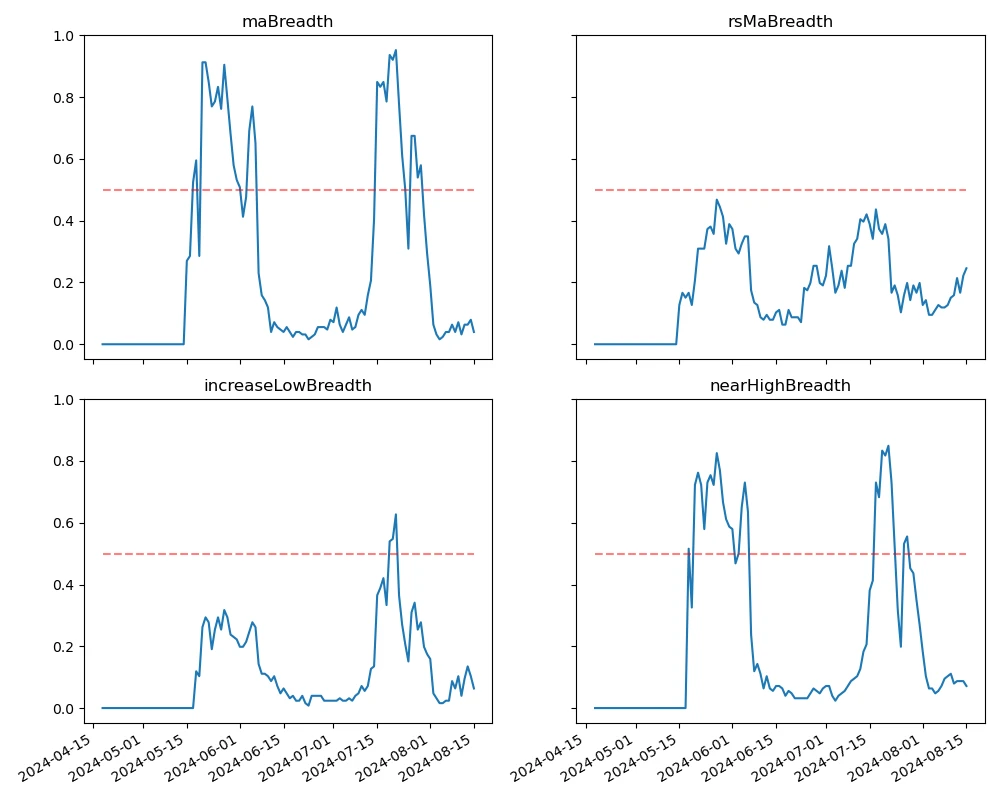
Market Breadth_Overall Sentiment
Among the 129 coins selected in the past week, 4% of them were priced above the 30-day moving average, 24% of them were priced above the 30-day moving average relative to BTC, 6% of them were more than 20% away from the lowest price in the past 30 days, and 7% of them were less than 10% away from the highest price in the past 30 days. The market breadth indicator in the past week showed that most coins in the overall market maintained a downward trend.
The picture above is [bnb, btc, sol, eth, 1000 floki, 1000 lunc, 1000 pepe, 1000 sats, 1000 shib, 100 0x ec, 1inch, aave, ada, agix, ai, algo, alt, ankr, ape, apt, arb, ar, astr, atom, avax, axs, bal, band, bat, bch, bigtime, blur, cake, celo, cfx, chz, ckb, comp, crv, cvx, cyber, dash, doge, dot, dydx, egld, enj, ens, eos,etc, fet, fil, flow, ftm, fxs, gala, gmt, gmx, grt, hbar, hot , icp, icx, idu, imx, inj, iost, iotx, jasmy, jto, jup, kava, klay, ksm, ldo, link, loom, lpt, lqty, lrc, ltc, luna 2, magic, mana, manta, mask, matic, meme, mina, mkr, near, neo, nfp, ocean, one, ont, op, ordi, pendle, pyth, qnt, qtum, rndr, robin, rose, rune, rvn, sand, sei, sfp, skl, snx, ssv, stg, storj, stx, sui, sushi, sxp, theta, tia, trx, t, uma, uni, vet, waves, wif, wld, woo,xai, xem, xlm, xmr, xrp, xtz, yfi, zec, zen, zil, zrx ] 30-day proportion of each width indicator

Summarize
In the past week, the prices of Bitcoin (BTC) and Ethereum (ETH) showed a volatile downward trend, especially when the historical volatility and trading volume reached a peak during the sharp drop and rebound on August 12. The open interest of BTC increased, while that of ETH decreased. The implied volatility decreased. Bitcoin performed the worst in comparison with gold, Nasdaq, Hang Seng Index and CSI 300, while Nasdaq performed the strongest. Bitcoins funding rate continued to decline, reflecting the continued decline in market participants interest in its leveraged trading. The correlation between the selected 129 currencies remained at around 0.45, showing that the consistency between different varieties has declined from a high level. The market breadth indicator shows that most cryptocurrencies in the overall market are still in a downward trend. The market began to rise after the PPI data was released on the 13th, and then the market began to fall after the CPI data was released on the 14th.
Twitter: @ https://x.com/CTA_ChannelCmt
Website: channelcmt.com


