


Original article by: Stacy Muur
Original translation: TechFlow
The Red Market is the ultimate test of the protocol and reveals the true user distribution.
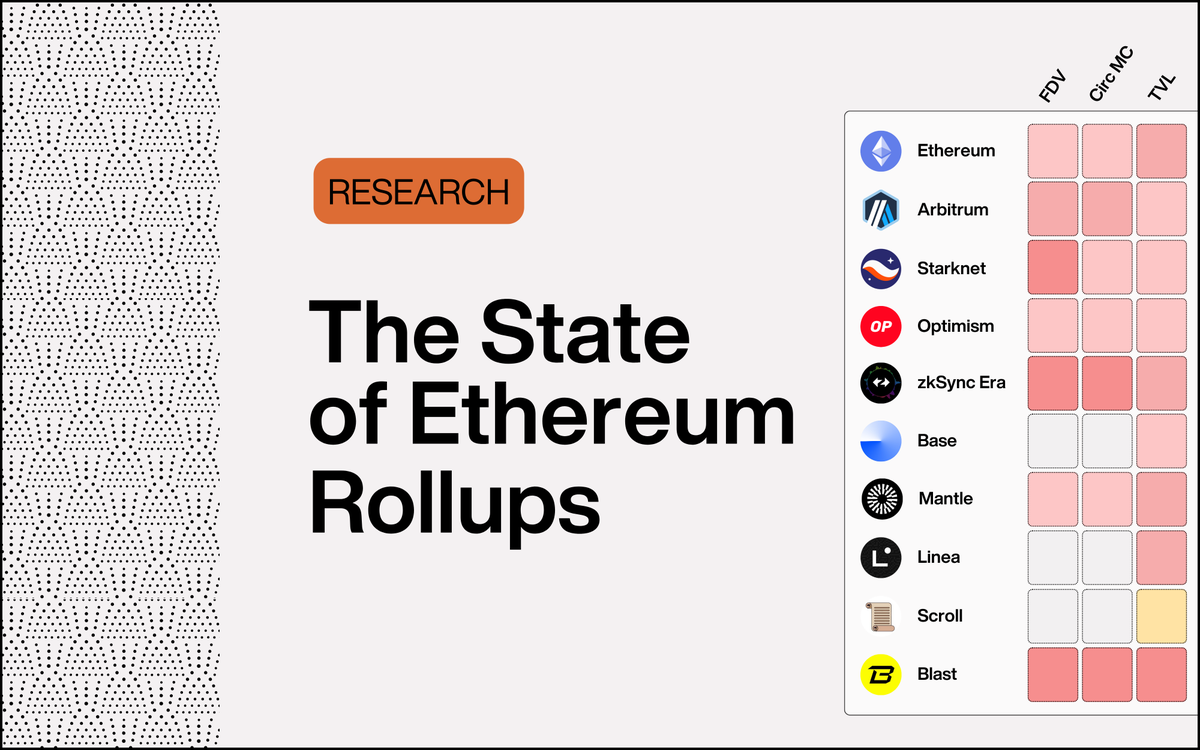
This is my deep dive into the state of Ethereum L2, rich with visuals and on-chain data analysis.
Ethereum L2 has risen rapidly since 2023, and @l2 beat currently tracks data for 74 L2s and 30 L3s.
However, only a few general-purpose Rollups have gained widespread attention, attracting a large amount of TVL and users. This study focuses on the nine largest Rollups.
Market capitalization: circulating market capitalization and fully diluted market capitalization
Currently, the fully diluted valuation (FDV) of most L2s reaches billions of US dollars, but their circulating market value is less than US$1 billion, which indicates that most tokens have not yet entered the market circulation.
The only exception is @0x Mantle , which has 52% of its supply unlocked, making it the only L2 with a circulating market cap of over $1 billion.
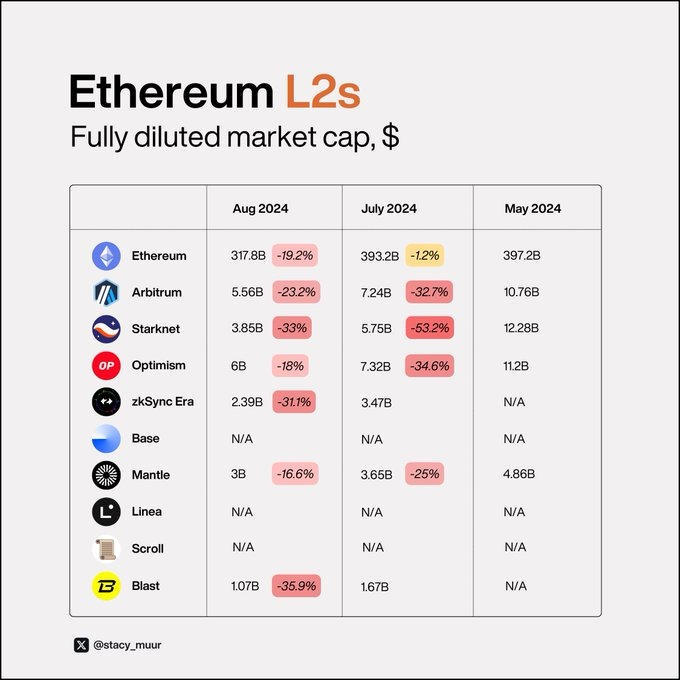
High FDV and low circulation are one of the main reasons why many recent airdrops have failed to meet user expectations.
The assessment of current valuations is challenging, and there is uncertainty about possible future downside moves.
Total locked value (TVL)
In terms of TVL, all chains had a rough summer, except for chains with ongoing incentive programs like @Scroll_ZKP , @LineaBuild , and @0x Mantle .
However, compared to Scroll’s newly launched program, Linea’s nearly year-long airdrop program has received less attention in the community.
Among the underperforming chains, @zksync and @blast were the most affected as these two chains issued their tokens this year, causing liquidity to shift to more attractive locations.
Fees and Trading Activity
Since Dencun, DA no longer significantly drives the economy of ETH, which has an impact on fees on Ethereum and L2. Therefore, it is particularly important to analyze fee dynamics and transaction activity.
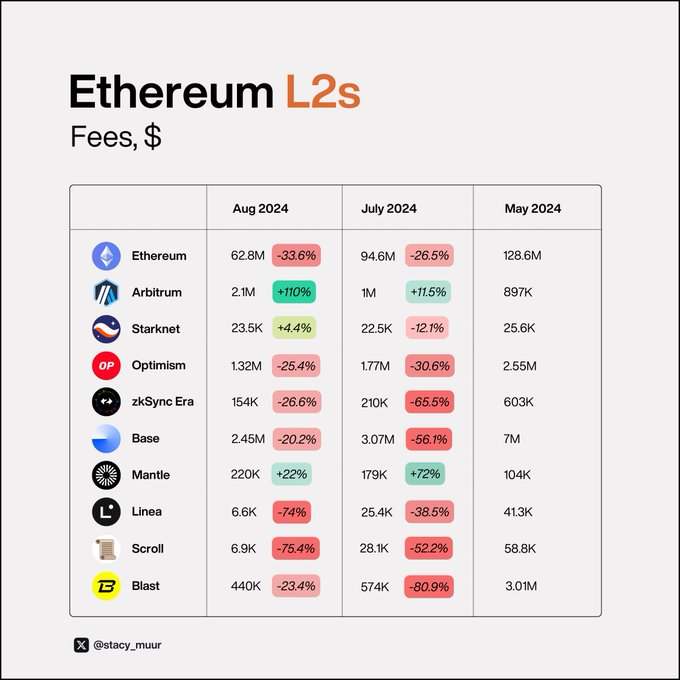
In this regard, @base, which is seen as the leading destination for new memecoin launches on Ethereum L2, has shown strong traction and continued growth in trading volume, driven by speculation.
In contrast, @zksync and @LineaBuild have underperformed despite @LineaBuild’s ongoing incentive program.
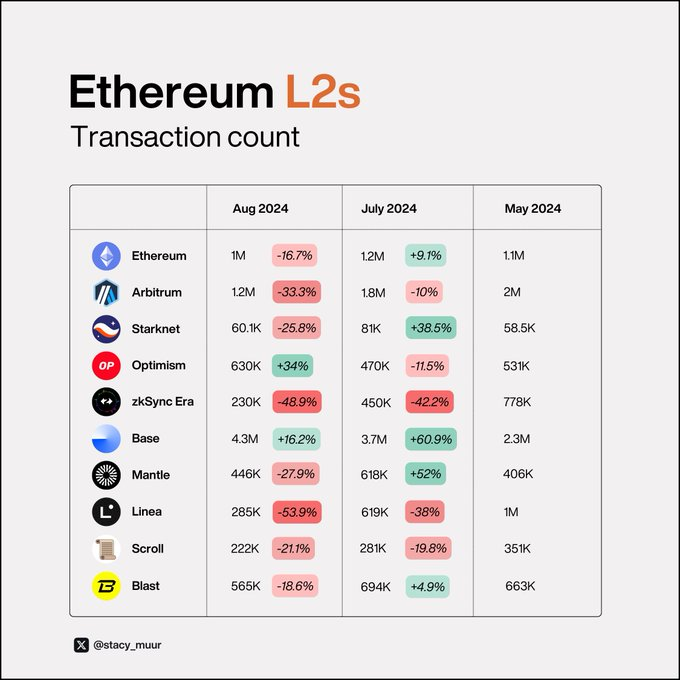
Monthly Active Users (MAU)
The change in MAU, an important indicator for evaluating the chains user retention rate, shows a similar trend.
@0x Mantle and @base performed well, while @StarknetFndn , @zksync , and @blast performed poorly.
By comparing the MAU data to the fully diluted valuation (FDV), it is clear that Starknet is significantly overvalued compared to Arbitrum, Optimism, and even ZKsync.
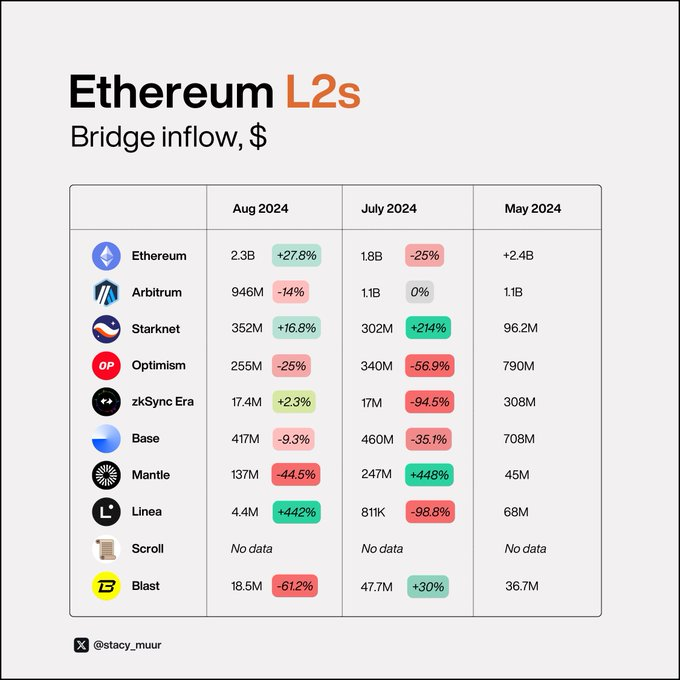
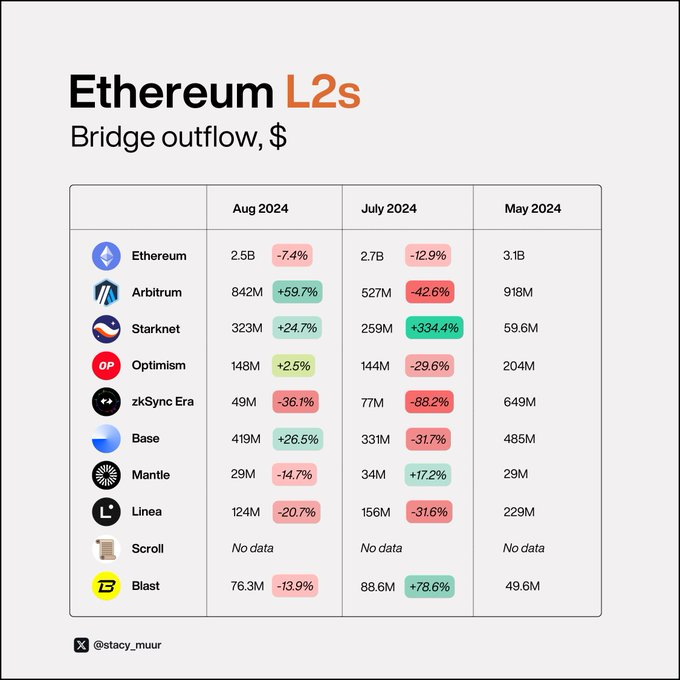
Bridging inflow and outflow
Net bridge traffic is an important indicator for measuring new user and capital inflows.
In L2, the ones with positive net flows include @Arbitrum , @StarknetFndn , @Optimism , @base and @0x Mantle , among which @0x Mantle has the largest gap between inflow and outflow.
In contrast, @LineaBuild , @zksync , and @blast showed negative net flows.
Developer Activities
Finally, developer activity is measured by core development projects and code commits. This data helps assess the current productivity of the team and identify if there is staff reduction.
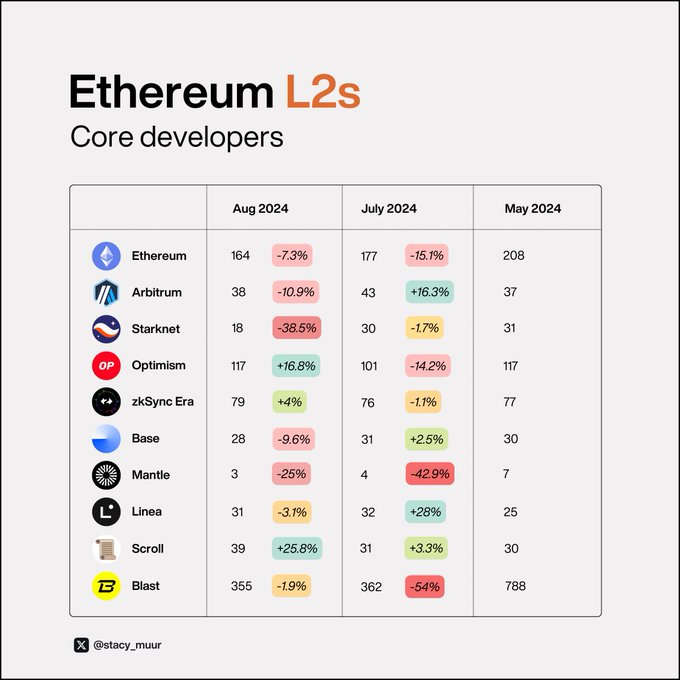
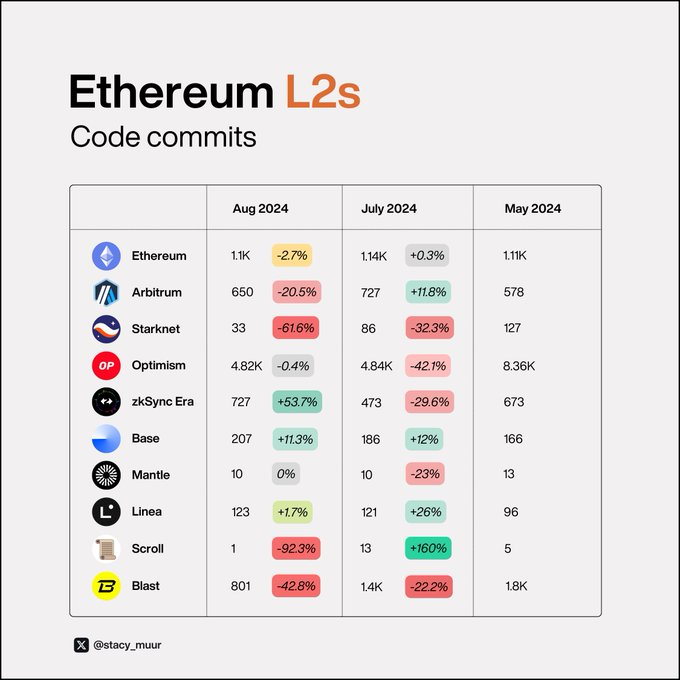
The most surprising is @blast , which currently has over 300 core developers (compared to most L2s which usually have 30-50). This large team also contributes a large number of code commits.
What exactly they were doing is unknown.
If you want to learn more about the impact of the airdrop on Ethereum L2 metrics, check out my article The State of Ethereum Rollups on Substack.
This post summarizes my research findings and expresses my personal views on the power distribution of Ethereum Rollups.
In short: ZK Rollup is still a long way from mass adoption (which is a shame).


