


Original author: Frank, PANews
The sharp fluctuations in the cryptocurrency market are closely linked to the extreme swings in investor sentiment. The Fear and Greed Index has become an intuitive data on the mentality of investors across the board. On April 7, concerns about increased global tariffs triggered a major shock in the global financial market, followed by a surge of panic.
Looking back, since 2018, the crypto market has experienced 239 extreme panic moments with the index below 20. This article does not intend to exaggerate the negative sentiment of the market, but hopes to systematically review these key nodes, learn from history, and try to discover the cyclical laws that may exist behind them. PANews research focuses on the distribution characteristics and duration of these panic moments, and analyzes whether they contain market signals worthy of attention.
2018: A year of panic under the shadow of regulation
Judging from the panic index, this period is characterized by occasional panics in the market over a long period of time. From February 2018, BTC fell 70% from its high of $19,000 in 50 days to around $5,900. This was the first panic.
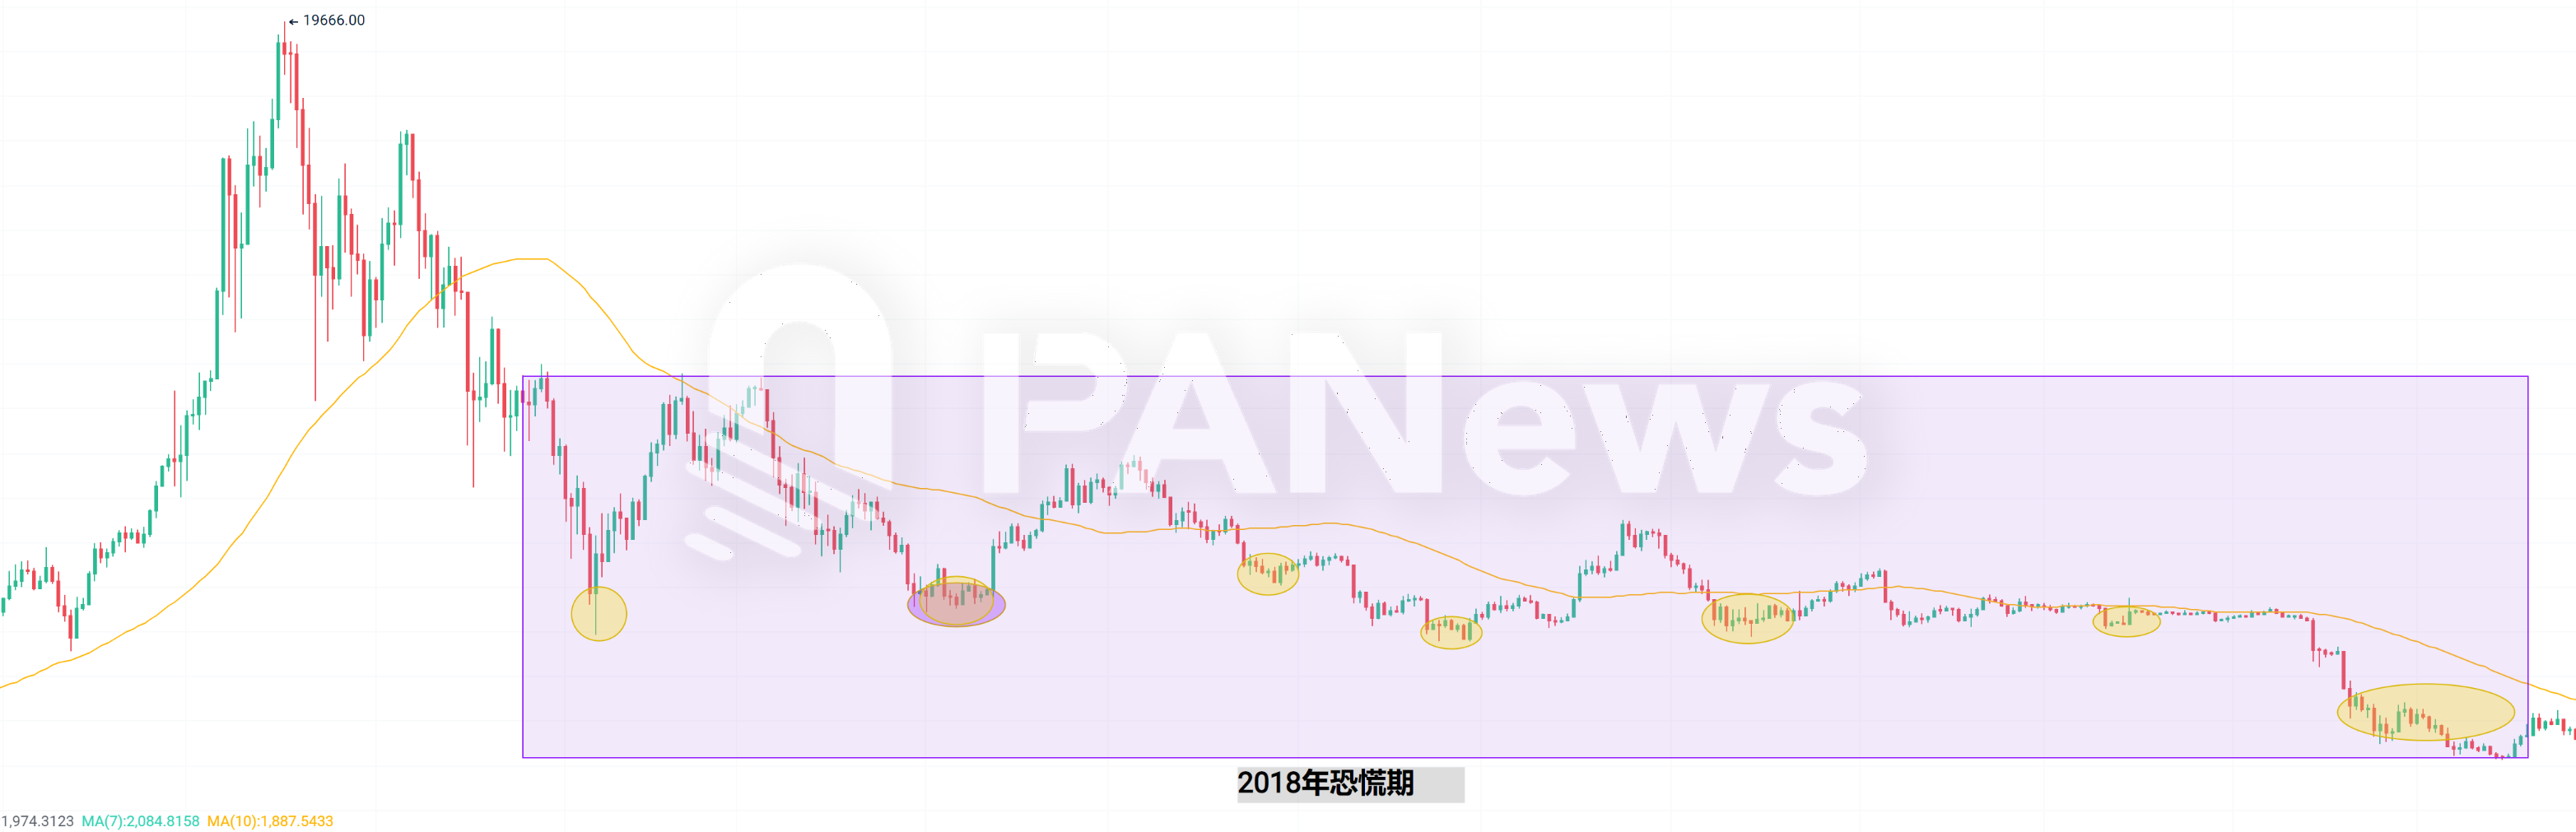
During the process of hitting the bottom several times, the market experienced panic. According to the data, there were 93 panic moments with a panic index below 20 in 2018, making it the year with the most panic moments. Among them, the panic index reached a minimum of 8 on February 5, lasted for 23 days from August 20 to September 11, and lasted for 27 days from November 20 to December 16.
From the perspective of short-term market conditions, these panic phases are almost all short-term bottoms. After the panic, the market has experienced a short-term rebound to varying degrees. However, these rebounds ultimately failed to form a new trend, but instead became additives to the market downturn.
Here are the news factors behind these panic moments:
February 4-5, 2018: The SEC launches a massive ICO investigation in February; multiple banks ban credit card purchases of Bitcoin.
March 28-April 1, 2018: SEC announces it will begin regulating cryptocurrency institutions
May-June 2018: South Korean cryptocurrency exchange Coinrail was hacked, losing more than $40 million; the CFTC issued subpoenas to several large exchanges including Coinbase, Kraken, and Bitstamp.
August-September 2018: The SEC postponed its decision on the application for a Bitcoin exchange-traded fund (ETF), and five Chinese ministries issued a risk warning to prevent virtual currency speculation.
November 20-December 16, 2018: Bitcoin price drops 80% from its peak, losing nearly a third of its value in a week, hitting a low of around $3,100 in December 2018. Growth in Bitcoin miners stopped in August, and hashrate began to decline significantly in November.
Judging from the impact of these major news, the source of panic in 2018 was mainly affected by policies, and regulatory news from regulatory agencies such as the SEC and CFTC caused a panic effect.
After these panic moments, the market began to enter an upward cycle after a consolidation period of about 4 months.
2019: Panic selling after a mini bull run
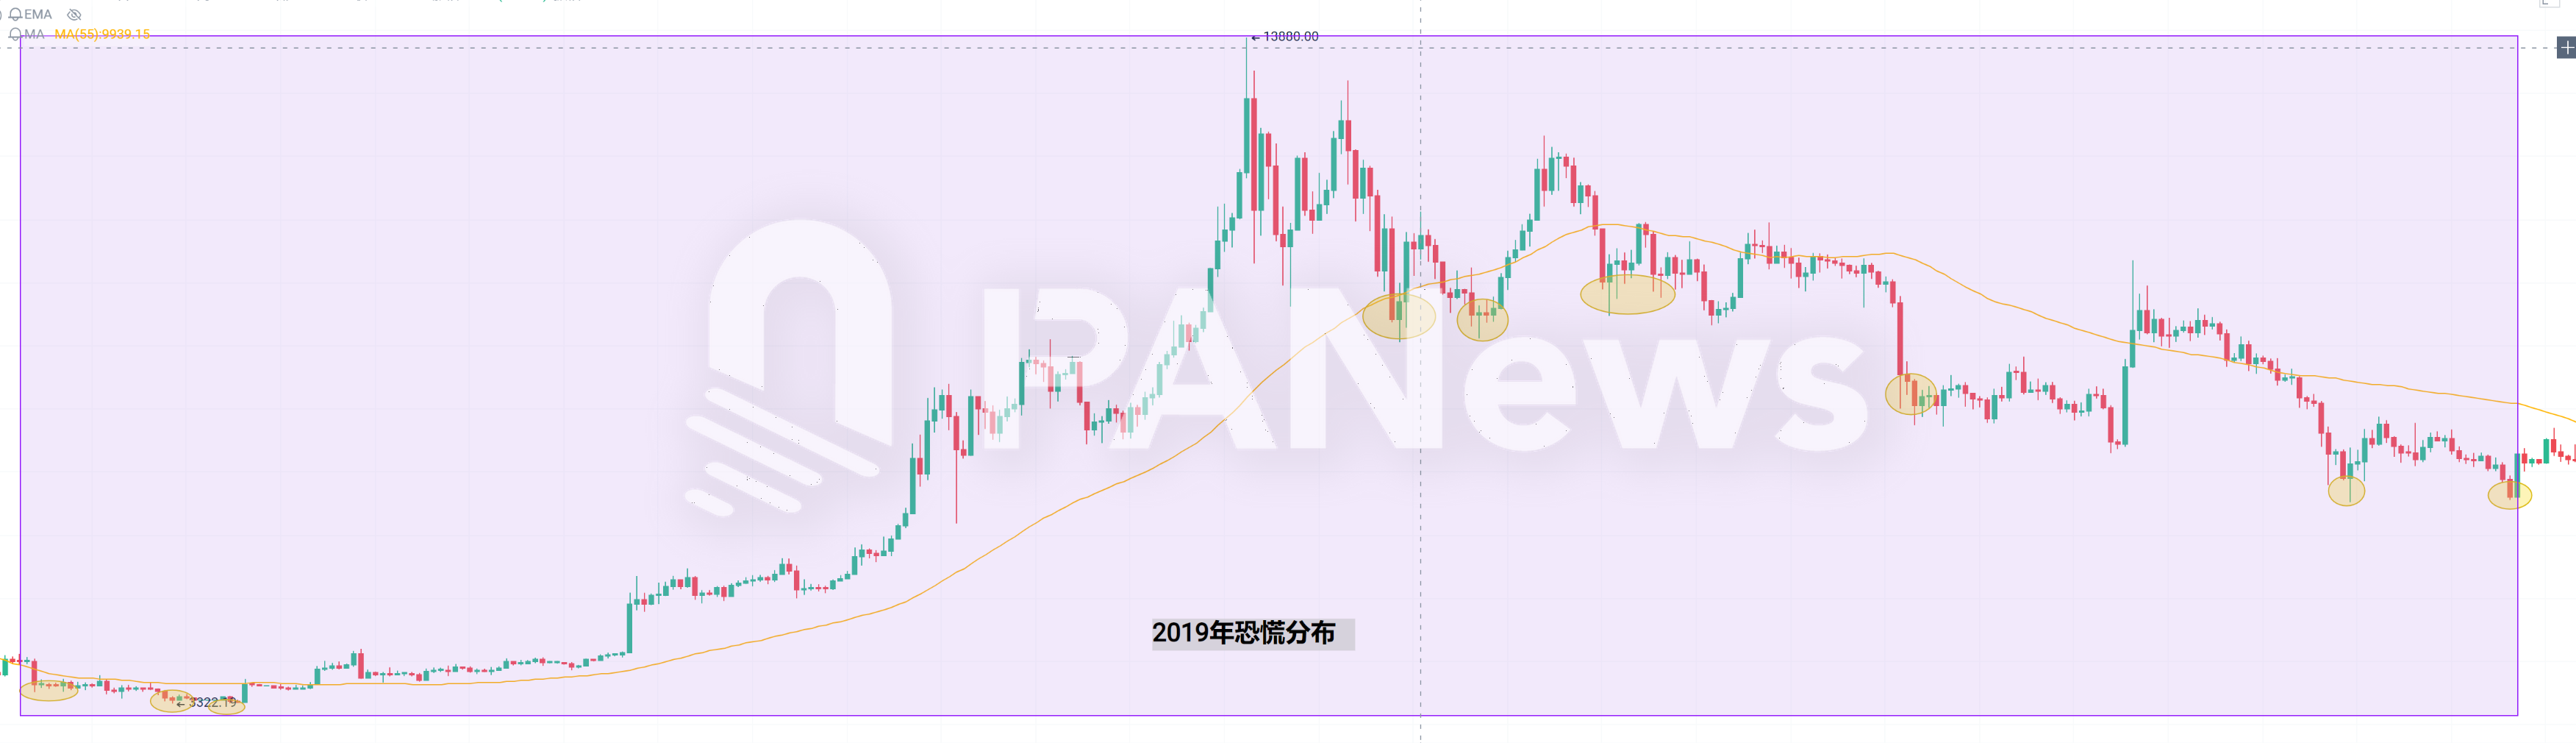
There were fewer panic moments in 2019 than in 2018, with the index falling below 20 20 times. During this phase, the panic period was divided into two parts. One part was the continuation of the end of the bear market in 2018, and the other was the panic cycle caused by the first rapid decline after reaching the peak. Especially in the correction phase after the rise, the panic caused was even more serious than the end of the bear market. On August 21, 2019, the panic index fell to 5, becoming the lowest panic index in the history of crypto. However, this extreme panic was mainly due to the continuous correction of the market after the frenzy of rising, which made the market nerves extremely fragile.
In fact, the panic moments in 2019 were gradually less affected by news, but hacker attacks and security vulnerabilities also had a significant impact on the entire market. In 2019, about 10 major exchanges reported being hacker attacks, among which Binance Exchange had 7,000 bitcoins stolen in May, which attracted market attention.
In addition, China began to adopt restrictive policies on Bitcoin mining that year, and a large number of miners began to move overseas. Behind the several plunges in 2019, it seems difficult to find direct sources of information, which is more like the self-regulation of the market.
2020: The “3.12” black swan continued the panic for 43 days
In the ranking of panic moments in the crypto market, 2020 is definitely the most painful year. Although in terms of time, the panic moments in 2020 were the most concentrated, mainly in March and April. The index did not fall below 20 in the rest of the time.
However, the 3.12 crash caused the market to fall into panic for a long time in March and April. According to PANews statistics, in March 2020, there were 6 days with a panic index below 10, which was the highest in history. In March and April, there were 43 days with a panic index below 20. These were the two months with the most panic in the history of cryptocurrencies.
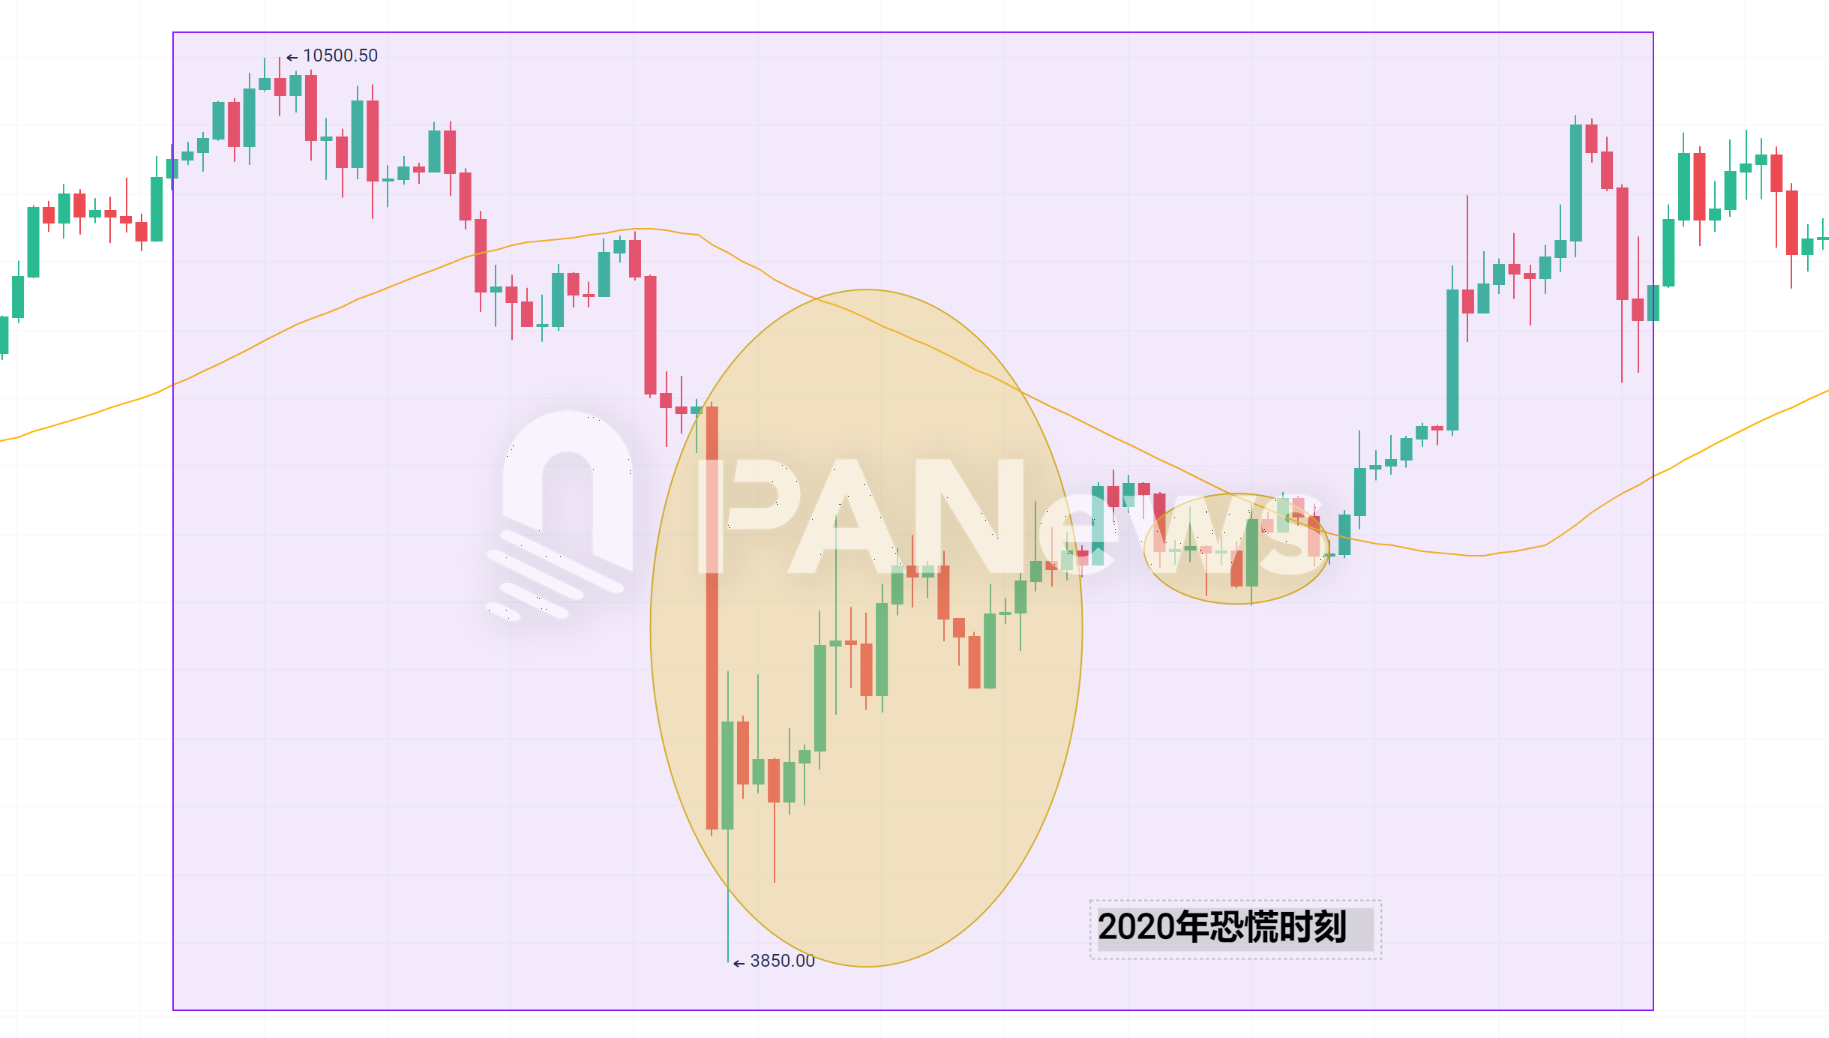
The panic in March 2020 was mainly caused by the COVID-19 outbreak that year. The global financial market suffered a Black Thursday on March 12. As the market fell, high-leverage positions were liquidated on a large scale in a short period of time, causing Bitcoin to fall by 51% in one day.
Fortunately, the market was optimistic for most of the rest of 2020. After the important turning point on March 12, the cryptocurrency market entered a new round of rising cycle. According to the report of CoinGecko, the market value of the top 30 cryptocurrencies increased by 308% in 2020, exceeding the 62% in 2019. Bitcoin soared from a low of $3,850 to a high of $64,895. The increase in 400 days was nearly 17 times.
2021: FUD strikes and market shocks
The market in 2021 has once again suffered a sharp decline, and the reasons for this market crash are multifaceted. First, Tesla CEO Elon Musk announced on May 12 that Tesla would suspend the use of Bitcoin to purchase cars due to concerns about the impact of Bitcoin mining on the environment. Second, the Peoples Bank of China reiterated on May 18 that digital tokens cannot be used as currency and prohibited financial institutions and payment institutions from providing services related to cryptocurrencies, which further exacerbated the selling pressure in the market.
The market subsequently fell into a downturn, and market sentiment was in a state of panic during the consolidation phase before August.
However, after entering August, the crypto market ushered in another wave of sharp rises, with the price of Bitcoin reaching as high as $69,000. After that, in December, as the market entered a new round of decline, the crypto market fell into panic again.
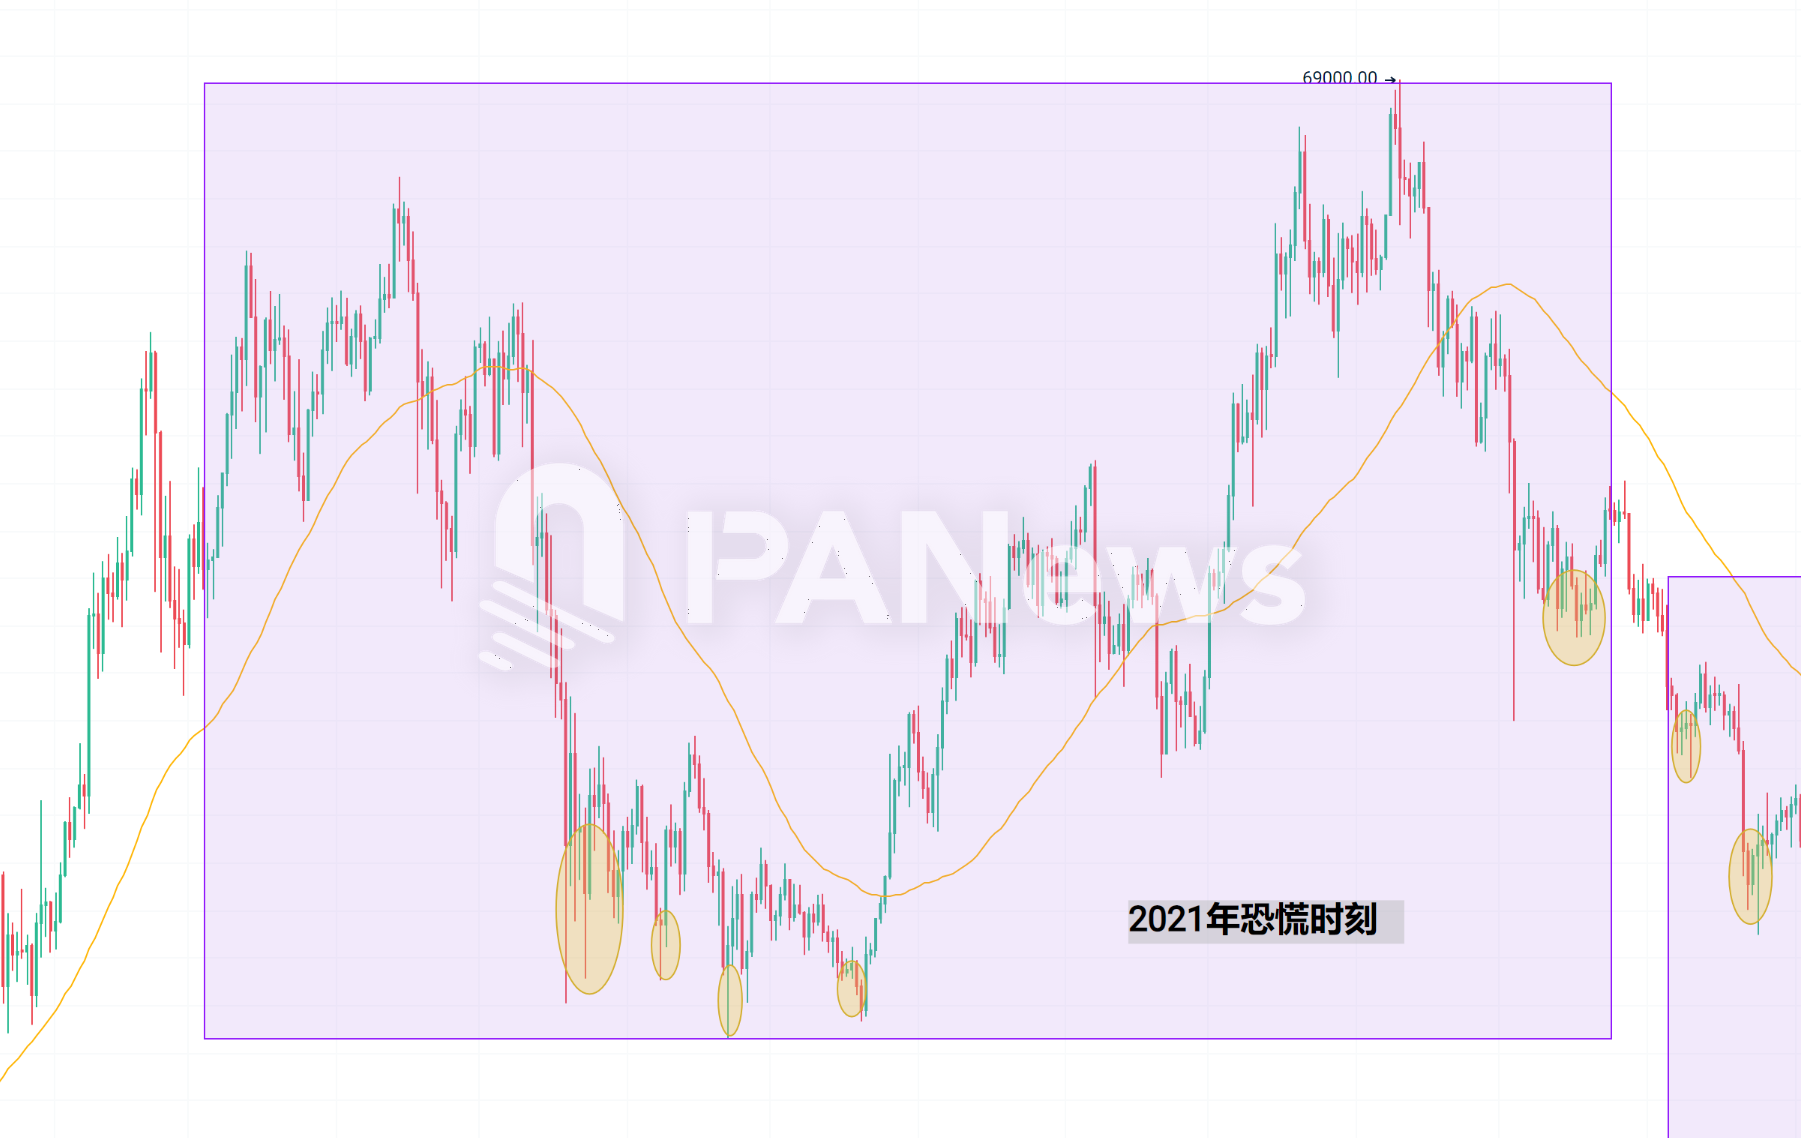 Overall, the panic moment in 2021 basically marks the end of a rising trend.
2022: Luna crash brings 65 consecutive days of panic
The panics in 2022 can be divided into three parts. The first two panics were still caused by the continuation of the downward trend in 2021. The third panic lasted for 65 days, the longest in history. The panic index also fell to 6, second only to the lowest point of 5 in 2019.
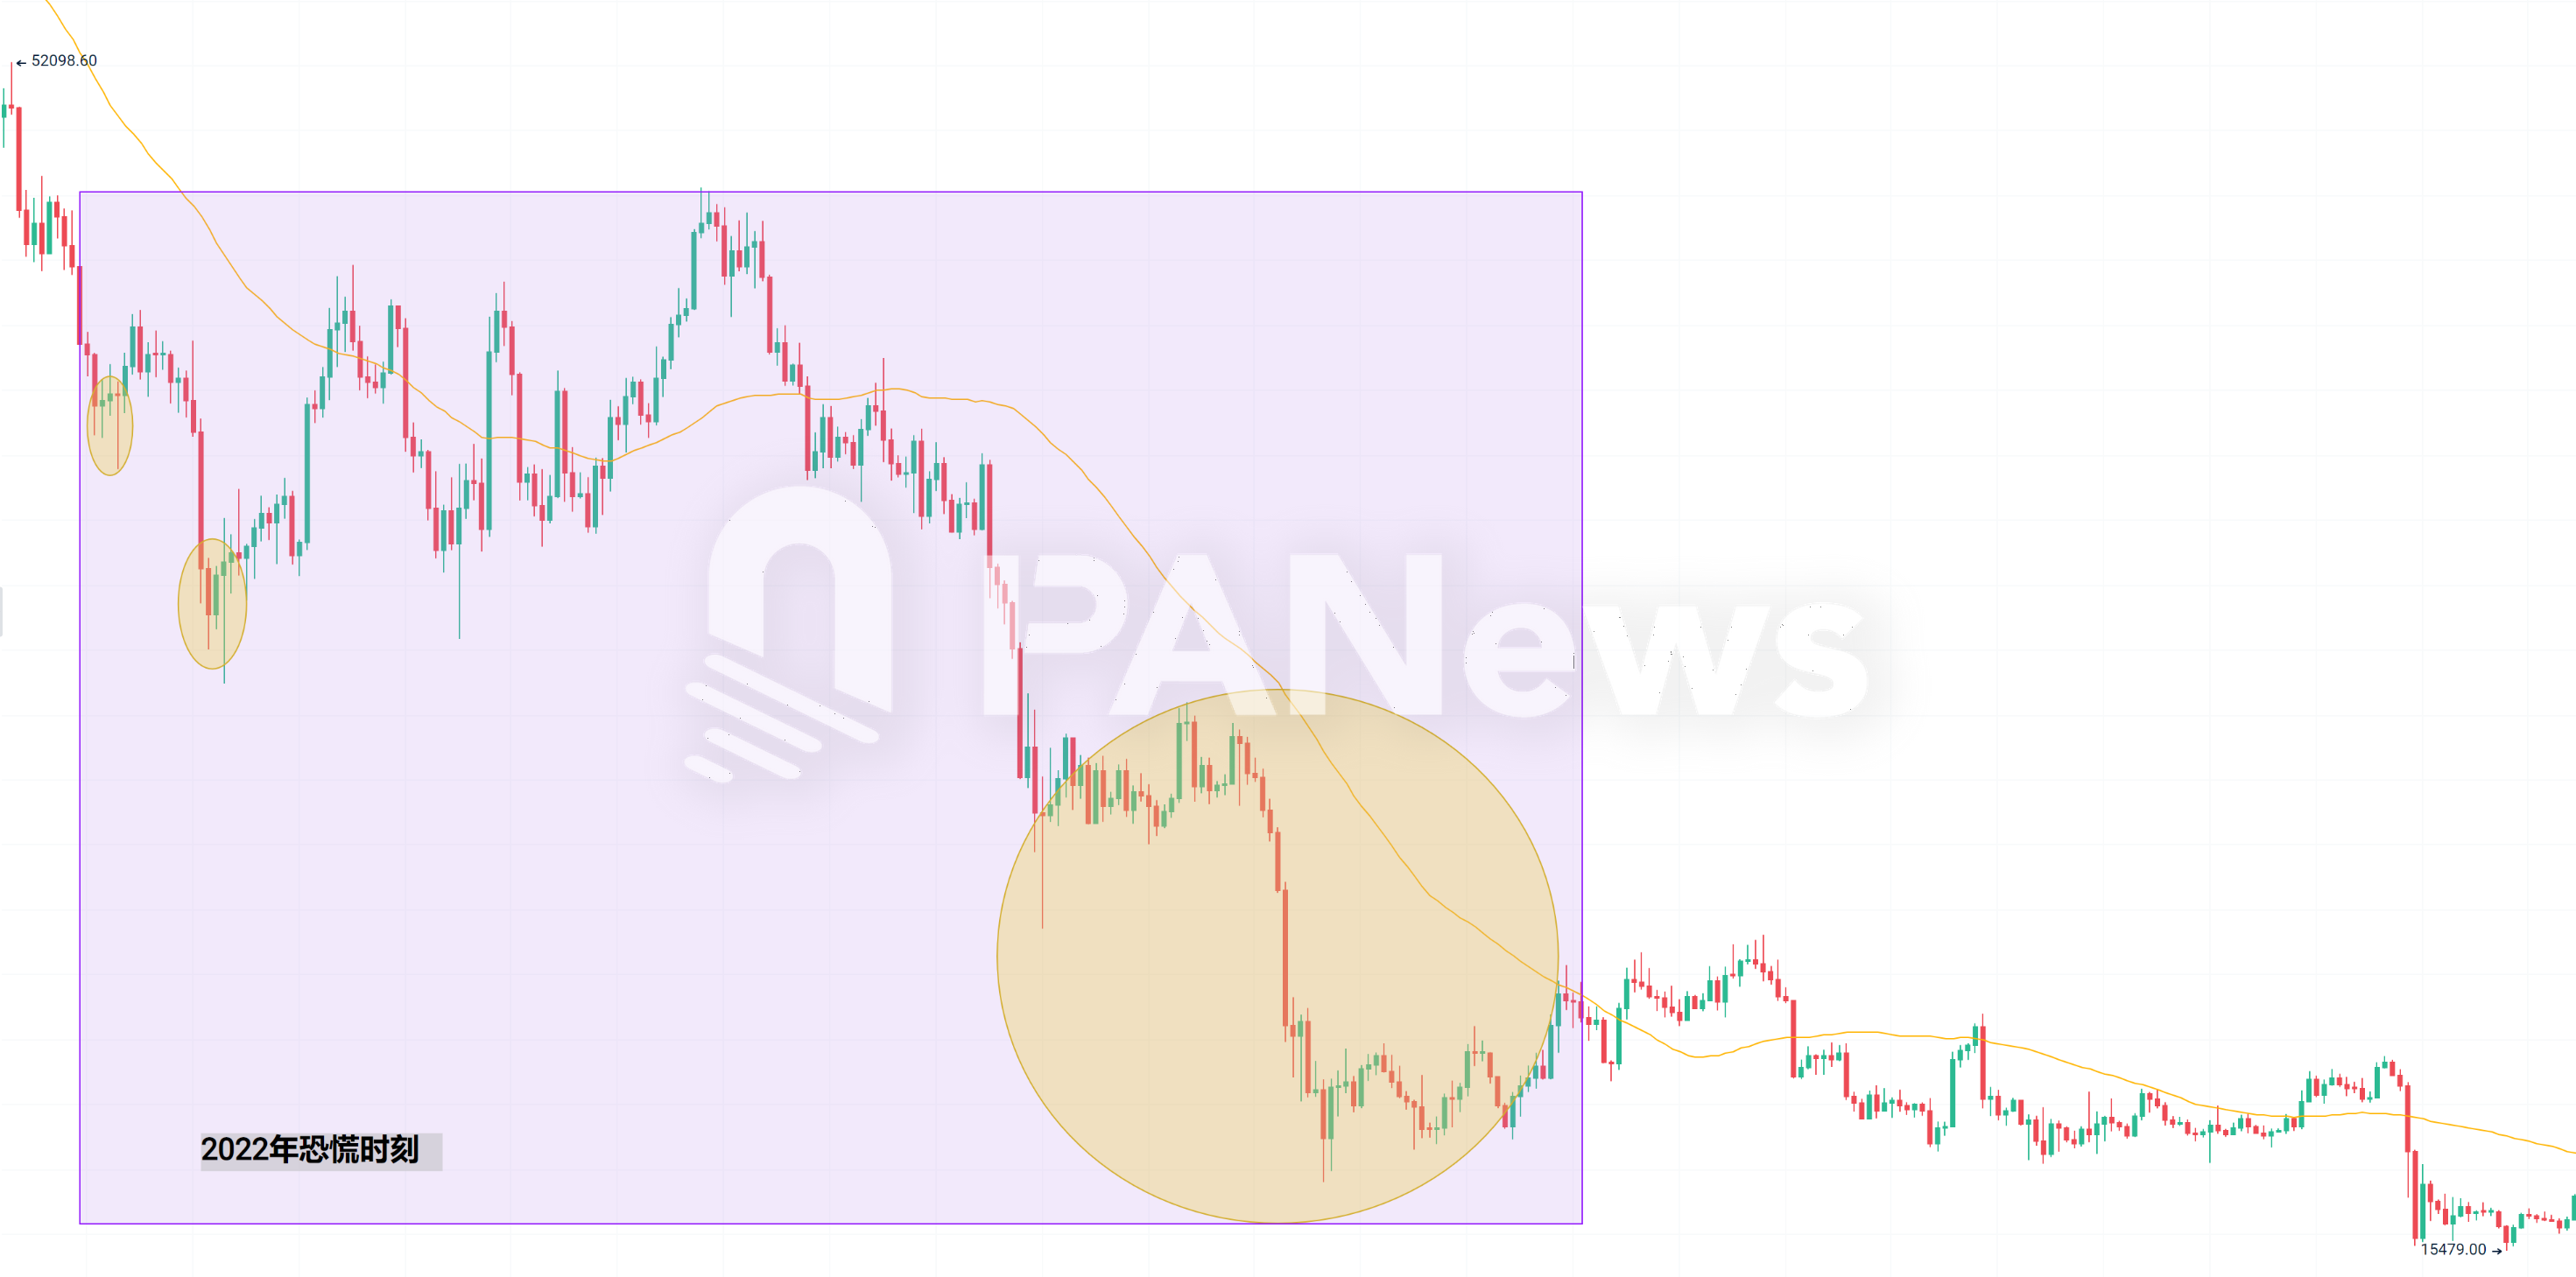
The 2022 crash was mainly caused by the Terra/Luna crash. On May 9, UST was decoupled from the US dollar and the Terra blockchain was suspended. Celsius Network suspended all transfers and withdrawals on June 13. Three Arrows Capital (3AC) defaulted in June and was ordered to liquidate in July. Bitcoin fell below $30,000 for the first time since July 2021. On July 13, the global cryptocurrency market value reached $871 billion.
But the 2022 crash was not just about Luna’s depegging. The FTX exchange crash in November also brought the market into panic, with Bitcoin falling to as low as $15,479, the lowest point in nearly three years. However, this crash did not seem to show much volatility in the panic index, which fell to as low as 20.
But it can also be seen from here that when the market enters the late stage of a bear market, events that the market intuitively feels very strongly are often not reflected much in the index. Thinking about it the other way around, when the market seems to be in a panic, but the index does not fluctuate too much, it may also be the moment when the market is about to change.
2023-2024: Panic subsides and market recovers
After the market bottomed out in 2022, the market completely returned to the rising cycle. The panic index did not fall below 20 throughout 2023, and it did not fall to 17 again until August 2024, when an extreme panic occurred. However, this panic was caused by a rapid correction during the rise.
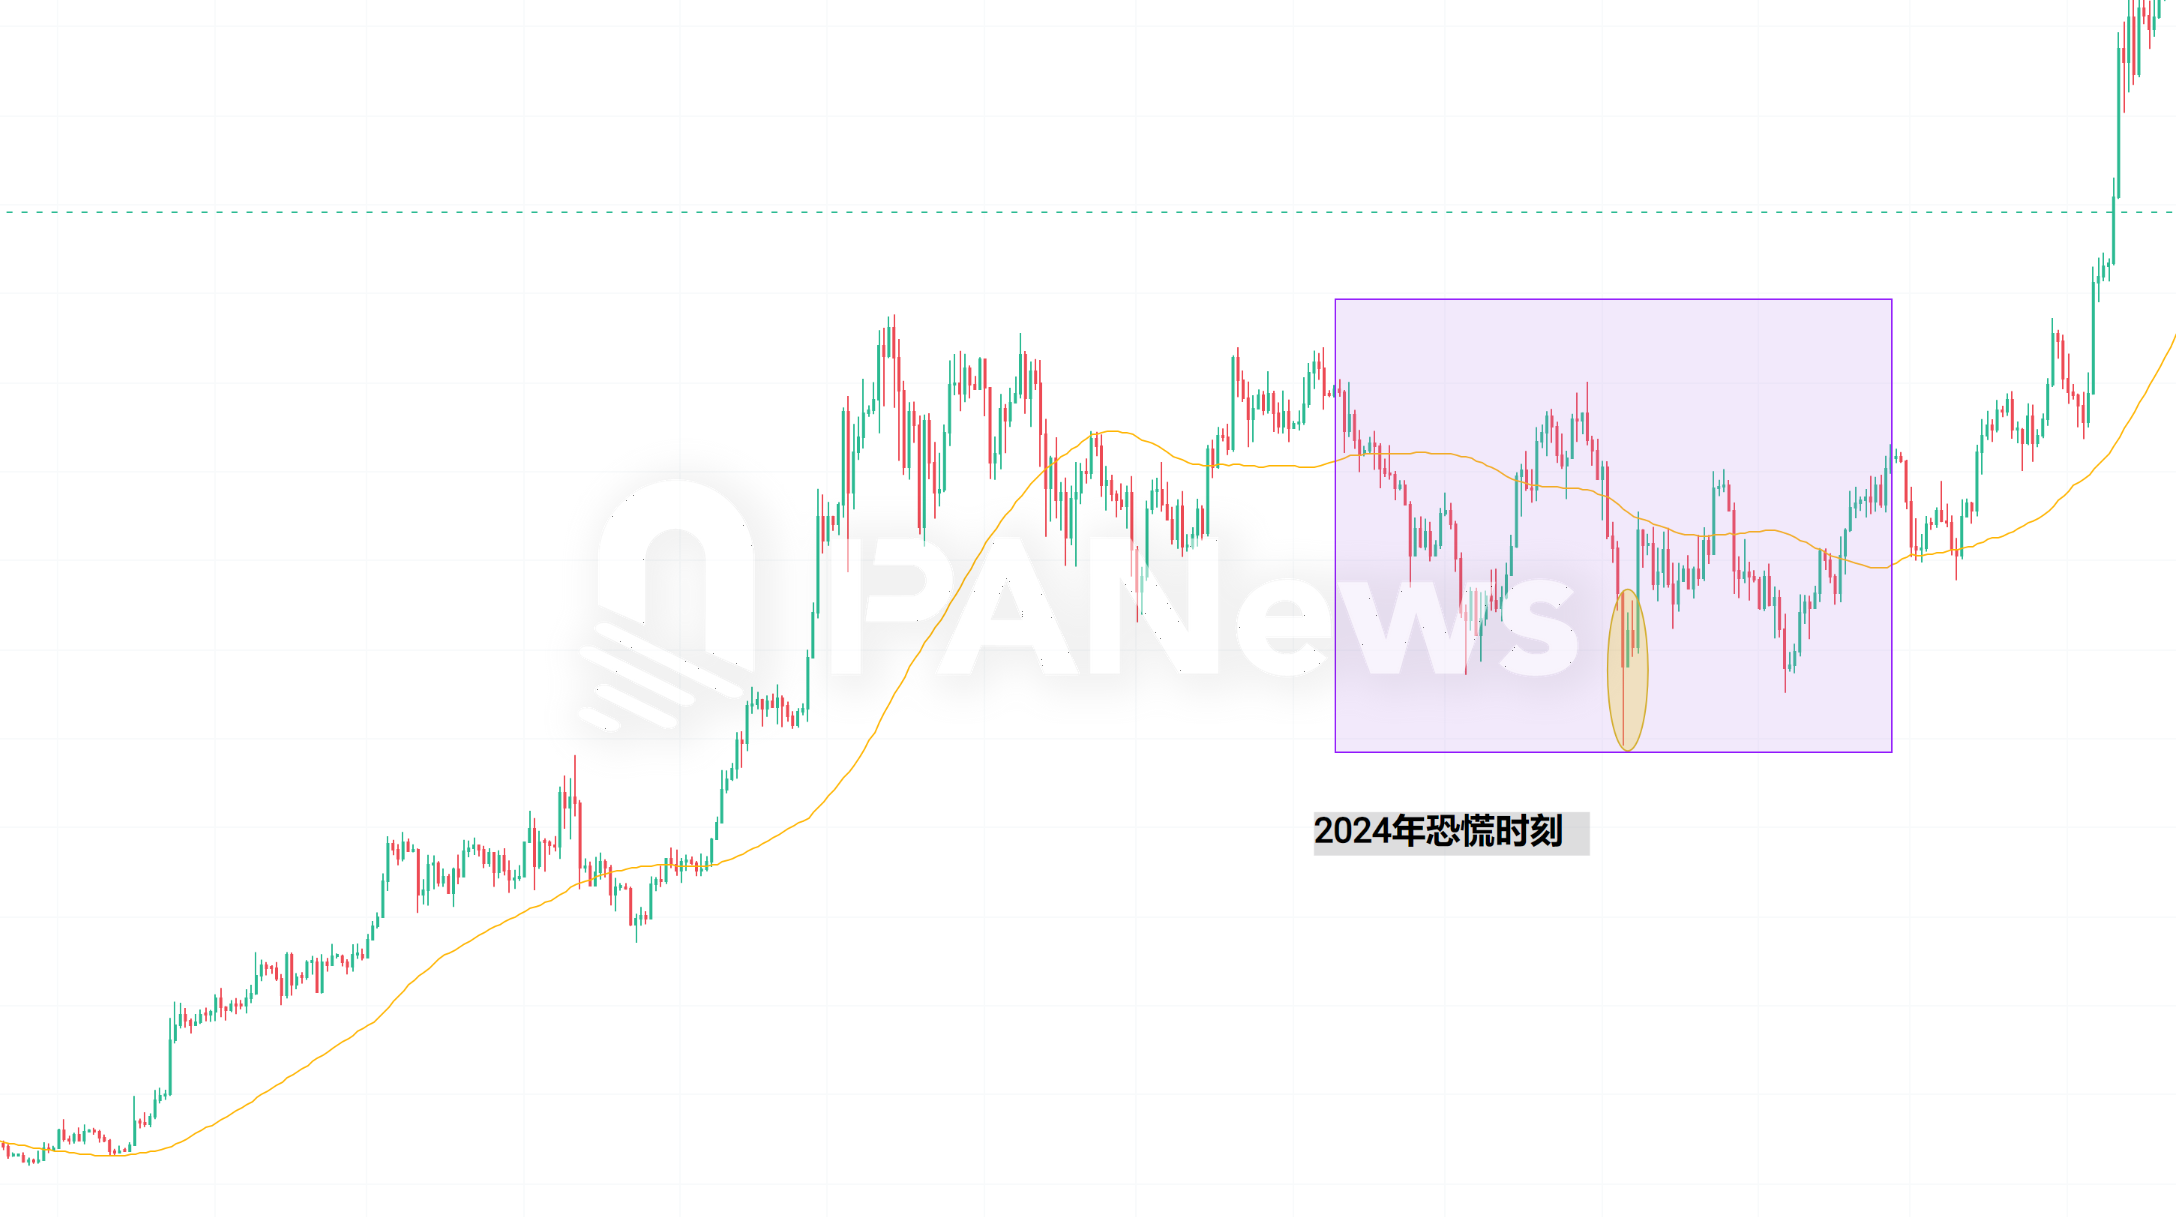
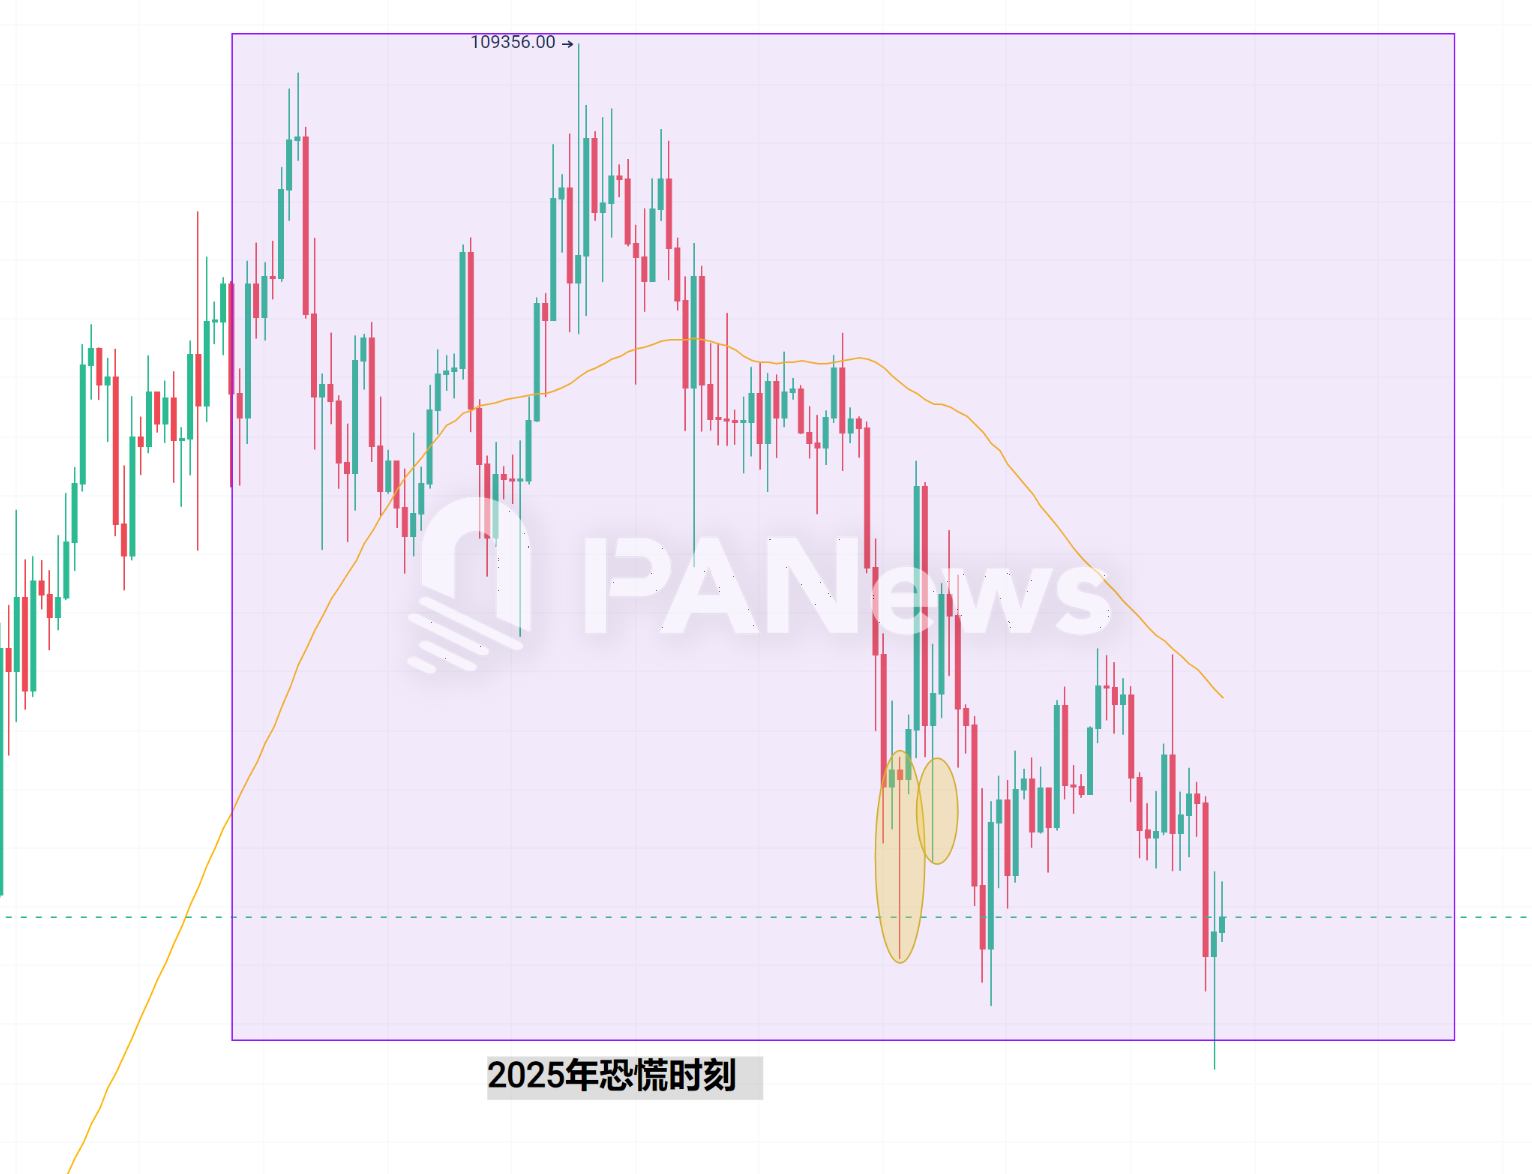
2025: Panic reappears and the future is unclear
The panic moments in 2025 seem to be frequent again. As of April 8, the panic index has fallen below 20 three times. Among them, it fell to 10 on February 26. It fell to 15 again on March 3. On April 7, affected by the Trump administrations global increase in tariffs, the global financial market fell into a major collapse, and Bitcoin fell below $75,000. But the panic index did not fall below 20. This time it seems to be similar to the hint given by the panic index when FTX collapsed in November 2022. Its just that after the FTX crash, the crypto market really hit the bottom, began to rebound and grew into a bull market. And this time, I wonder if the impact of tariffs is the beginning of a decline or a signal of the bottom?
239 thoughts behind panic moments
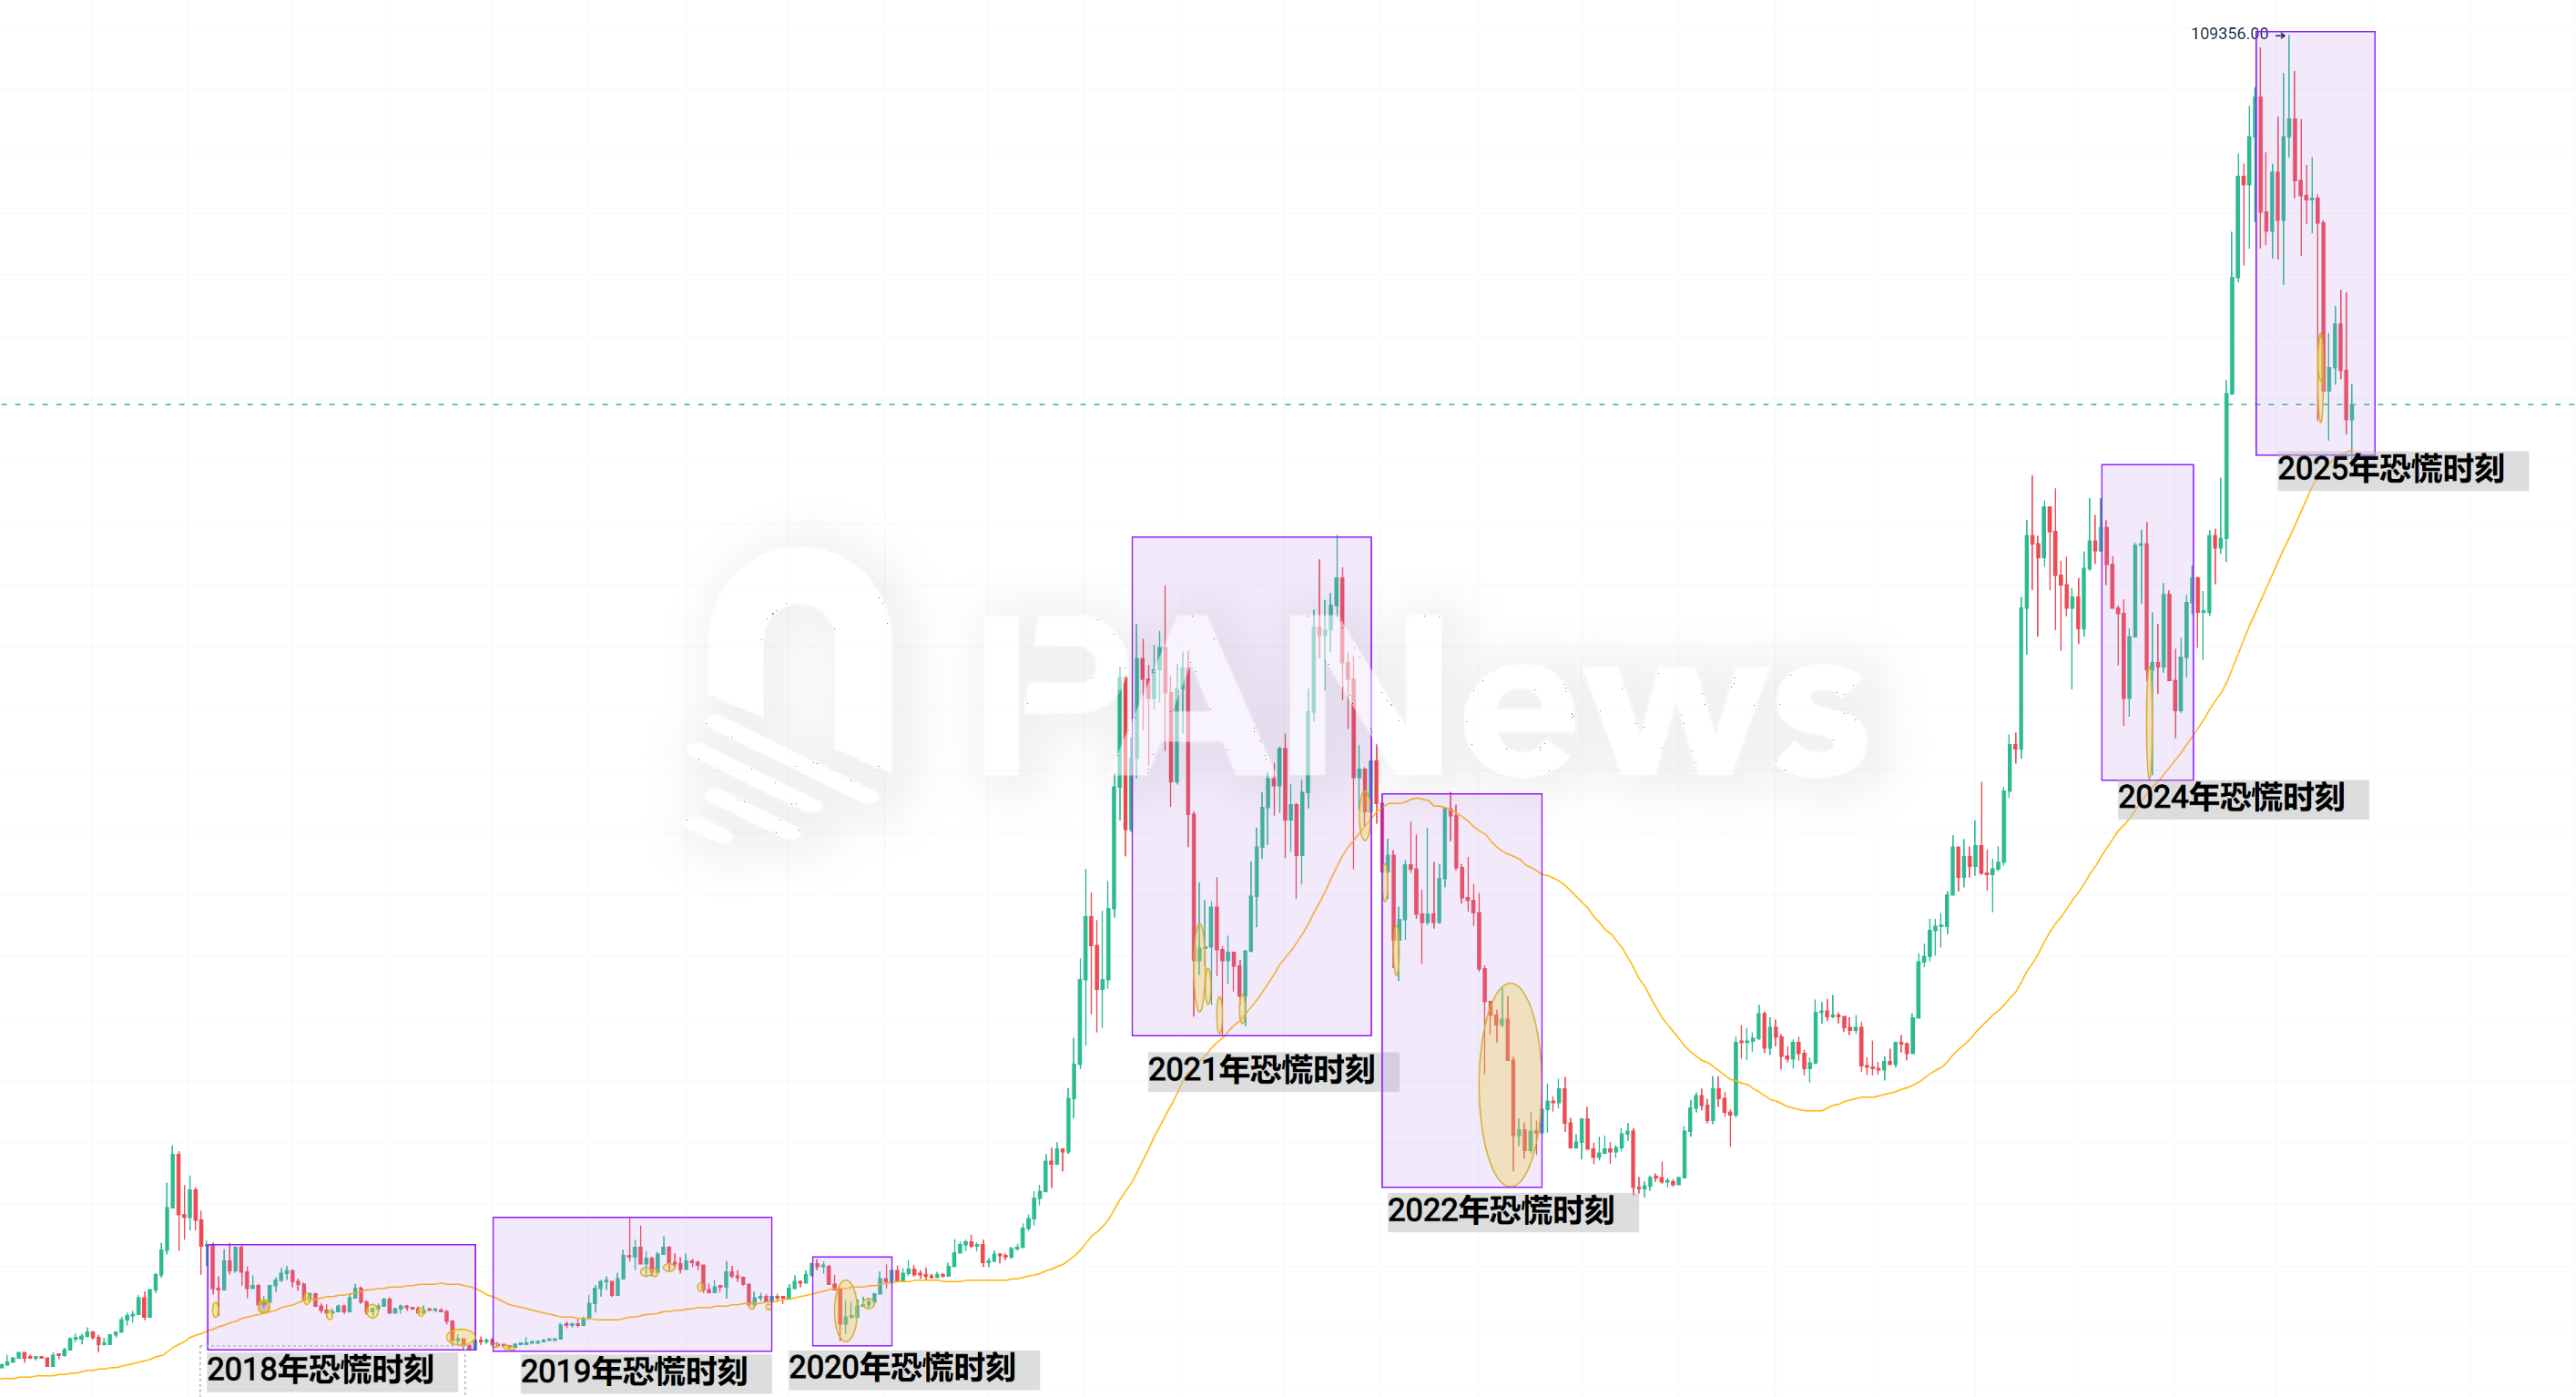
According to PANews statistics, the crypto market has experienced 239 extreme panics (values below 20) in more than 6 years. In most cases, these panics are caused by a sharp drop in the market and are at a short-term bottom.
Through further analysis of these panic moments, PANews summarized the following interesting patterns.
1. Panic moments are basically concentrated in two stages. One is at the end of the bear market. With the shrinking of market liquidity, the market becomes more sensitive to market fluctuations. Generally, black swan events occur frequently at this time, such as the 3.12 or FTX crash. The other is at the beginning of the end of the bull market. When the price reaches the peak for the second time and then begins to fall, the panic selling caused by this stage is also likely to cause extreme panic. When the market is in a unilateral upward trend, the panic index has almost never been lower than 20.
2. The single duration of the panic index seems to be more meaningful. Whether it is November to December 2018 (below 20 for 27 consecutive days), March to April 2020 (below 20 for 43 consecutive days), or May to July 2022 (below 20 for 65 consecutive days), this period of continuous panic within a concentrated period of time is often a feature of the market approaching the bottom. When the market continues to panic, it is the beginning of the reversal of extremes.
3. Sporadic panic moments with relatively long intervals often have little reference value for judging market trends. Many people in the market believe that when the market enters extreme panic, there will often be a rebound. In most cases, this rule does work in the short-term market, but if you magnify the cycle, you will find that such sporadic panic moments with relatively long intervals do not mean that the market has reversed, but often only mean that the market is still in a bear market (refer to the panic moments from February to November 2018 or from July to September 2019).
4. The panic moments under the panic index have become less and less in recent years, with 93 in 2018, 73 in 2022, but only 1 in 2023 and 2024. On the one hand, the size of the crypto market is getting bigger and bigger, and the volatility is not as severe as before, which reduces the occurrence of panic moments. But on the other hand, after the relatively stable market in the past two years, the market may enter a stage in 2025 where panic moments are more frequent.
Looking at the 239 extreme panics in more than six years from 2018 to the beginning of 2025, we can see a certain pattern of the tide of crypto market sentiment: panic often appears at the end of a bear market and at the beginning of a bull market. Among them, continuous deep panics for many days are more likely to indicate the approach of a stage bottom than sporadic panics, confirming the market philosophy that extremes will turn into opposites.
History will not repeat itself, but it will always be strikingly similar. Understanding the signals sent by the panic index, carefully distinguishing short-term fluctuations from long-term trends, and making comprehensive judgments based on macro events and changes in market structure will be an important reference for investors to navigate the ever-changing world of cryptocurrencies. Ultimately, whether the current market is the prelude to a new round of decline or another bottom signal of panic is opportunity still needs time to give an answer.


