

BTC Volatility Weekly Review (September 14 to September 21)

Spot Metrics (Hong Kong Time, September 14, 16:00 to September 21, 16:00)
- BTC/USD rose 5.0% ($77,600 → $81,500), ETH/USD rose 5.6% ($2,510 → $2,650)
BTC/USD Spot Technical Outlook
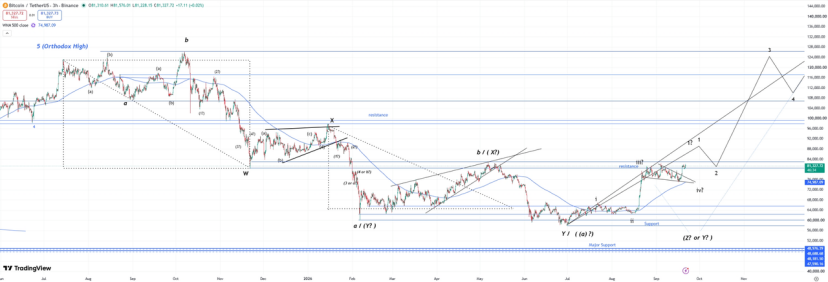
• The market finally formed a pennant pattern and subsequently completed a breakout. Now, the market appears to have only one simple task remaining: completing the rally that has already been set in motion. Based on typical pattern analysis, price could move toward $86,000–$88,000 from the current level. But of course, the overhead resistance at $82,000–$83,000 has been virtually an impenetrable wall over the past 4–5 months. From a historical perspective, there is some precedent for heavy selling during rebounds. Similar breakouts in the past typically took 6–7 months to complete (one may have taken close to 5 months), though there were also instances that lasted nearly 12 months. So the argument that "past cycles lasted longer and were more protracted" is not unreasonable; however, relying solely on this to bet on further price declines is not sufficiently supported. Under traditional wave counting, the high-to-low cycle has already extended from August to July of the following year, and an 11-month duration is well within historical range. That said, even if spot prices remain below this resistance level for several more weeks or even months, it would still largely align with our expected overall advance structure. But overall, the market appears "ready" for a significant move higher in the near future, and the price level at which bears begin to capitulate—or at which their trading thesis is invalidated—is only 4%–5% away from current levels.
Market Themes
- Last week, macro markets were mainly focused on central banks, as both the Federal Reserve and the Bank of Japan hiked rates, beginning to catch up with the rate hike cycles already initiated by other G10 central banks. The market was well prepared for both outcomes, with the bond market having already priced in more than a 90% probability of both hikes. In effect, this outcome achieved what was needed to stabilize long-dated bond yields: notably, the Fed regained some credibility and dispelled market claims that Warsh was controlled by Trump. Although the Fed's hike could be described as quite hawkish, US equity markets reacted largely muted overall due to a flattening yield curve and more stable long-dated bond yields, with the S&P 500 ultimately closing higher.
- The crypto market began the week with optimism around the Clarity Act, with the Senate originally scheduled to vote on Tuesday, September 15, to initiate a "cloture" procedure. Trump approved a revised ethics rule draft in hopes of winning Democratic support. But this ultimately proved insufficient: Democrats rejected the proposal late Monday, and no counter-proposal garnered enough support. In the end, the motion received only 49 votes, falling short of the 60 needed to invoke cloture. This failure caused spot prices to pull back to the lower end of the recent range. Subsequently, the Fed's hawkish rate hike pushed BTC to test the recent local low of $75,000, while ETH tested $2,380. However, prices found support and buying interest at these levels. By the weekend, the CFTC had submitted a regulatory framework to the White House, replacing the Clarity Act as the market's new focus, driving prices back to the upper end of the range; ETH set a new high.
BTC USD Implied Volatility
BTC USD ATM Implied Volatility (Hong Kong Time, September 14, 16:00 to September 21, 16:00)
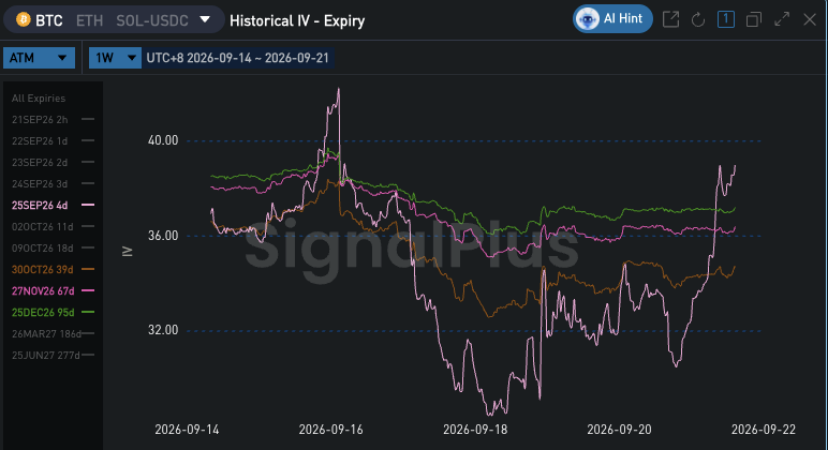
- With the additional uncertainty from the Clarity Act vote and the FOMC event removed, implied volatility declined overall over the past week; meanwhile, neither event was able to push spot prices out of the recent trading range. Before the weekend, news related to the CFTC regulatory framework drove prices above $80,000, a move that caught the market off guard and supported short-term volatility; however, due to selling pressure during the week, the back end of the curve remained weak. Given that spot prices are now very close to a clear upward breakout and realized volatility has once again picked up from lower levels, we expect renewed interest in options at current levels.
- After the uncertainty from last week's series of events was removed, the term structure briefly began to steepen; but subsequently the market began shorting term premium across the curve, causing forward volatility to gradually decline. The rise in front-end volatility before the weekend significantly flattened the curve; forward volatility is currently very low both in absolute and relative terms. As last week's price action demonstrated, accurately timing when spot will experience a significant move or breakout remains extremely challenging. As a result, short-dated call buyers have been consistently losing money so far. We believe that structurally, longer-dated volatility should incorporate more term premium, as the market remains in a high-volatility volatility environment while this spot price advance is still awaiting final directional confirmation.
BTC Skew/Kurtosis
BTC 10d Kurtosis (Hong Kong Time, September 14, 16:00 to September 21, 16:00)
BTC 25d Skew (Hong Kong Time, September 14, 16:00 to September 21, 16:00)
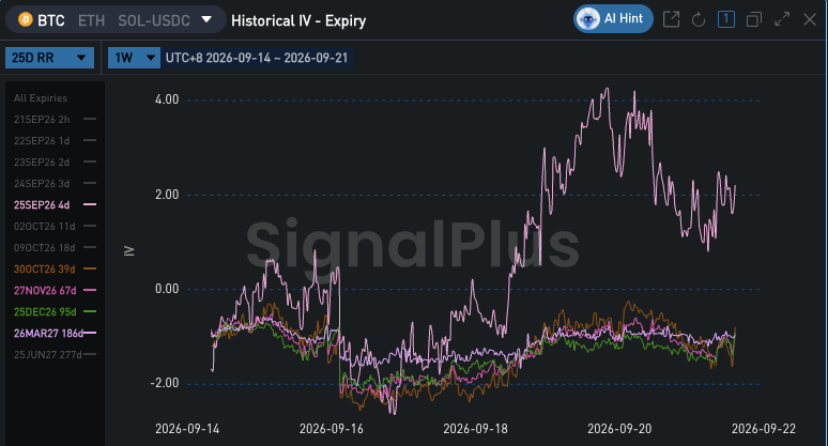
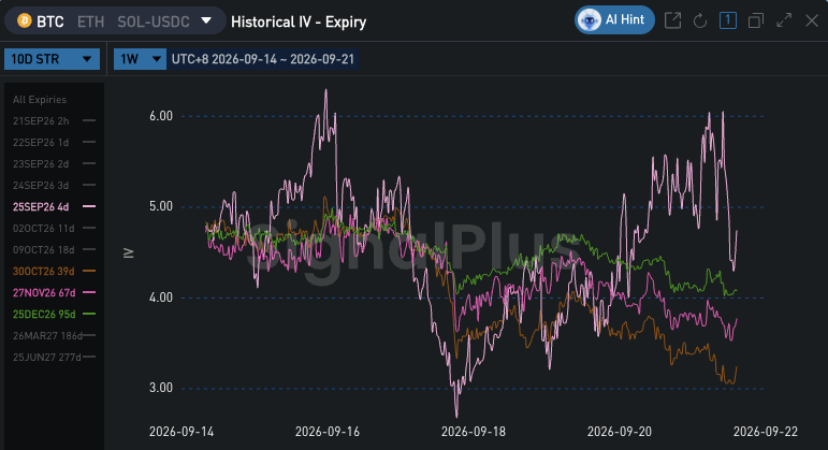
- In the first half of last week, as the potential upside tail risk from the Clarity Act and expectations of a dovish Fed pivot were gradually priced out of the curve, skew prices generally shifted toward puts. Spot prices also tested the lower end of the recent range at $75,000, which once again drew market attention to downside risk. However, a rapid and sharp rally before the weekend pushed front-end skew into positive territory—meaning calls were trading at a premium relative to puts—while the further end of the curve retraced from the deeper put pricing levels seen after the Clarity Act and Fed events.
- Kurtosis gradually declined last week. As the $75,000 support level held after FOMC, the market appeared to gradually abandon expectations of a range breakout; at the same time, given last week's event outcomes, an upside breakout also seemed difficult. However, with the rebound before the weekend and prices closing above the 50-week moving average, upside tail risk now appears to be regaining market attention. We expect this risk will ultimately be repriced on the volatility surface in the coming week.
Wishing everyone successful trading next week!
Optimus is a technology-driven digital asset trading and liquidity solutions provider, focused on delivering professional digital asset trading technology and services to institutional clients. The company independently develops core technologies including algorithmic trading, market making, pricing, risk management, and API connectivity, providing institutional clients with efficient trading and liquidity management solutions.