


Bitcoin price prediction after halving
1. stock-to-flow model prediction
It will reach US$1,293,182 in May 2025, which is close to the US$1,500,000 predicted by Sister Mu.
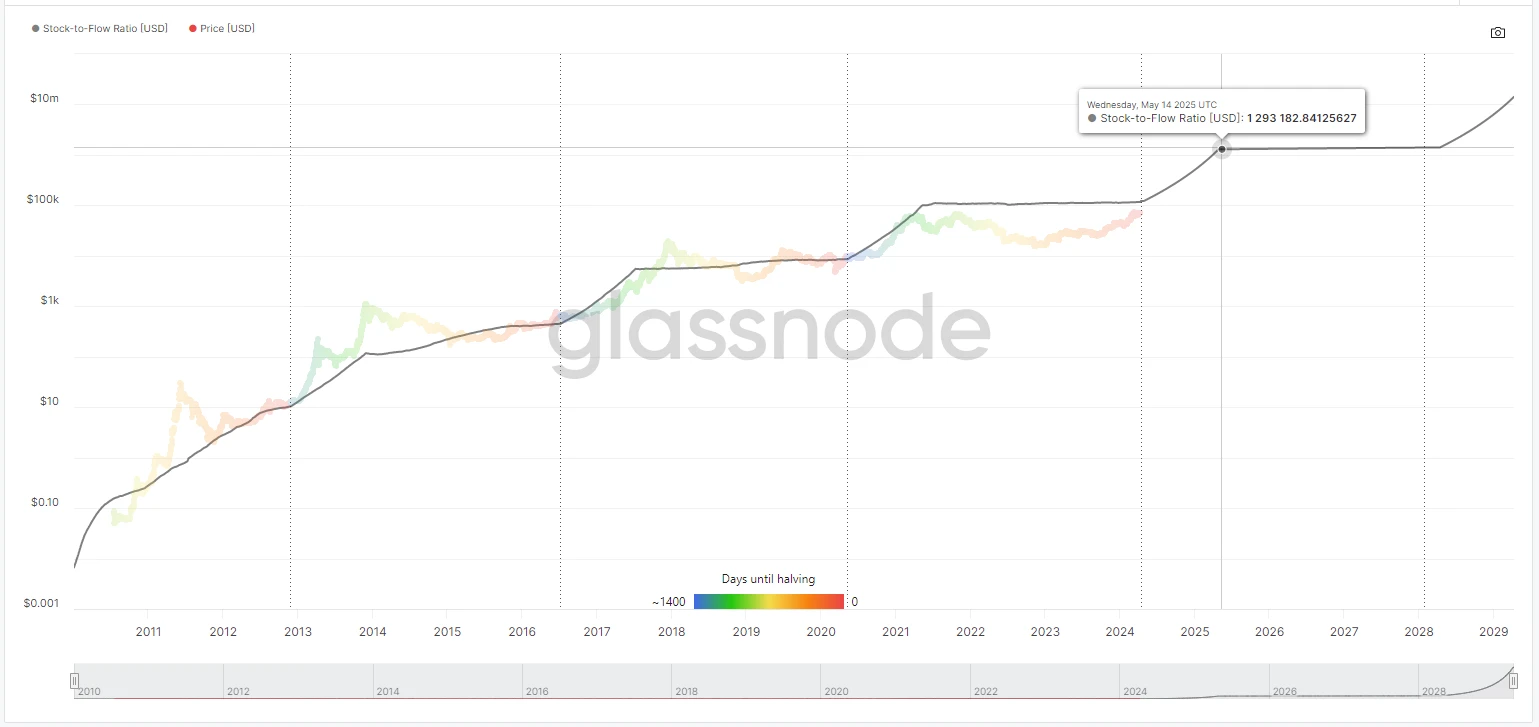
Data source: Glassnode
2. Linear model prediction
The linear model uses a fixed 18-month window after the halving to calculate the value of the price change rate, and then uses the linear model to predict the change rate in the next 18 months after the halving, resulting in an increase prediction of 375.66%.
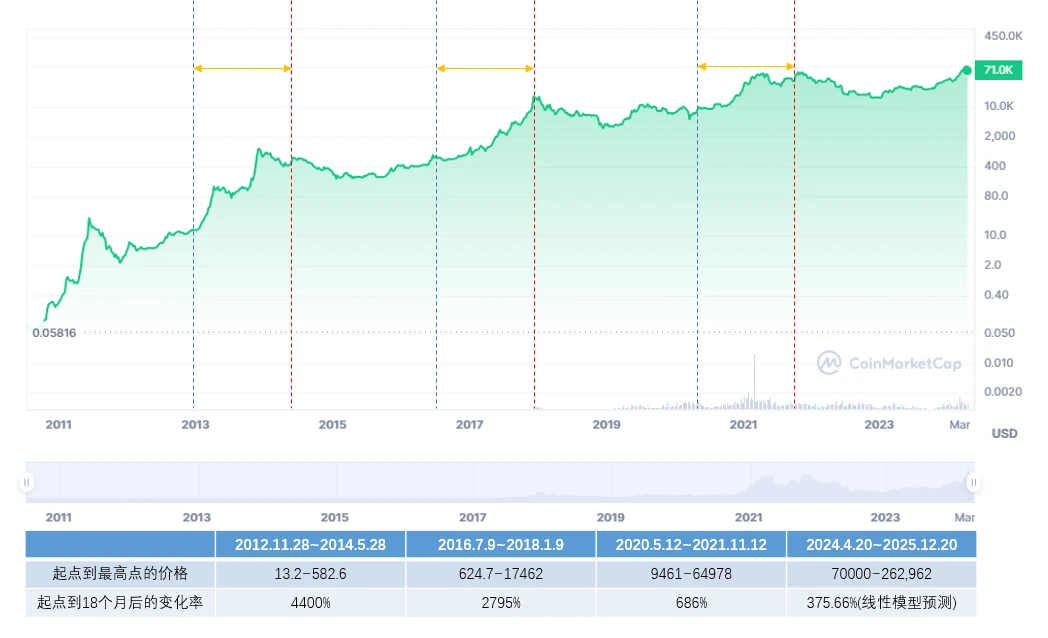
Data source: CoinMarketCap
By observing the stock-to-flow model and actual price changes, it can be seen that the strongest price increases of Bitcoin occur about one year after the halving, and through the linear regression model, the rate of change one and a half years after the halving is According to the prediction, the result is 375.66%, that is, Bitcoin will reach US$260,000 around 2025.12.20. The above are all model data predictions and are not intended as investment advice.
The Bitcoin halving is about 8 days away from today (2024.04.12)
Countdown to halving:https://www.binance.com/en/events/bitcoin-halving
Market technical and emotional environment analysis
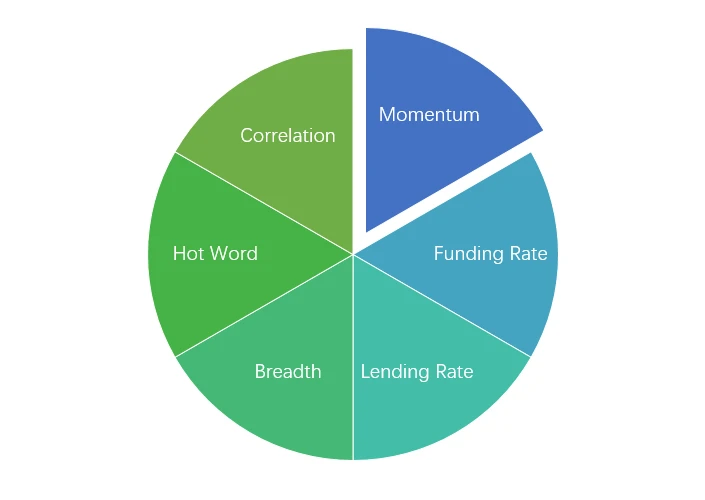
Sentiment analysis components
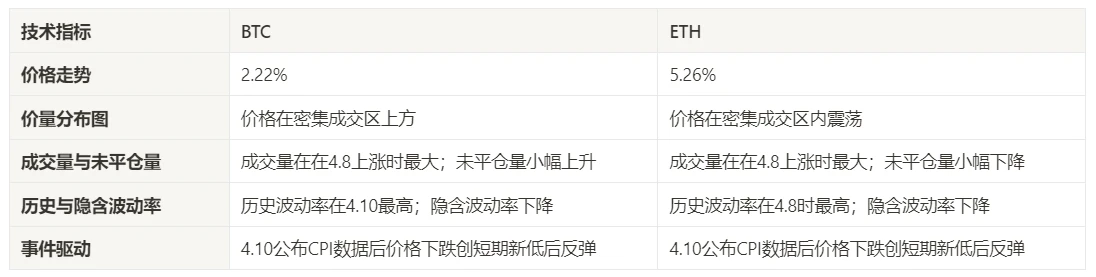
Technical indicators
Price trend
BTC price increased by 2.22% and ETH price increased by 5.26% in the past week.
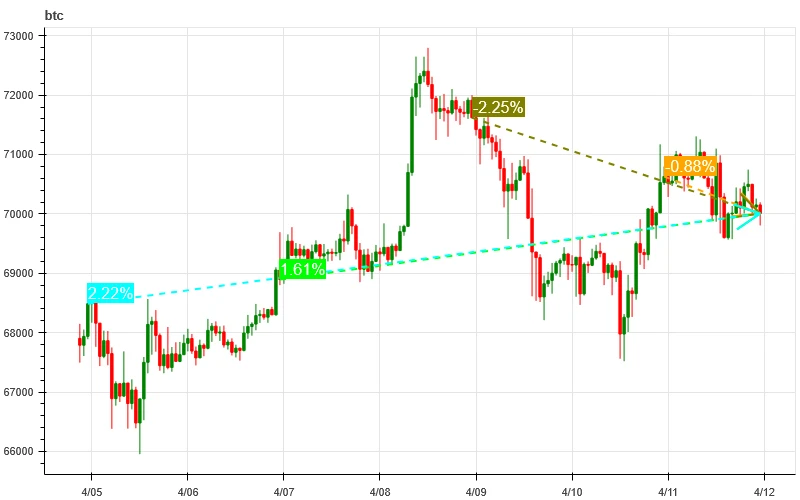
The picture above is the price chart of BTC over the past week
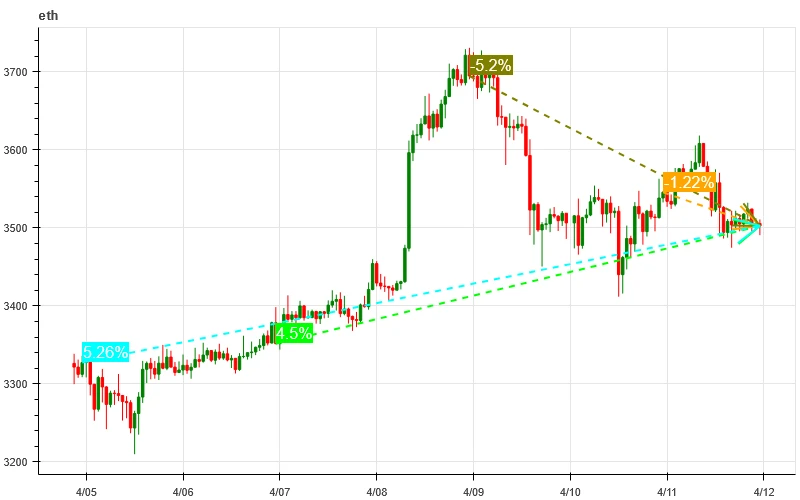
The picture above is the price chart of ETH over the past week
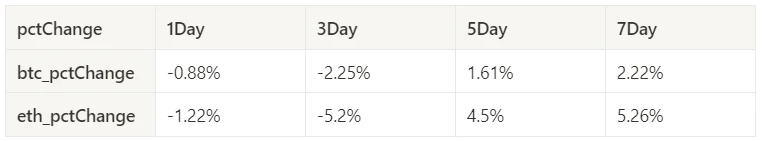
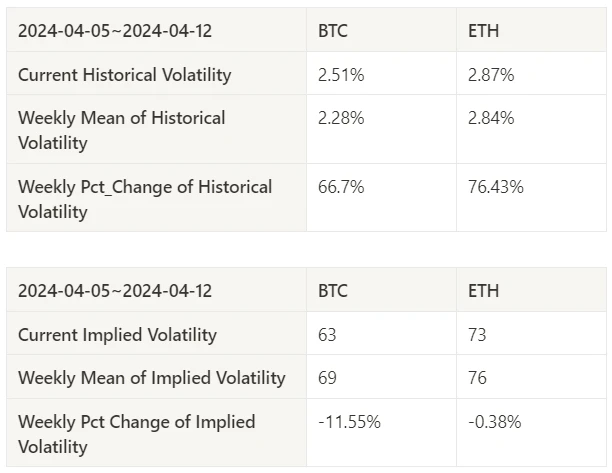
Table showing the rate of price change over the past week
Price and volume distribution chart (support and resistance)
BTC has been trading above a dense trading zone over the past week, and ETH prices have been oscillating within a dense trading zone.
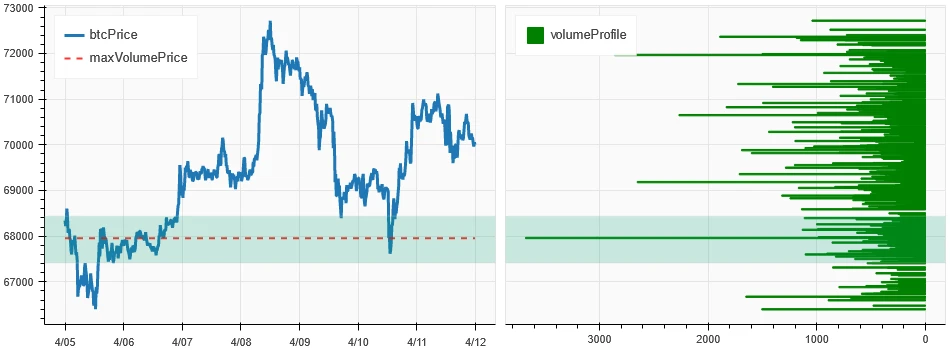
The picture above is the distribution map of BTC’s intensive trading areas in the past week.
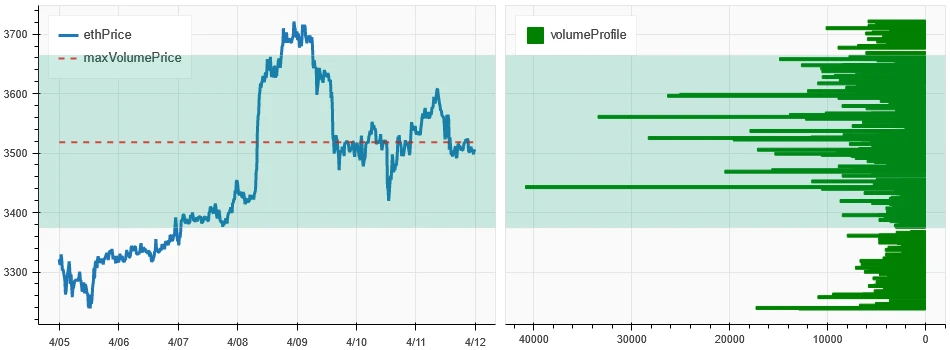
The picture above is the distribution map of ETH’s intensive trading areas in the past week.
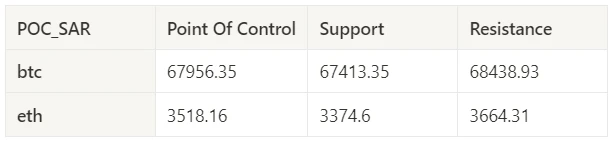
Table showing the intensive weekly trading ranges for BTC and ETH over the past week
Volume and Open Interest
The trading volume of BTC and ETH in the past week was the largest at the 4.8 increase; open interest increased slightly from the beginning of the week for BTC and decreased slightly for ETH.
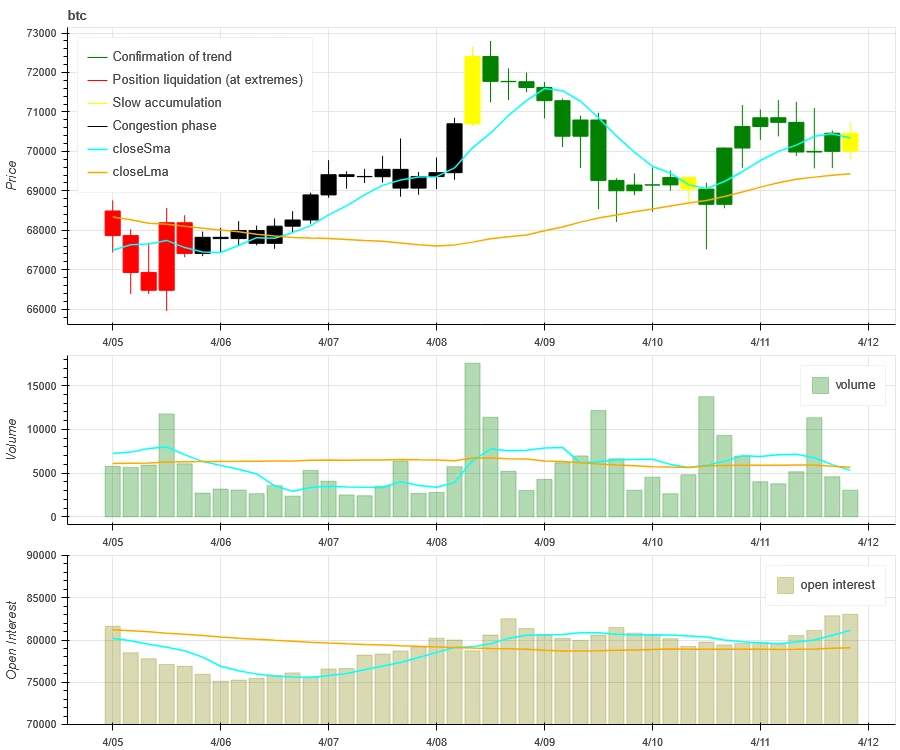
The price trend of BTC at the top of the picture above, the middle is the trading volume, the bottom is the open interest, the light blue is the 1-day average, and the orange is the 7-day average. The color of the K line represents the current status. Green means that the price rise is supported by trading volume, red means positions are being closed, yellow means positions are slowly accumulating, and black means congestion.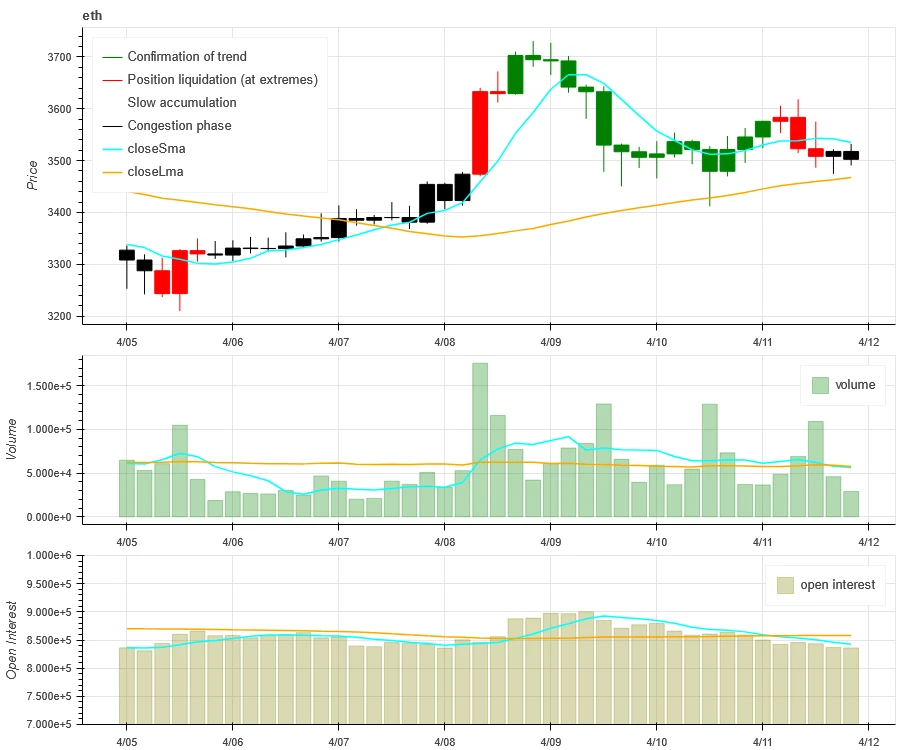
The price trend of ETH at the top of the picture above, the middle is the trading volume, the bottom is the open interest, the light blue is the 1-day average, and the orange is the 7-day average. The color of the K line represents the current status. Green means that the price rise is supported by trading volume, red means positions are being closed, yellow means positions are slowly accumulating, and black means congestion.
Historical Volatility vs. Implied Volatility
Historical volatility in the past week was highest for BTC at 4.10 and for ETH at 4.8; the implied volatility of both BTC and ETH dropped from the beginning of the week.
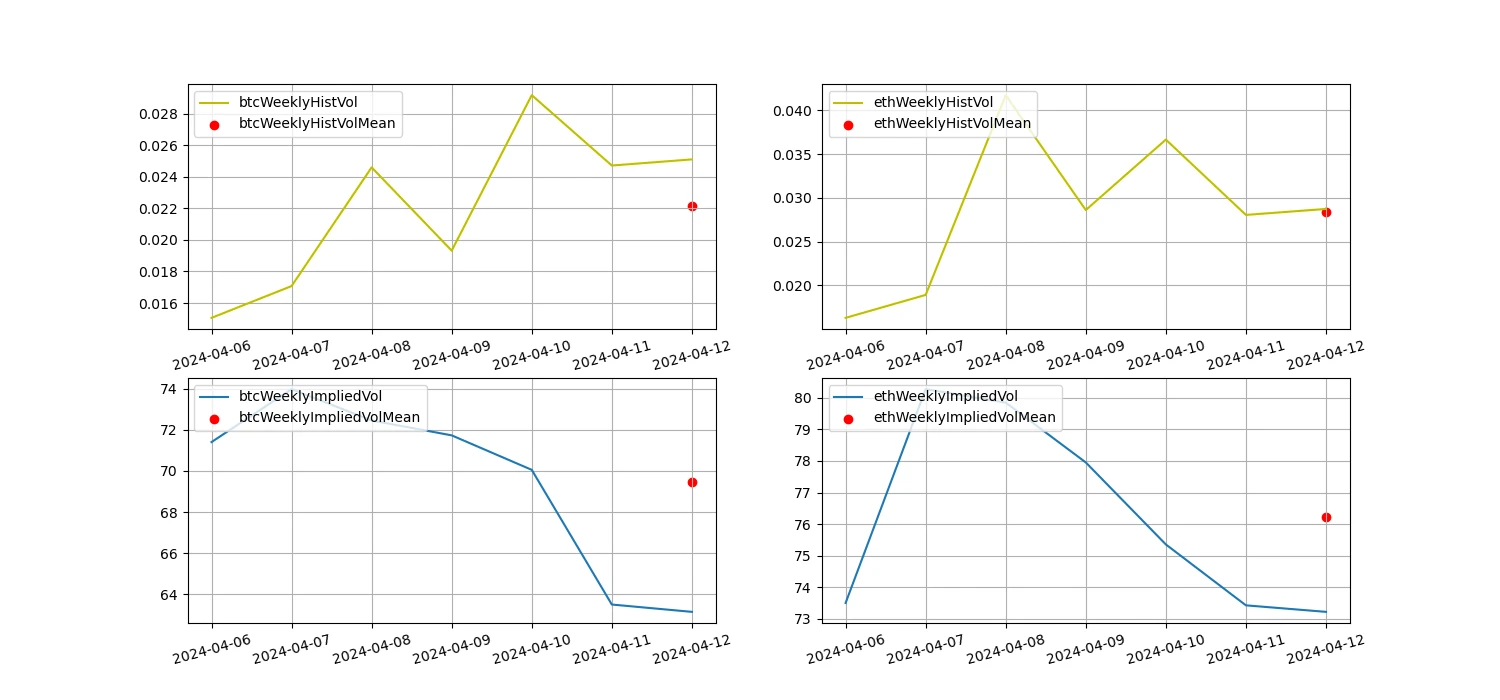
The yellow line is historical volatility, the blue line is implied volatility, and the red dot is its 7-day average
event driven
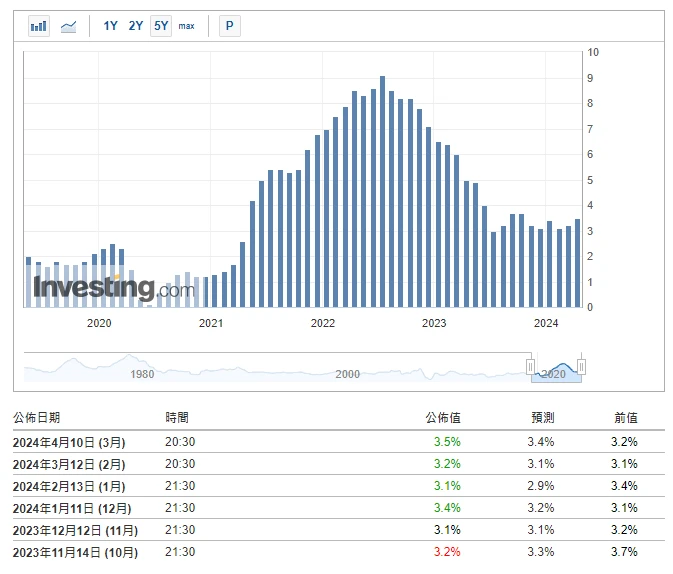
Data Sources:https://hk.investing.com/economic-calendar/cpi-733
This week on 2024.04.10 20:30 (Beijing time), the CPI value was 3.5%, which was higher than the expected 3.4%. After the data was released, Bitcoin fell slightly, hitting a new low in the short term and then rebounded to a maximum of around US$71,500. The price was higher at US$68,000. The large trading volume changes hands and forms a support level at this position in the short term. The price is currently above the support. We need to continue to observe whether the market has sufficient upward momentum.
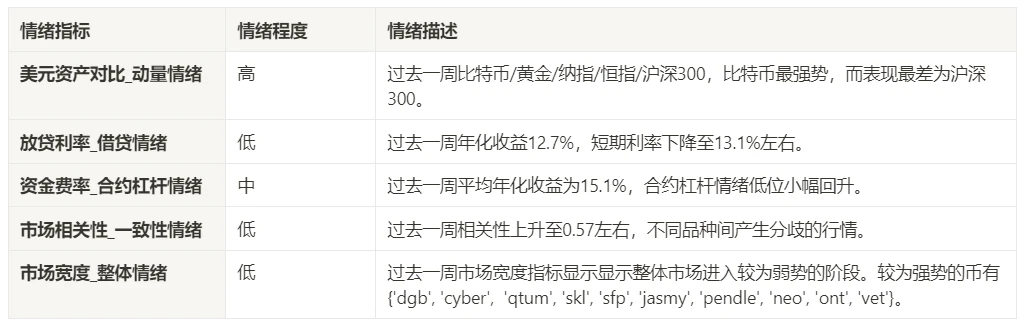
sentiment indicator
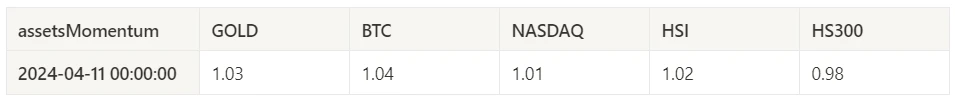
momentum sentiment
Among Bitcoin/Gold/Nasdaq/Hang Seng Index/CSI 300, Bitcoin was the strongest in the past week, while the worst performer was CSI 300.
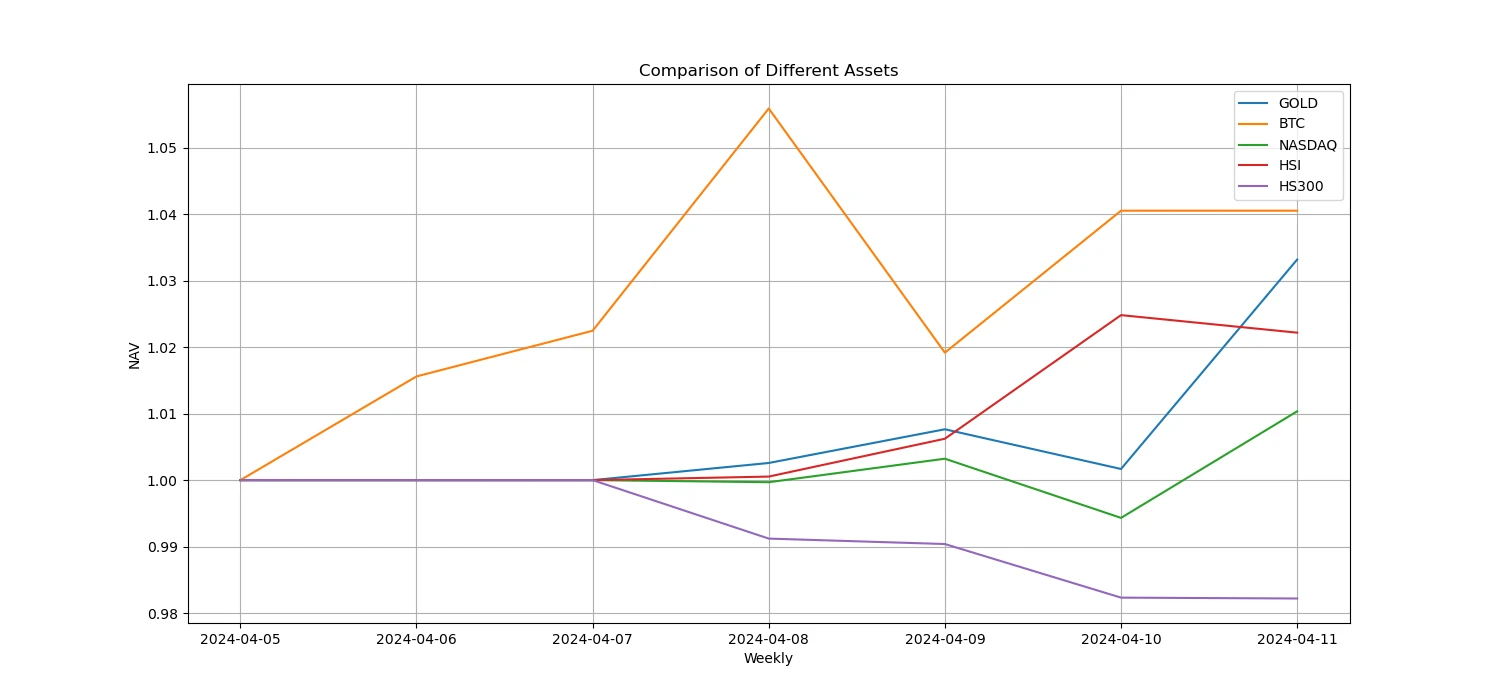
The picture above shows the trends of different assets over the past week.
Lending interest rate_Lending sentiment
The annualized return on USD lending averaged 12.7% over the past week, and short-term interest rates fell to around 13.1%.
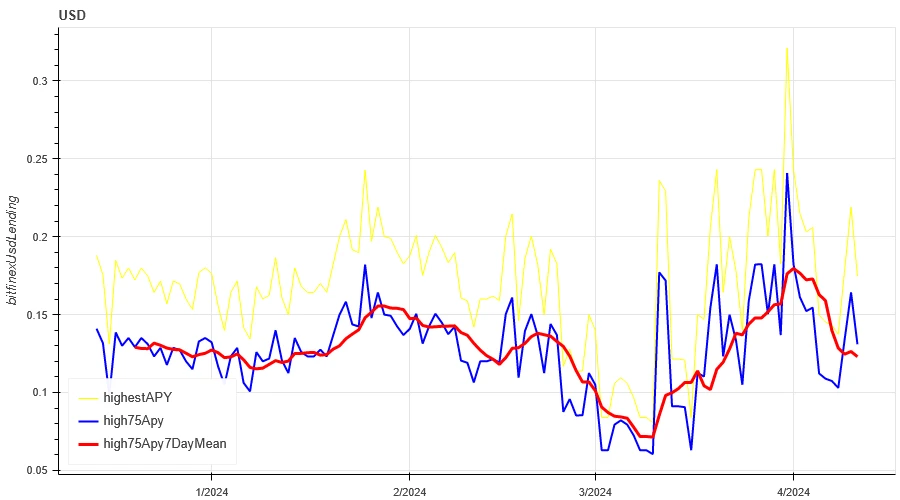
The yellow line is the highest price of the USD interest rate, the blue line is 75% of the highest price, and the red line is the 7-day average of 75% of the highest price
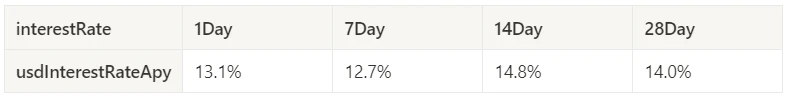
The table shows the average return of USD interest rate for different holding days in the past
Funding Rate_Contract Leverage Sentiment
The average annualized return on BTC tariffs in the past week was 15.1%, and contract leverage sentiment rebounded slightly from the low level.
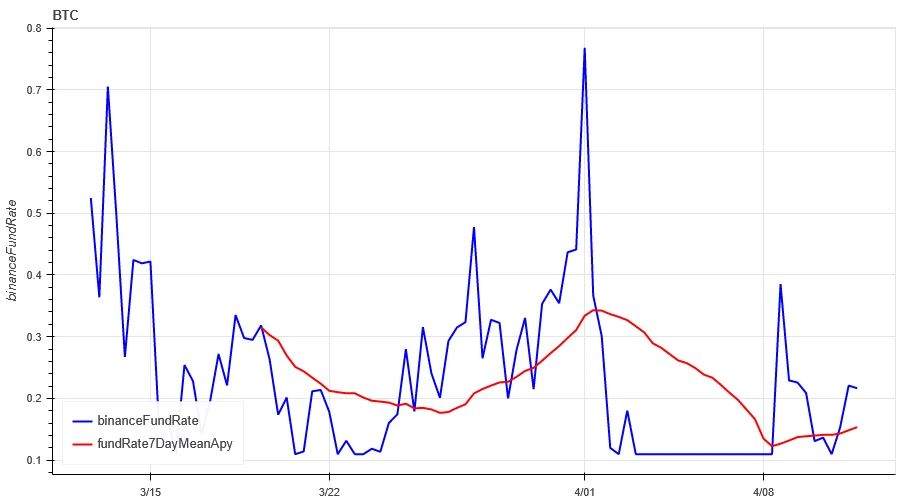
The blue line is the funding rate of BTC on Binance, and the red line is its 7-day average
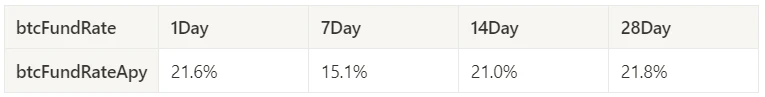
The table shows the average return of BTC fees for different holding days in the past
Market Correlation_Consistent Sentiment
The correlation among the 129 coins selected in the past week has increased to around 0.57, resulting in relatively divergent prices among different varieties.
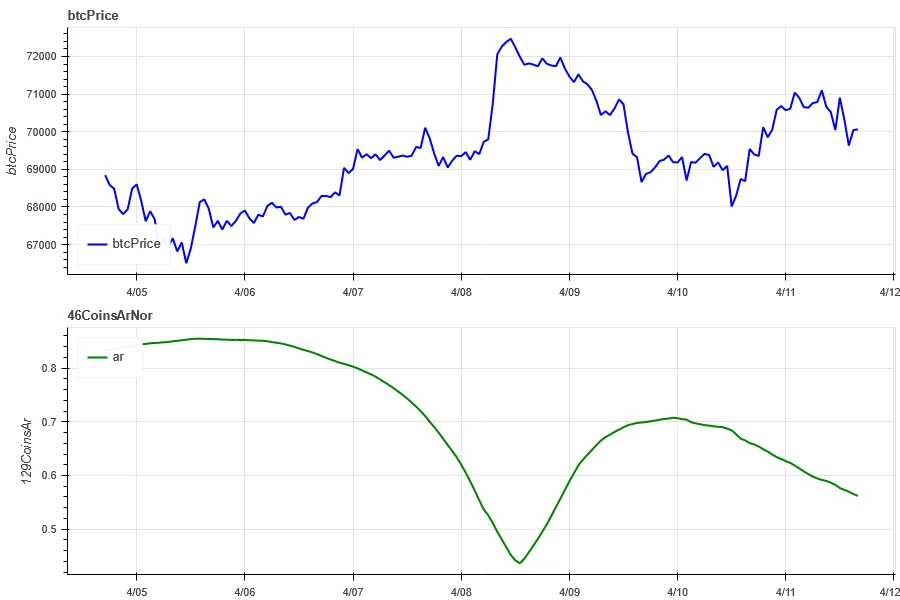
The blue line in the above picture first shows the Bitcoin price, and the green line is [1000 floki, 1000 lunc, 1000 pepe, 1000 shib, 100 0x ec, 1inch, aave, ada , agix, algo, ankr, ant, ape, apt, arb, ar, astr, atom, audio, avax, axs, bal, band, bat, bch, bigtime, blur, bnb, btc, celo, cfx, chz, ckb , comp, crv, cvx, cyber, dash, dgb, doge, dot, dydx, egld, enj, ens, eos,etc, eth, fet, fil, flow, ftm, fxs, gala, gmt, gmx, grt, hbar , hot, icp, icx, imx, inj, iost, iotx, jasmy, kava, klay, ksm, ldo, link, loom, lpt, lqty, lrc, ltc, luna 2, magic, mana, matic, meme, mina, mkr, near, neo, ocean, one, ont, op, pendle, qnt, qtum, rndr, rose, rune , rvn, sand, sei, sfp, skl, snx, sol, ssv, stg, storj, stx, sui, sushi, sxp, theta, tia, trx, t, uma, uni, vet, waves, wld, woo, xem , xlm, xmr, xrp, xtz, yfi, zec, zen, zil, zrx] overall correlation
Market Breadth_Overall Sentiment
Of the 129 coins selected in the past week, 25.6% had prices above the 30-day moving average, compared with 18.6% of BTC prices above the 30-day moving average, and 16.2% had prices greater than 20% from the lowest price in the past 30 days. , the proportion that is less than 10% from the highest price in the past 30 days is 11.6%. The market width indicator in the past week shows that the overall market of small coins is still in a relatively weak stage.
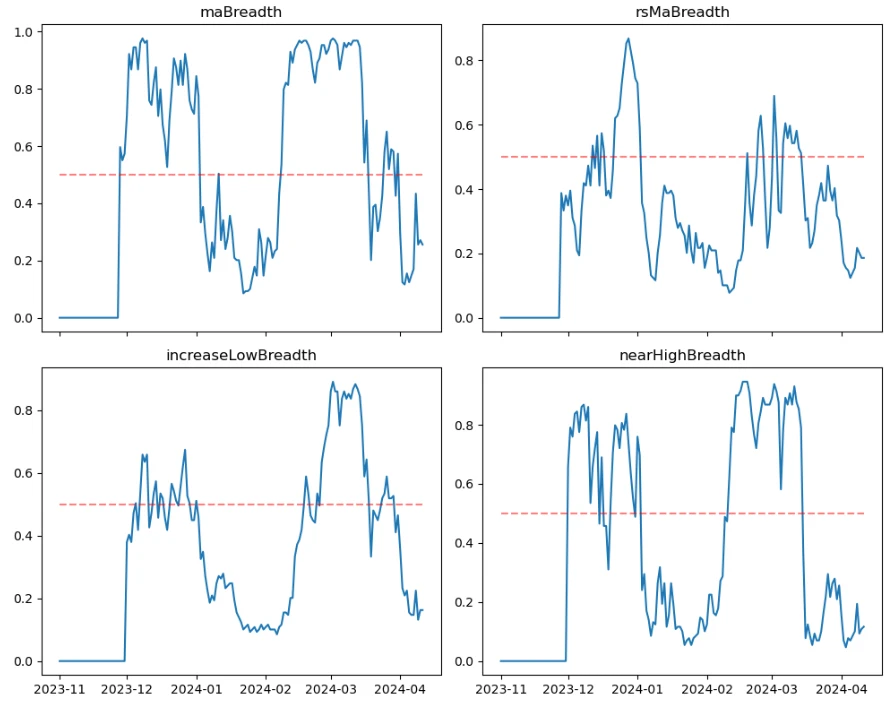
The picture above is [1000 floki, 1000 lunc, 1000 pepe, 1000 shib, 100 0x ec, 1inch, aave, ada, agix, algo, ankr, ant, ape, apt, arb, ar, astr, atom, audio, avax, axs, bal, band , bat, bch, bigtime, blur, bnb, btc, celo, cfx, chz, ckb, comp, crv, cvx, cyber, dash, dgb, doge, dot, dydx, egld, enj, ens, eos,etc, eth , fet, fil, flow, ftm, fxs, gala, gmt, gmx, grt, hbar, hot, icp, icx, imx, inj, iost, iotx, jasmy, kava, klay, ksm, ldo, link, loom, lpt , lqty, lrc, ltc, luna 2, magic, mana, matic, meme, mina, mkr, near, neo , ocean, one, ont, op, pendle, qnt, qtum, rndr, rose, rune, rvn, sand, sei, sfp, skl, snx, sol, ssv, stg, storj, stx, sui, sushi, sxp, theta , tia, trx, t, uma, uni, vet, waves, wld, woo, xem, xlm, xmr, xrp, xtz, yfi, zec, zen, zil, zrx] The proportion of each width indicator on the 30th day

Summarize
In the past weeks market conditions, the prices of Bitcoin (BTC) and Ethereum (ETH) both fell back after rising on 4.8. The historical volatility and trading volume were both larger when the 4.8 rose and the CPI was announced, and the open interest changed. Not big. Implied volatility for BTC and ETH is down from the start of the week. In addition, funding rates rebounded slightly from low levels, indicating that contract trading sentiment is gradually recovering. The market breadth indicator shows that the overall small currency market is still in a weak stage. In terms of events, after the release of CPI data on 4.10, the prices of mainstream currencies fell to a new short-term low and then rebounded. Bitcoin will be halved in the next week, and investors can pay close attention to the halving investment opportunities.
Twitter: @DerivativesCN
Website: https://dcbot.ai/


