


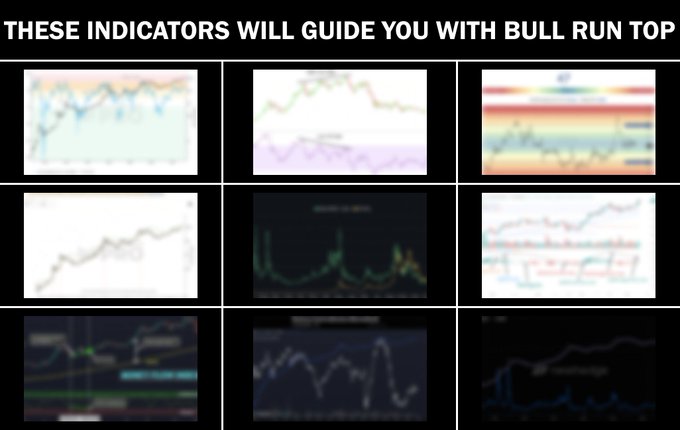
How to accurately predict the peak of the bull market? You must master these 9 key indicators!
It’s almost impossible to accurately predict the peak of the crypto market bull run, but you can use these data indicators to determine whether the market is close to the top.
If all five signs appear at the same time, then you have either accumulated enough wealth or you can only go back to work at McDonalds...
Now, let us uncover the secret of the end of the bull market.
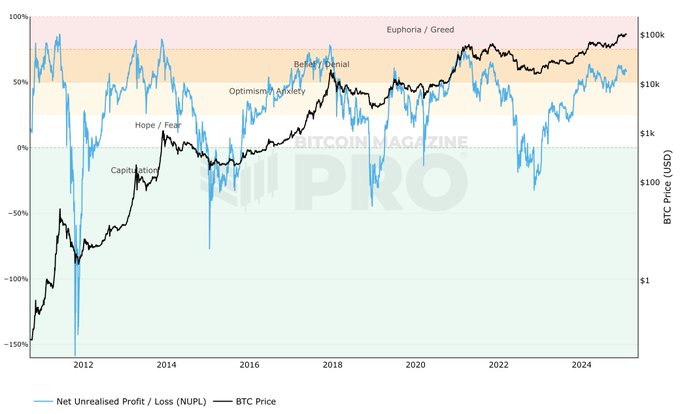
1. NUPL (Unrealized Net Profit/Loss)
Market Sentiment Indicators
When NUPL enters the mania/greed zone (over 75%), it usually means that the market is close to a top and investors are becoming overly optimistic.
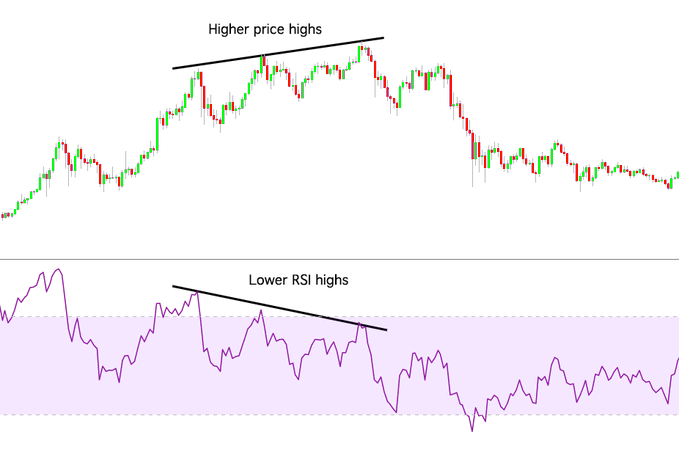
2. RSI (Relative Strength Index)
Short-term overbought signal
When the RSI exceeds 90, the market is usually in an extremely overbought state, and historical data shows that highs are usually formed within 4-7 weeks, followed by a pullback.
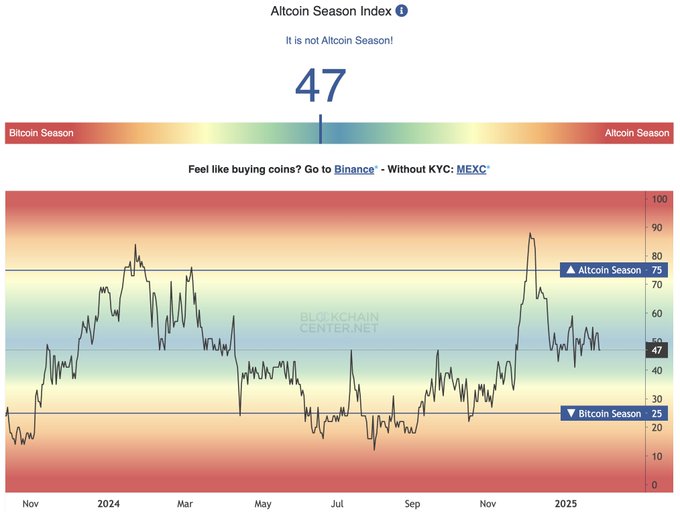
3. Altcoin Season Index
Altcoins vs Bitcoin
When the index exceeds 85, it means that altcoins as a whole are outperforming Bitcoin, which is usually a sign that the market has entered a frenzy phase.
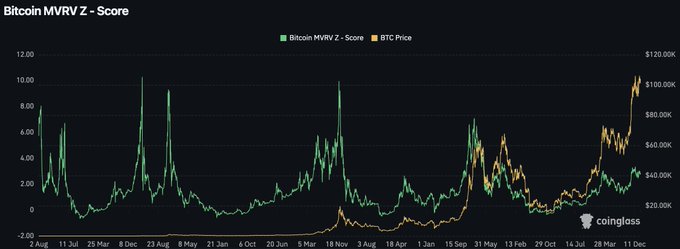
4. MVRV Z-Score (Market Value vs Actual Value)
Determining whether the market is extremely overvalued
When the MVRV Z-Score exceeds 6, it indicates that the market may be close to the top and we need to be alert to the potential risk of a pullback.
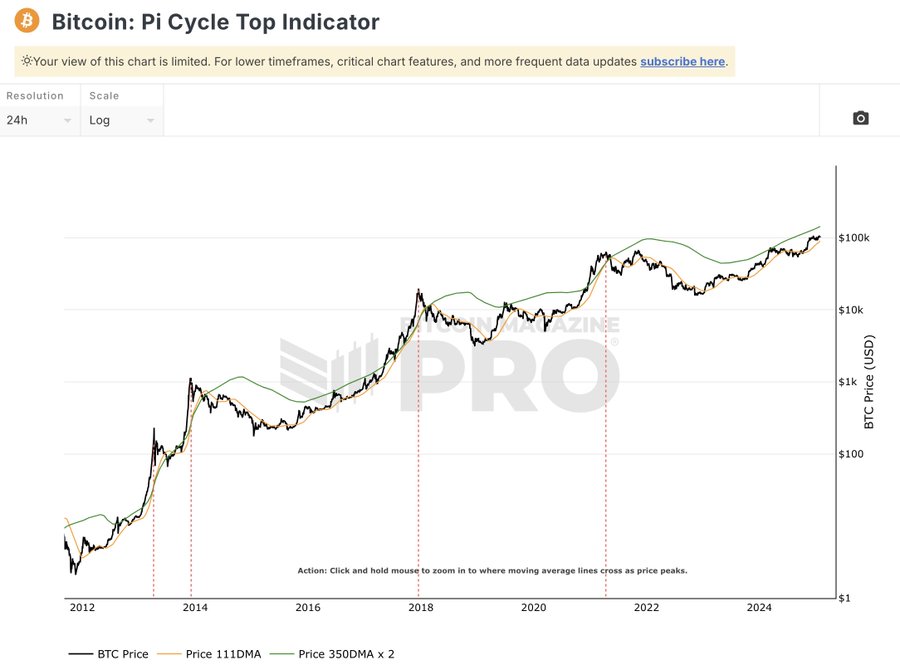
5. Pi Cycle Top Indicator
Accurately Identify the Peak of Bitcoin Bull Market
This indicator has successfully predicted major price highs for Bitcoin over multiple cycles.
When it sends out warning signals, it means the bull market is about to peak.
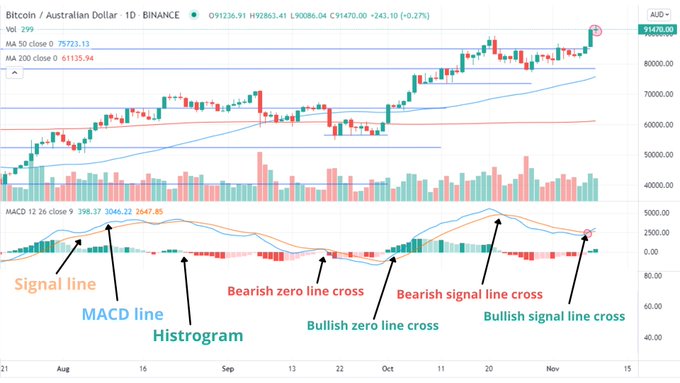
6. MACD (Moving Average Convergence Divergence)
Trend Change and Momentum Signals
When MACD forms a death cross, it means that market momentum is weakening and the trend may reverse.
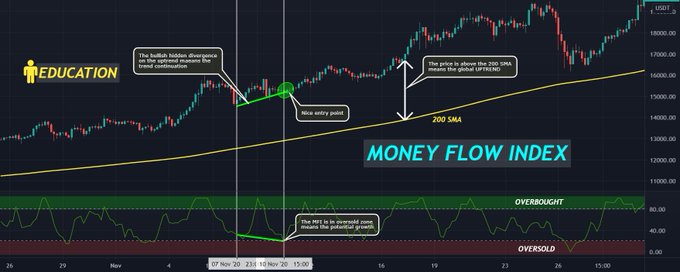
7. MFI (Money Flow Index)
Buying and selling pressure monitoring
Similar to the RSI, but the MFI incorporates volume data and when it shows extreme overbought conditions, it often signals a market top.
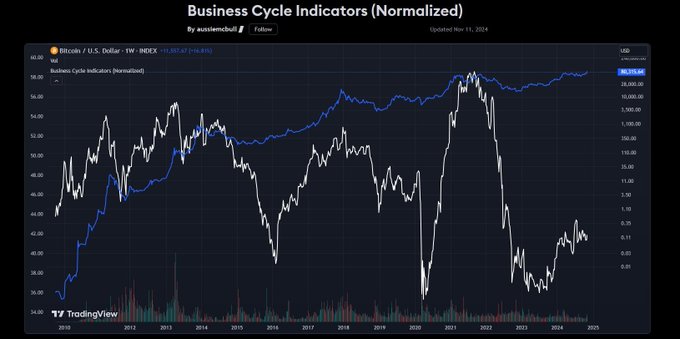
8. Composite Business Cycle Index
Macroeconomic impact
When the index exceeds 50, it indicates that the market may be about to enter a peak phase.
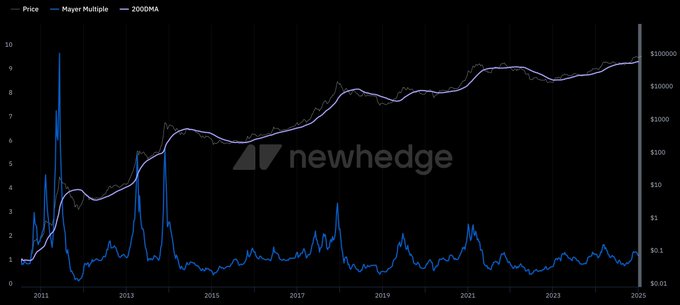
9. Mayer Multiple
Price vs 200 Day Moving Average
Historical data shows that when the Mayer Multiple reaches 2.4, Bitcoin is usually at the peak of a bull market.
in conclusion
Although it is difficult to accurately predict the market peak, these 9 indicators can help you evaluate the market position more scientifically. The bull market frenzy can make you a lot of money, but if there is no clear exit strategy, it may also make you return to the pre-liberation era overnight.


