


4 Alpha Key Views of the Week
Market Overview
1. Abnormal market signals
A triple kill of stocks, bonds and currencies: U.S. stocks fluctuated violently (SP +5%), U.S. Treasury yields soared (10-year to 4.47%), and the U.S. dollar index fell below 100.
Safe-haven assets diverged: gold soared (breaking through $3,200/ounce), the yen/Swiss franc strengthened, and the traditional safe-haven status of the dollar was shaken.
2. Contradictory economic data
Early signs of stagflation: CPI declines (gasoline price cuts) but core inflation (housing + food) remains stubborn; PPI is -0.4% month-on-month (demand shrinkage + cost rigidity).
The impact of tariffs has not yet been revealed: current data does not reflect the impact of new tariffs, and market pessimistic expectations are ahead.
3. Liquidity crisis emerges
The selling spiral of U.S. Treasuries: long-term bonds plummet → collateral value shrinks → hedge funds are forced to sell → yields rise further.
Repo market pressure: The widening spread between BGCR and SOFR reflects a sharp increase in collateral financing costs and intensified liquidity stratification.
4. Policies and external risks
Trumps tariff game: Tariffs on China rise to 145%, China retaliates to 125%, the trade war has eased partially but long-term risks have not been eliminated.
U.S. Treasury refinancing cliff: Nearly $9 trillion of debt will mature in 2025, and if foreign holders sell off, liquidity pressure will increase.
Outlook for next week
1. The market turns to defensive logic
Doubts about the credit of the US dollar: Funds shift to non-US safe-haven assets (gold, Japanese yen, Swiss franc).
Stagflation trading dominates: long-term US Treasuries and highly leveraged equity assets face sell-off risks.
2. Key monitoring indicators
U.S. Treasury liquidity (whether the 10-year yield breaks through 5%), changes in Chinas bond holdings, exchange rate intervention by the Bank of Japan, and high-yield bond spreads.
Money is fleeing the U.S.? What signal does the bond sell-off give?
1. Macroeconomic Review of This Week
1. Market Overview
As the storm after the implementation of the reciprocal tariffs swept the financial market, the Trump administration was forced to make some concessions. All countries except China were granted a 90-day suspension period, but the trade confrontation with the United States has not stopped. As our risk warning in last weeks weekly report, under the impact of a series of trade news, policy changes this week once again pushed the market to fluctuate violently. At present, except for China, all tariff rates have been reduced to 10%, and the US tariff rate on China has been raised to 145%. In response, China has raised its tariffs on US imports to 125%.
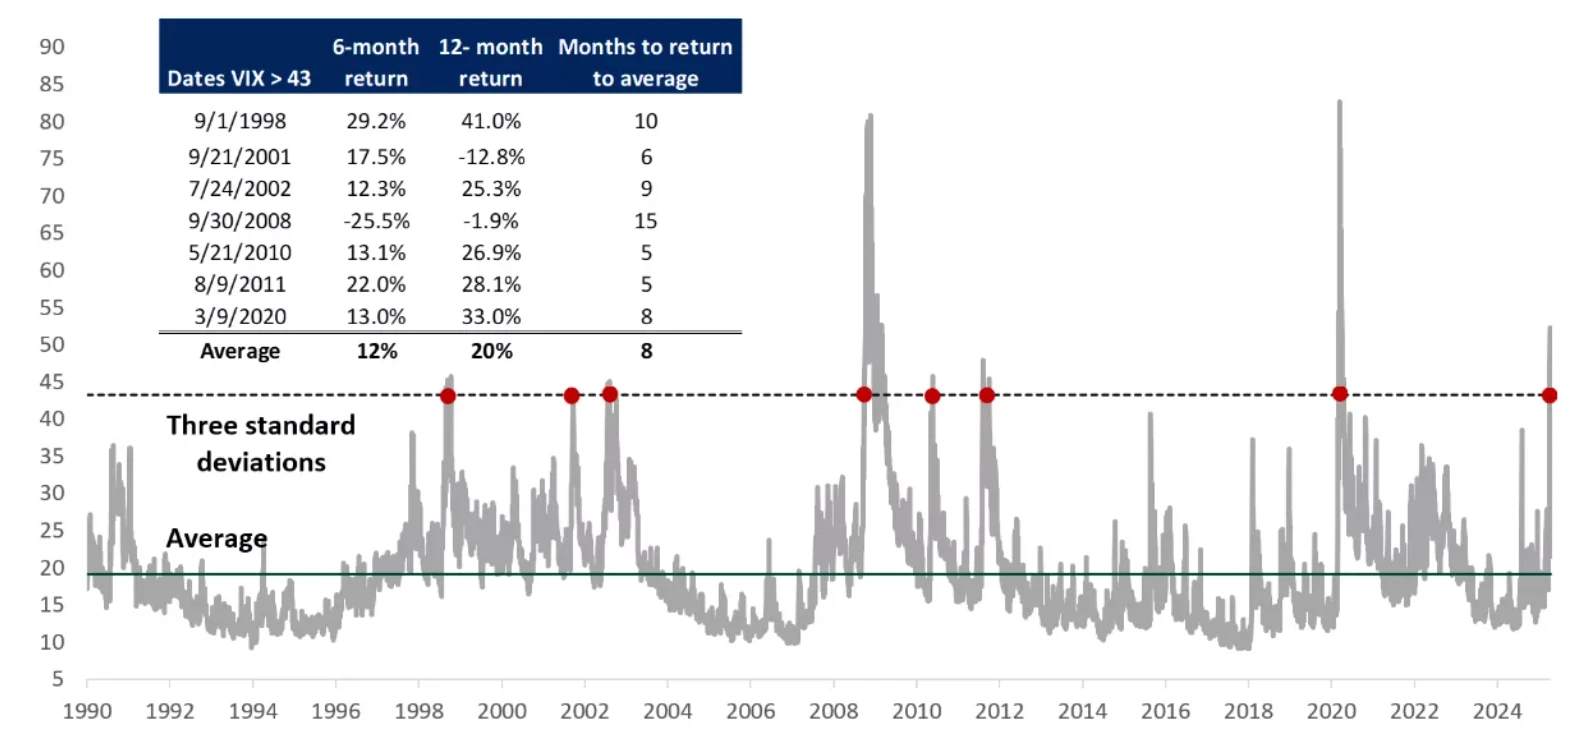
U.S. stocks: The SP 500 index rose 5% this week, but the volatility was very sharp during the period; the Dow Jones Industrial Average and the Nasdaq Composite Index also recorded increases of more than 5%.
Safe-haven assets: 10-year Treasury bonds continued to fall sharply, with yields rising to a high of 4.47%. The sell-off of long-term bonds continued. At the same time, the US dollar index fell below the 100 mark, which was rare. A triple kill of stocks, bonds and currencies was formed. On the contrary, spot gold continued to break new highs to more than $3,200 per ounce, with a weekly increase of more than 5%.
Commodities: As the escalation of the tariff war triggered expectations of trade contraction and suppressed crude oil demand, Brent crude oil continued to weaken, falling 5.5% during the week to $62 per barrel; copper prices also fell sharply by 13% this week, hitting a recent low.
Cryptocurrency: After a brief divergence from the U.S. stock market last week, Bitcoin resumed its resonance with the U.S. stock market this week, and the price of Bitcoin continued to be suppressed below $85,000.
Chart: Historical volatility and return performance of US stocks
Source: Bloomberg
2. Economic data analysis
Continue to focus on Trump’s tariffs and CPI data this week.
2.1 Analysis of Trump’s Tariffs
The Trump administration this week made some concessions on tariffs compared to the reciprocal tariffs announced last week.
The basic customs duty rate is adjusted to 10%
Specific tariffs on China increased to 145%, while China also increased its tariffs on the United States to 125%.
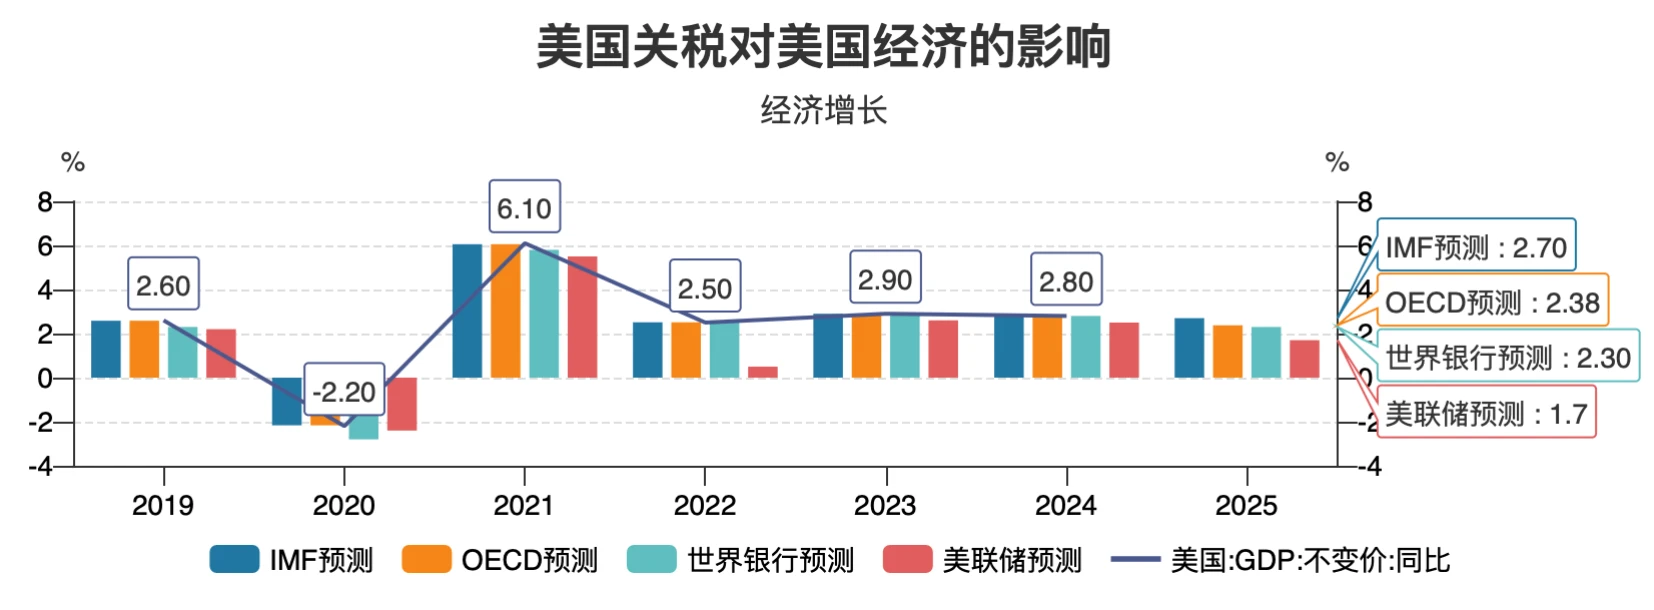
From this weeks observation, after the announcement of tariffs, there was a global reaction. Some countries chose to take countermeasures, such as China and Europe. Some countries chose to negotiate, such as Japan, South Korea and Vietnam. However, as China is the country with the largest trade deficit with the United States, the escalation of the trade war between the two countries still caused shocks in the global financial market. When the stock market, bond market and foreign exchange market fell sharply and approached a bear market, the US government made concessions. This is consistent with our prediction last week that the tariff war around trade will further move towards easing, and the peak of trade policy uncertainty has passed.
Chart: Impact of tariffs on the US economy (forecasts by different institutions)
Source: Wind
2.2 CPI and PPI
This weeks CPI data unexpectedly fell, but considering that the data released this week did not include the impact of tariffs, the market reaction was even more pessimistic.
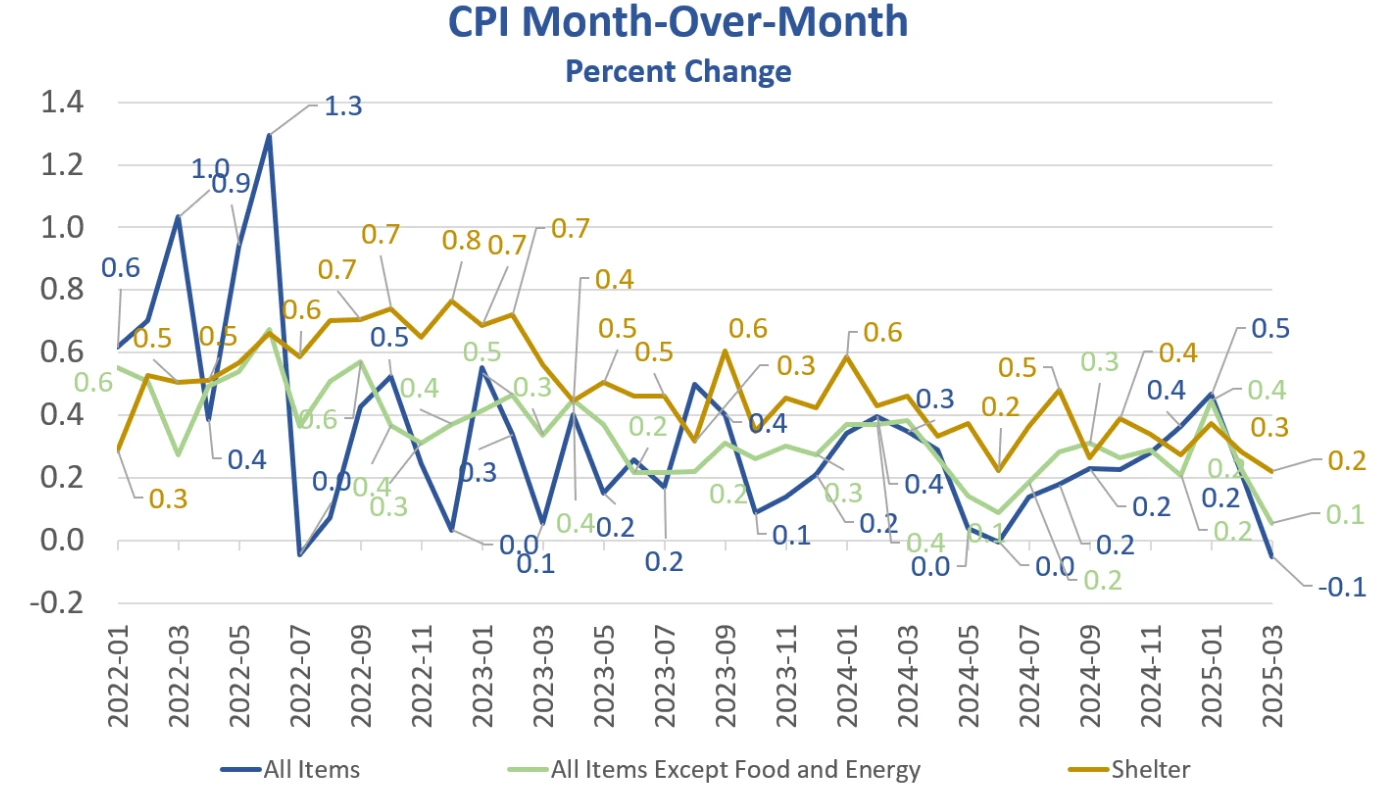
Chart: U.S. CPI month-on-month performance in March
Source: MishTalk
This data is the weakest since May 2020. From the data breakdown structure, it is mainly the decline in gasoline prices that improved the overall CPI situation. However, housing and food, as the largest rigid burdens on households, rose by 0.3% and 0.4% respectively. Looking at the core CPI, the price index of all commodities except food and energy rose by 0.1%, while the index rose by 0.2% in February; airline fares, motor vehicle insurance, used cars and trucks, and entertainment indexes were the main sub-items that fell in March.
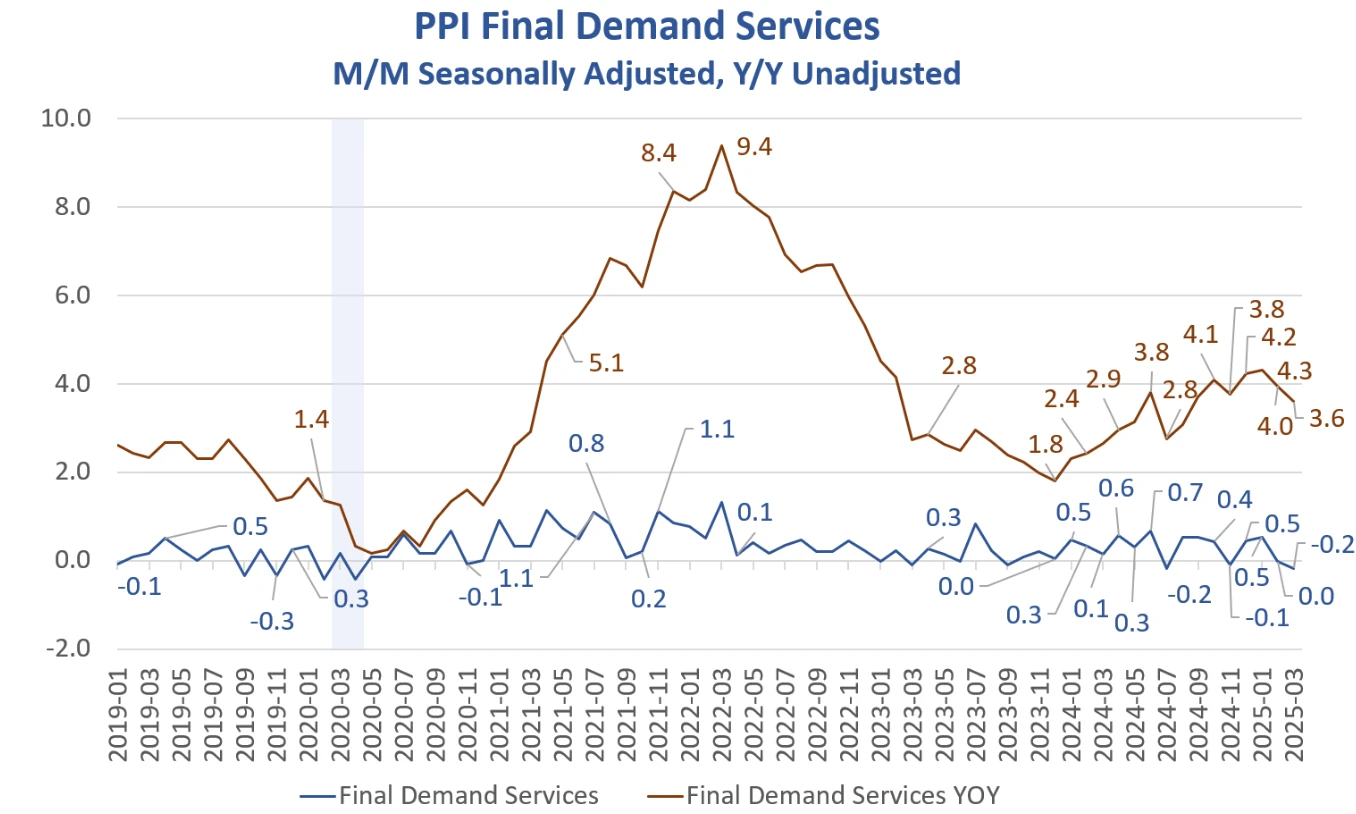
On Friday, the U.S. Department of Labor released PPI data. After seasonal adjustment, the PPI index fell by 0.4% month-on-month in March, which is also the lowest monthly month-on-month growth since the outbreak of the COVID-19 pandemic. From the perspective of sub-items, the main reason is also the decline in commodity prices; energy prices and food prices have fallen slightly, but core commodities after deducting energy are still rising, indicating that the pressure of tariff input costs has not been relaxed; in the service sector, demand-sensitive services such as transportation, warehousing, and wholesale have obviously shrunk, while rigid services are relatively stable.
Chart: U.S. PPI performance in March
Source: MishTalk
In short, the conclusion given by the PPI price signal is that cost pressure on the supply side still exists, but the marginal weakening trend on the demand side is still intensifying, initially showing early signs of stagflation.
It is basically clear from the CPI and PPI data released this week that under the impact of tariffs and pessimistic market expectations, the shrinking demand side and the rigid cost pressure on the supply side will, on the one hand, compress corporate profits and affect economic performance; on the other hand, it will hinder the smooth downward trend of inflation, and the risk of stagflation will gradually begin to emerge in the data.
3. Liquidity and interest rates
In terms of the Federal Reserves balance sheet, the Federal Reserves broad liquidity continued to rise marginally to 6.2 trillion this week, and has returned to positive year-on-year.
However, this weeks US dollar index and US bond market gave another bad signal.
Chart: Changes in U.S. overnight financing rates and Treasury yields
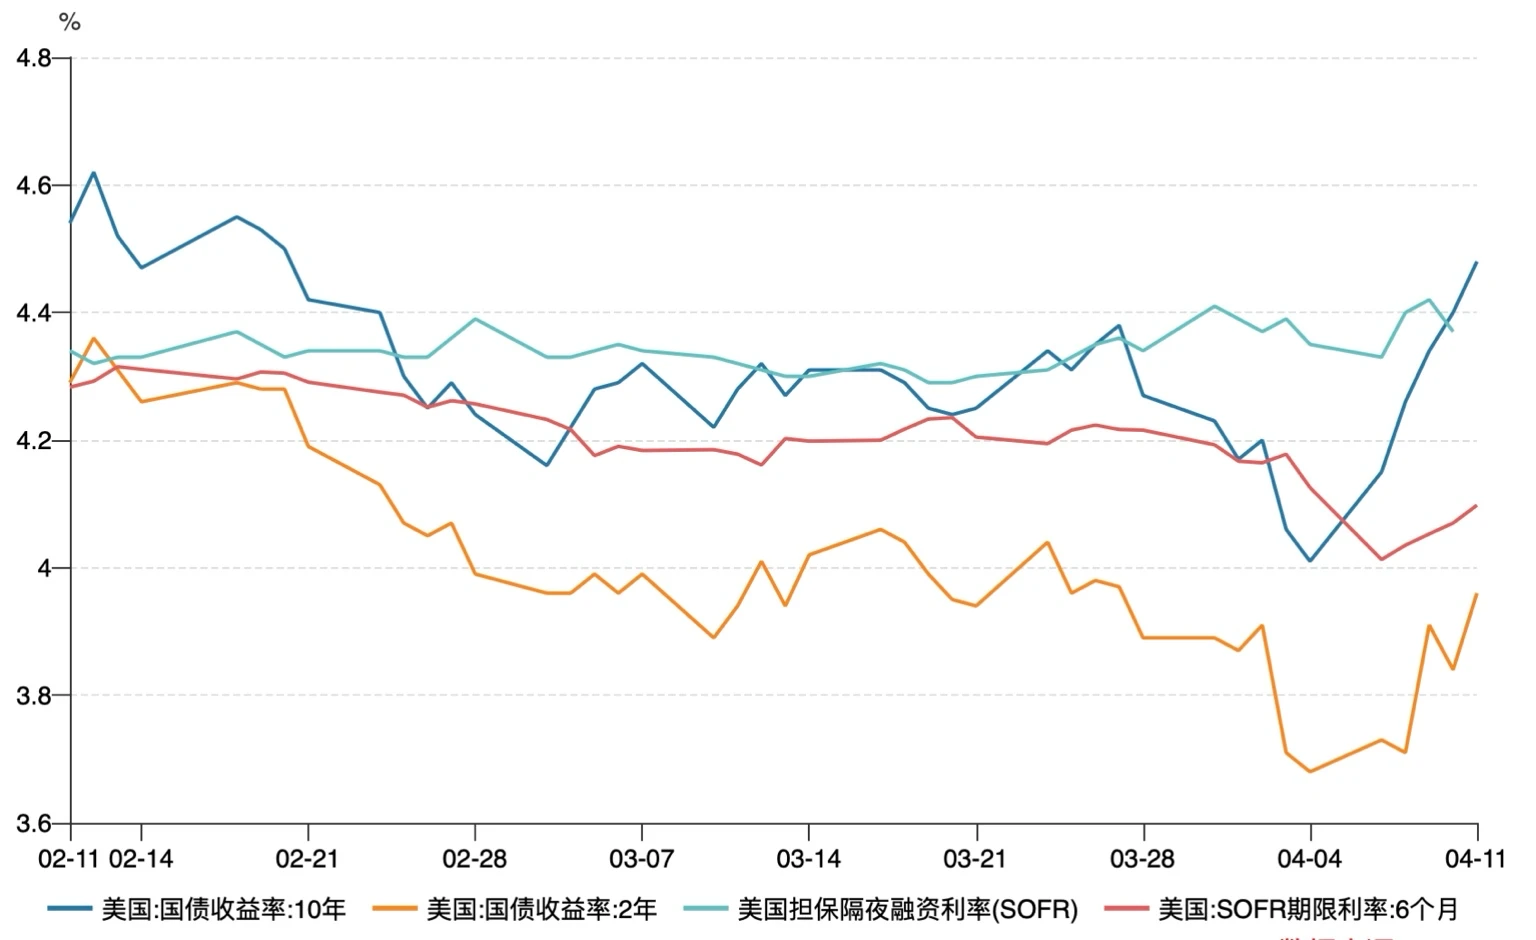
Source: Wind
As shown in the figure above:
1) The 10-year U.S. Treasury yield surged this week, indicating that the sell-off is still ongoing, and has risen to a high of around 4.45% overall.
2) SOFR term rates rebounded during the week, suggesting that the market is pricing in the Federal Reserve to continue tightening monetary policy rather than cutting interest rates as soon as possible.
At the same time, further analysis of the US dollar index shows that the surge in US Treasury yields was accompanied by a sharp drop in the US dollar index.
Chart: Changes in the US Dollar Index
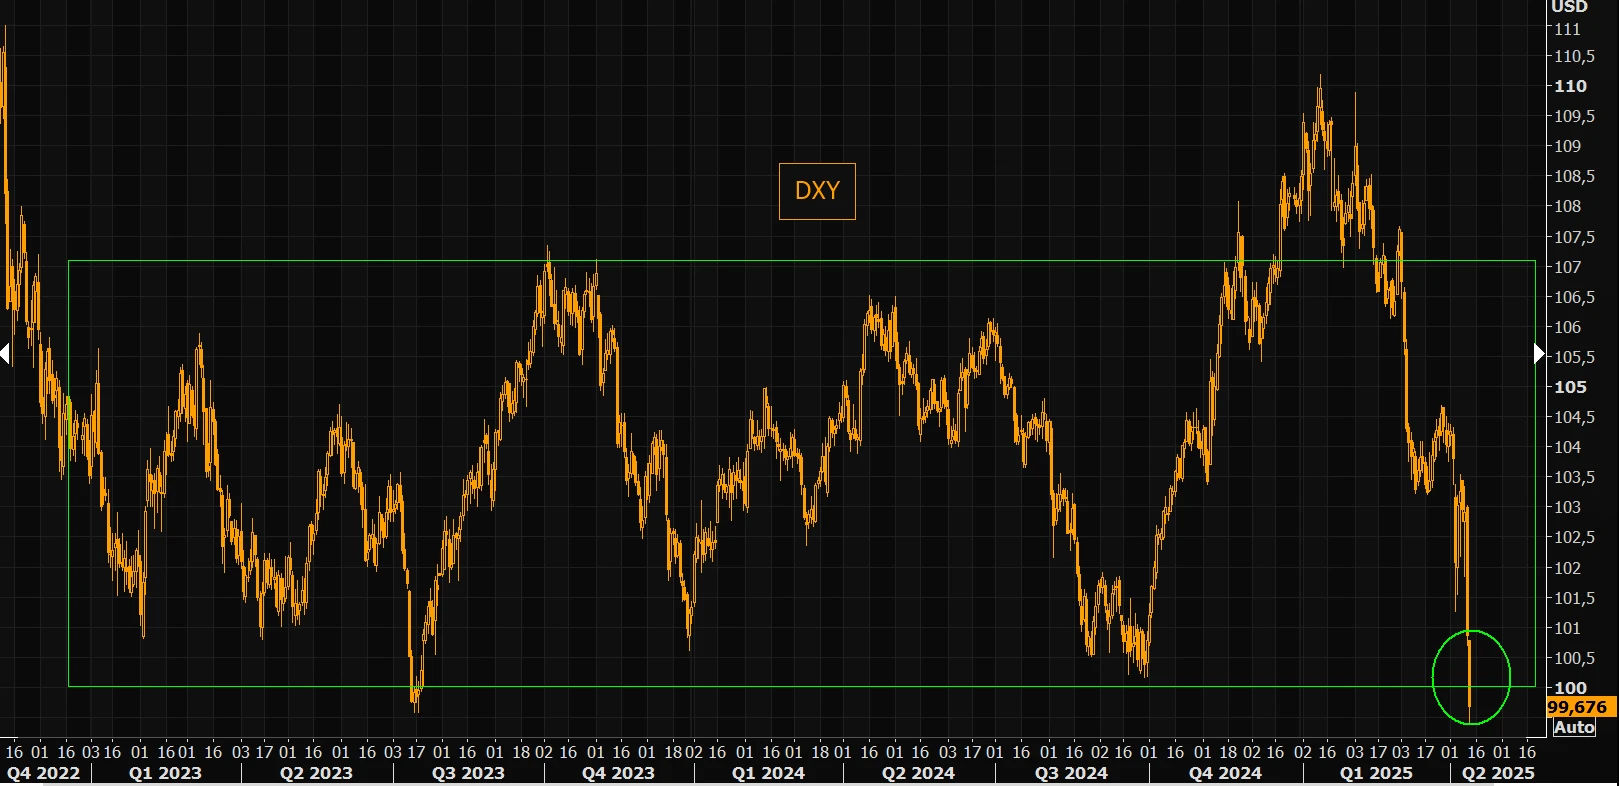
Source: ZeroHedge
The anomaly this week is that the plunge in crude oil and the decline in inflation data would have further suppressed the upward trend of US bond yields, but instead a triple kill of stocks, bonds and currencies occurred. The US dollar index even fell below the 100 mark, hitting a new low since July 2023, while traditional safe-haven currencies such as the Swiss franc and the Japanese yen strengthened simultaneously. Combining the data and further analyzing this anomaly, we can draw the following conclusions.
1) As we analyzed above, under the influence of the tariff increase, when the risk of stagflation initially emerged, the interest rate volatility index soared (Move Index), and the market priced the Fed higher for longer. Long-term Treasury yields (such as 10/30 years) rose rapidly, while swap rates were suppressed by expectations of economic recession, basis narrowed or even inverted, and overseas central banks sold off. The rapid decline in long-term bond prices triggered a decline in the value of Treasury bonds as collateral, and hedge funds were forced to sell Treasury bonds to cover their positions, forming a spiral of fall → sell → fall again.
Furthermore, we can clearly see from the BGCR, the financing interest rate of hedge fund leverage (see the figure below), that the difference between BGCR and SOFR increased significantly from mid-to-late March to early April, especially after March 22, when BGCR (blue line) fell significantly and SOFR (green line) remained relatively stable. This suggests that the market may have experienced some drastic liquidity changes or market sentiment fluctuations at this point in time, leading to increased pressure on basis trading and further triggering a series of liquidations.
Chart: Repo market interest rate and SOFR interest rate performance
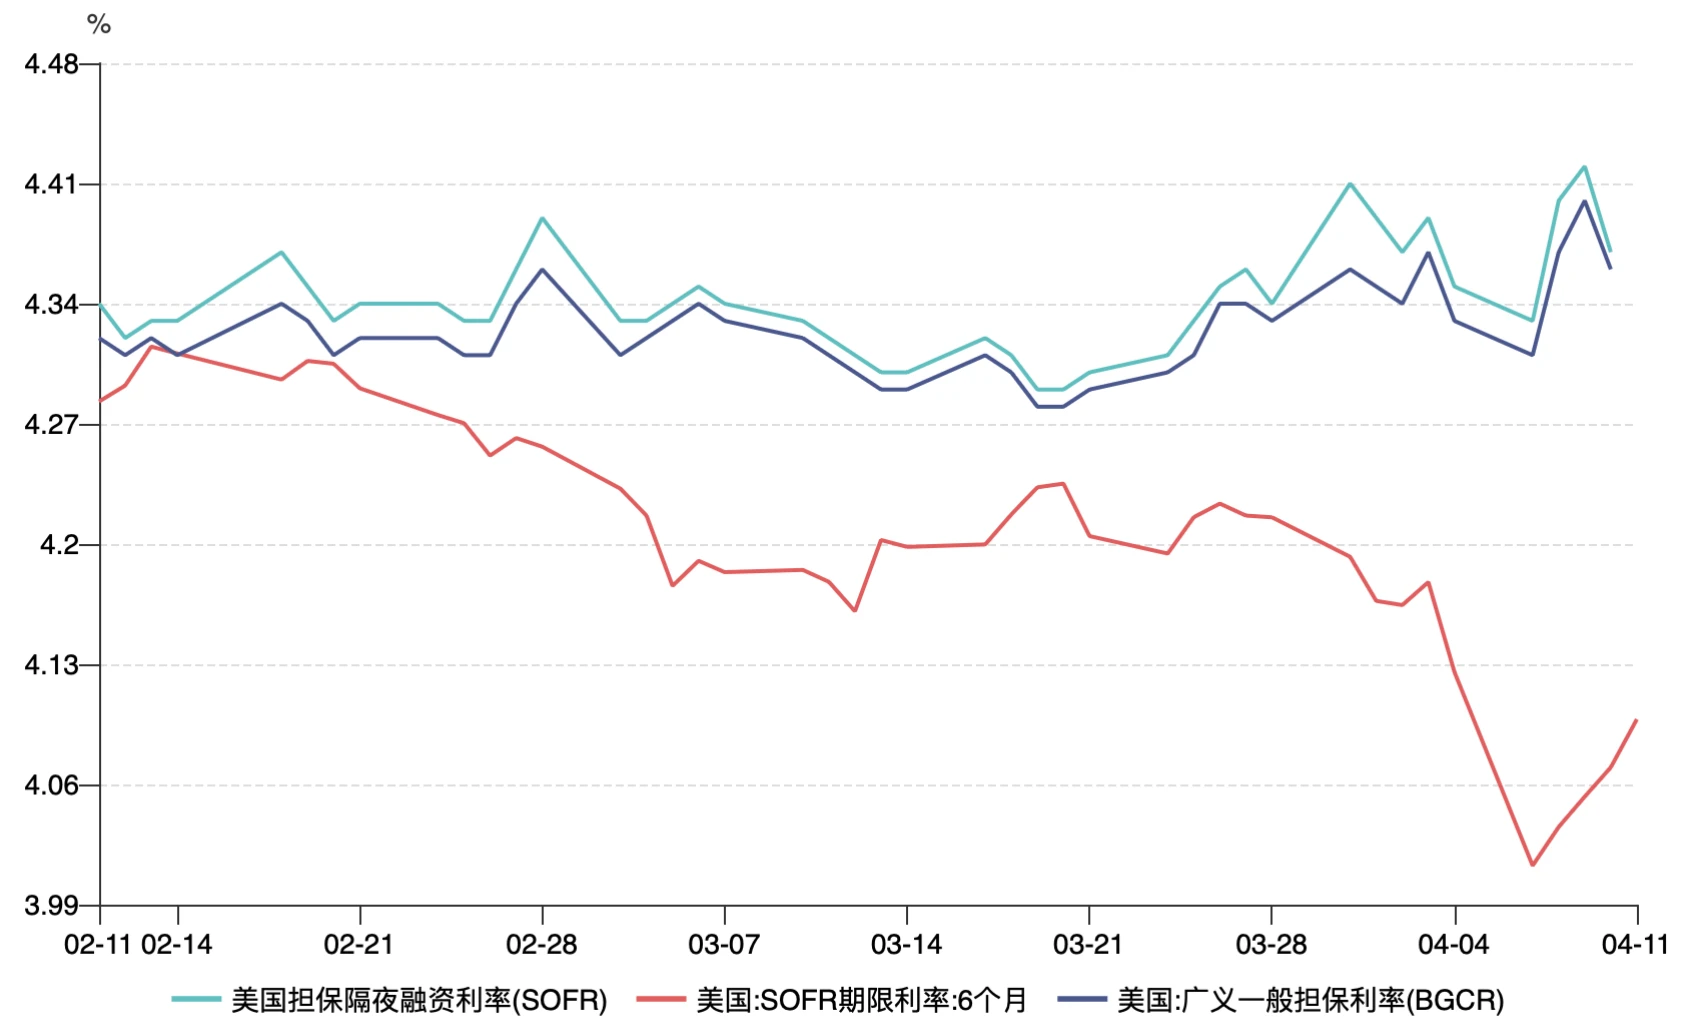
Source: Wind
2) The source of the decline of the US dollar index usually comes from the easing of US dollar liquidity; the US bond yield is expressed as the expected economic growth rate. However, the simultaneous decline of the US dollar index and US bond prices (the increase in yields) is not due to the significant easing of US dollar liquidity and the obvious improvement of economic growth, but during the decline of assets, funds left the United States to Japan and Europe for risk aversion (the exchange rates of the yen, euro and Swiss franc rose). In other words, the traditional logic of dollar risk aversion has failed.
3) The US debt in 2025 faces great refinancing pressure, with nearly 9 trillion US debt maturing, 6 trillion of which will mature in June. All these debts must be repaid through refinancing (borrowing new to repay old debts), and part of the meaning of Trump’s tariffs is to force other countries to buy US debt, which may be difficult to work under the current circumstances. This will cause foreign holders to sell US debt for risk aversion.
In fact, judging from the above three points, the current situation is clearly that the market has cast a vote of no confidence in the credit of the US dollar itself. The risk-averse migration of funds and the repricing of debt risks have led to a certain crisis in the liquidity of the entire US debt.
2. Macroeconomic Outlook for Next Week
The current market is shifting from inflation concerns to the dual impact of US dollar credit crisis + stagflation. The traditional negative correlation between stocks and bonds is gradually becoming ineffective. We need to pay attention to the following risks:
1) Under the pressure of tariffs, the risk of stagflation is initially emerging: Current economic data, including CPI and PPI, show that the US economy is facing the risk of stagflation. The coexistence of shrinking demand and rigid cost pressure on the supply side has compressed corporate profit margins and made it difficult for inflation to fall back quickly. Stagflation usually means the dilemma of slowing economic growth and continued inflation, which creates greater uncertainty for the long-term performance of the market.
2) Pressure on the bond market and tight US dollar liquidity : The 10-year US Treasury yield soared to around 4.45%, indicating that the bond market sell-off is still continuing, and the long-end bond prices have further declined, triggering the pressure of basis trading, especially for institutions such as hedge funds. This situation may lead to more debt sell-offs and chain reactions, forming a spiral effect of fall → sell-off → fall again, further increasing market instability.
3) U.S. debt refinancing pressure: The United States faces huge pressure to refinance U.S. debt, with about $9 trillion of debt due in the next few years, especially about $6 trillion due in June. How to repay these debts through refinancing will be a major challenge for the U.S. fiscal system. Trumps tariff policy may attempt to force other countries to buy U.S. debt, but in the current economic environment, it may be difficult to achieve the expected results, which may cause foreign holders to sell U.S. debt out of risk aversion, further exacerbating market risks.
Based on the above analysis, our overall view is:
The current trading benchmark is still mainly in defensive mode.
Further attention needs to be paid to the evolution of the stagflation pattern to assess whether economic growth will accelerate the recession or the inflation decline will be less than expected.
Continue to pay attention to the liquidity crisis of US Treasuries, especially whether the high-yield credit bond market will also be affected.
The weakness of the U.S. dollar may continue to affect global markets, especially in the context of globalized capital flows, and the strengthening of safe-haven currencies such as the Japanese yen and Swiss franc should be noted. Investors should consider how to adjust their allocation to U.S. dollar assets and pay attention to the dynamics of the foreign exchange market.
Cryptocurrency is mainly affected by the US dollar and currently does not have sufficient upward momentum. The current risk aversion logic is not very strong, so it is still recommended to maintain a neutral attitude in the short term.
We need to pay attention to the evolution of tariffs. If it slows down further, it may boost risk appetite. If the U.S. Treasury yield rises above 5%, it does not rule out the possibility that overseas holders will continue to sell and the Federal Reserve will intervene, triggering a deeper credit crisis.
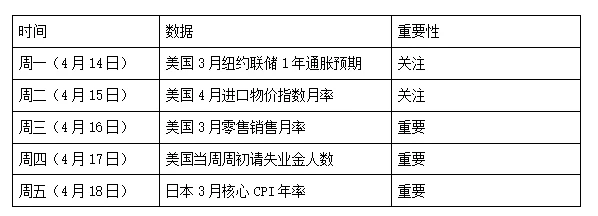
The key macro data for next week are as follows:
Disclaimer
This document is for internal reference only and is based on 4 Alpha Groups independent research, analysis and interpretation of available data. The information contained in this document is not investment advice and does not constitute an offer or invitation to buy, sell or subscribe for any financial instrument, security or investment product to residents of the Hong Kong Special Administrative Region, the United States, Singapore or other countries or regions where such offers are prohibited. Readers should conduct their own due diligence and seek professional advice before contacting us or making any investment decision.
This content is protected by copyright and may not be reproduced, distributed or transmitted in any form or by any means without the prior written consent of 4 Alpha Group. While we endeavour to ensure the accuracy and reliability of the information provided, we do not guarantee its completeness or currency and accept no liability for any loss or damage arising from reliance on this document.
By accessing this document, you acknowledge and agree to the terms of this Disclaimer.


