

AI Capital Flow Chart: Nvidia Takes $690 Billion, the Other 499 Split $340 Billion

Original author: Zhao Ying
Original source: Wallstreetcn
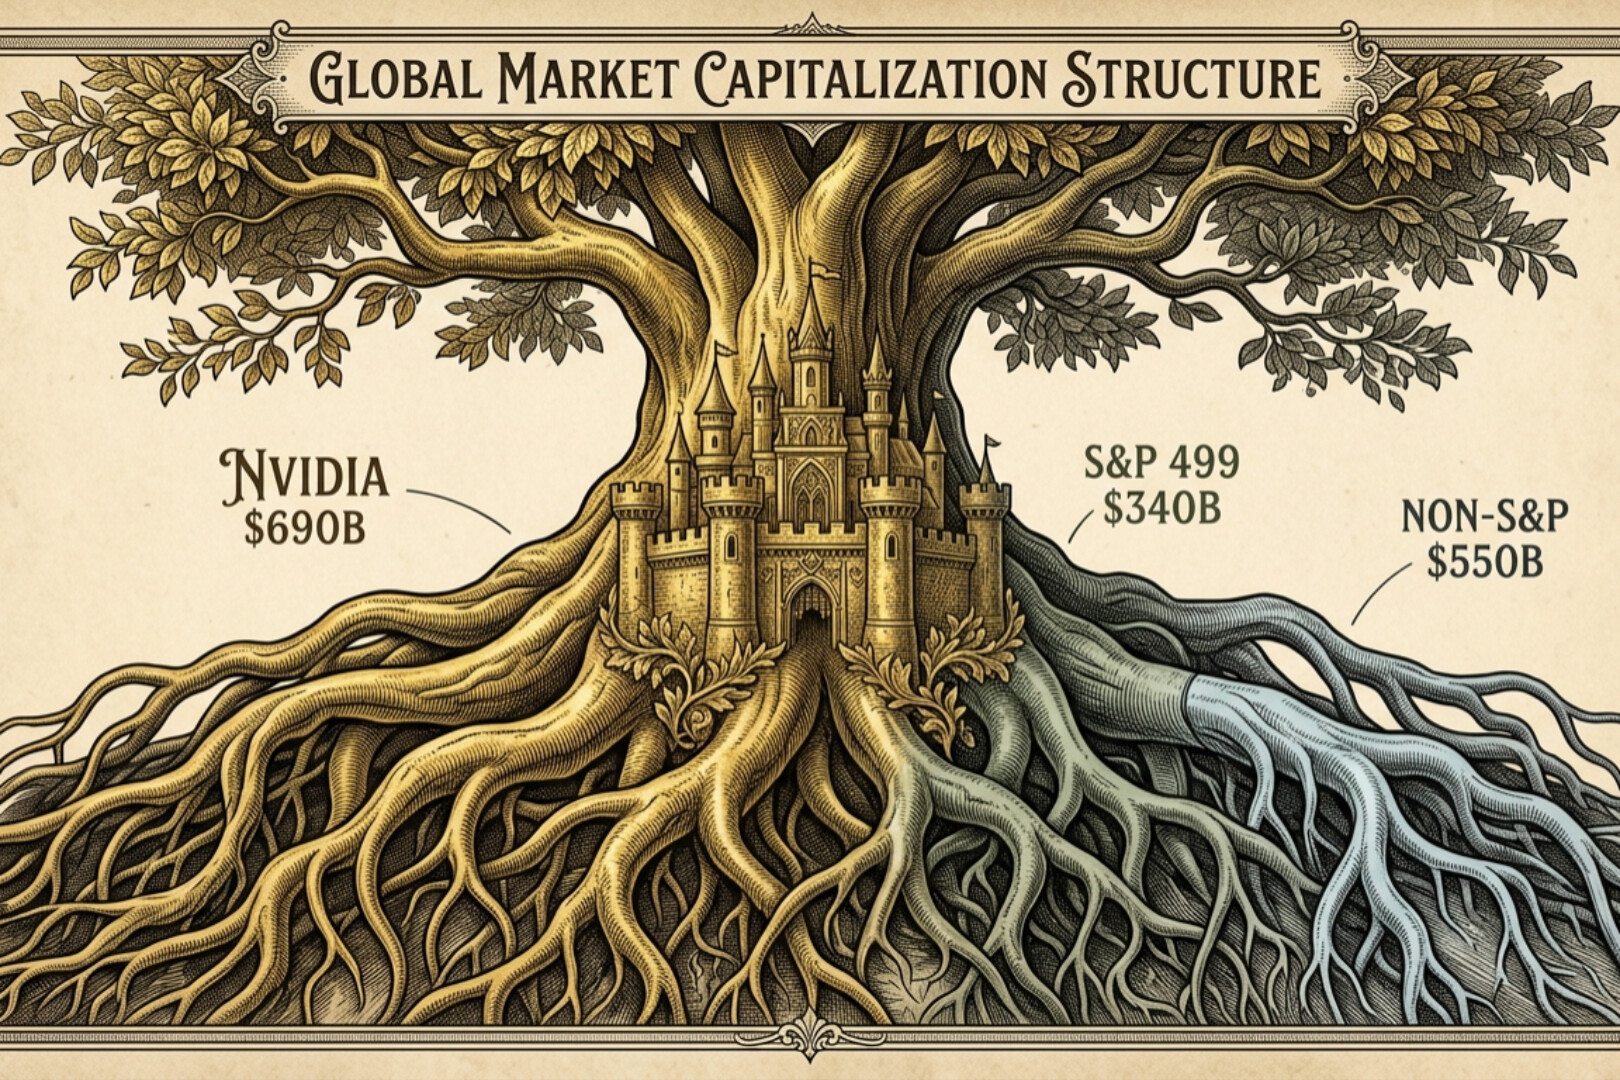
Morgan Stanley has for the first time mapped out the complete flow of AI capital expenditure in 2027, revealing a highly concentrated profit structure: of the $1.58 trillion in spending by hyperscalers, roughly two-thirds of the S&P 500 benefit amount flows to Nvidia alone, while the remaining 499 constituents share only about $339 billion combined.
Morgan Stanley strategists Nick Lentini, Mike Wilson, and more than twenty industry analysts jointly published the report "Tracking the $1.6 Trillion AI Money Flow: Mapping the Revenue Created by the Capex Boom," tracing hyperscaler capital expenditure line by line to specific companies' income statements for the first time. The report's core conclusion is: AI capital expenditure will directly drive approximately 25% of S&P 500 sales growth, and AI-related companies will contribute 78% of the index's earnings growth in 2027.
The report also reveals a long-overlooked hidden risk: hyperscalers have disclosed more than $1.1 trillion in lease commitments that have been signed but not yet commenced. This "synthetic capital expenditure" does not appear under the capex line of any cash flow statement, yet is economically equivalent to debt financing. Morgan Stanley credit strategists expect that 2027 will be the year with the largest free cash flow deficit for hyperscalers, when debt financing pressure will rise significantly.
A Panoramic Map of $1.6 Trillion
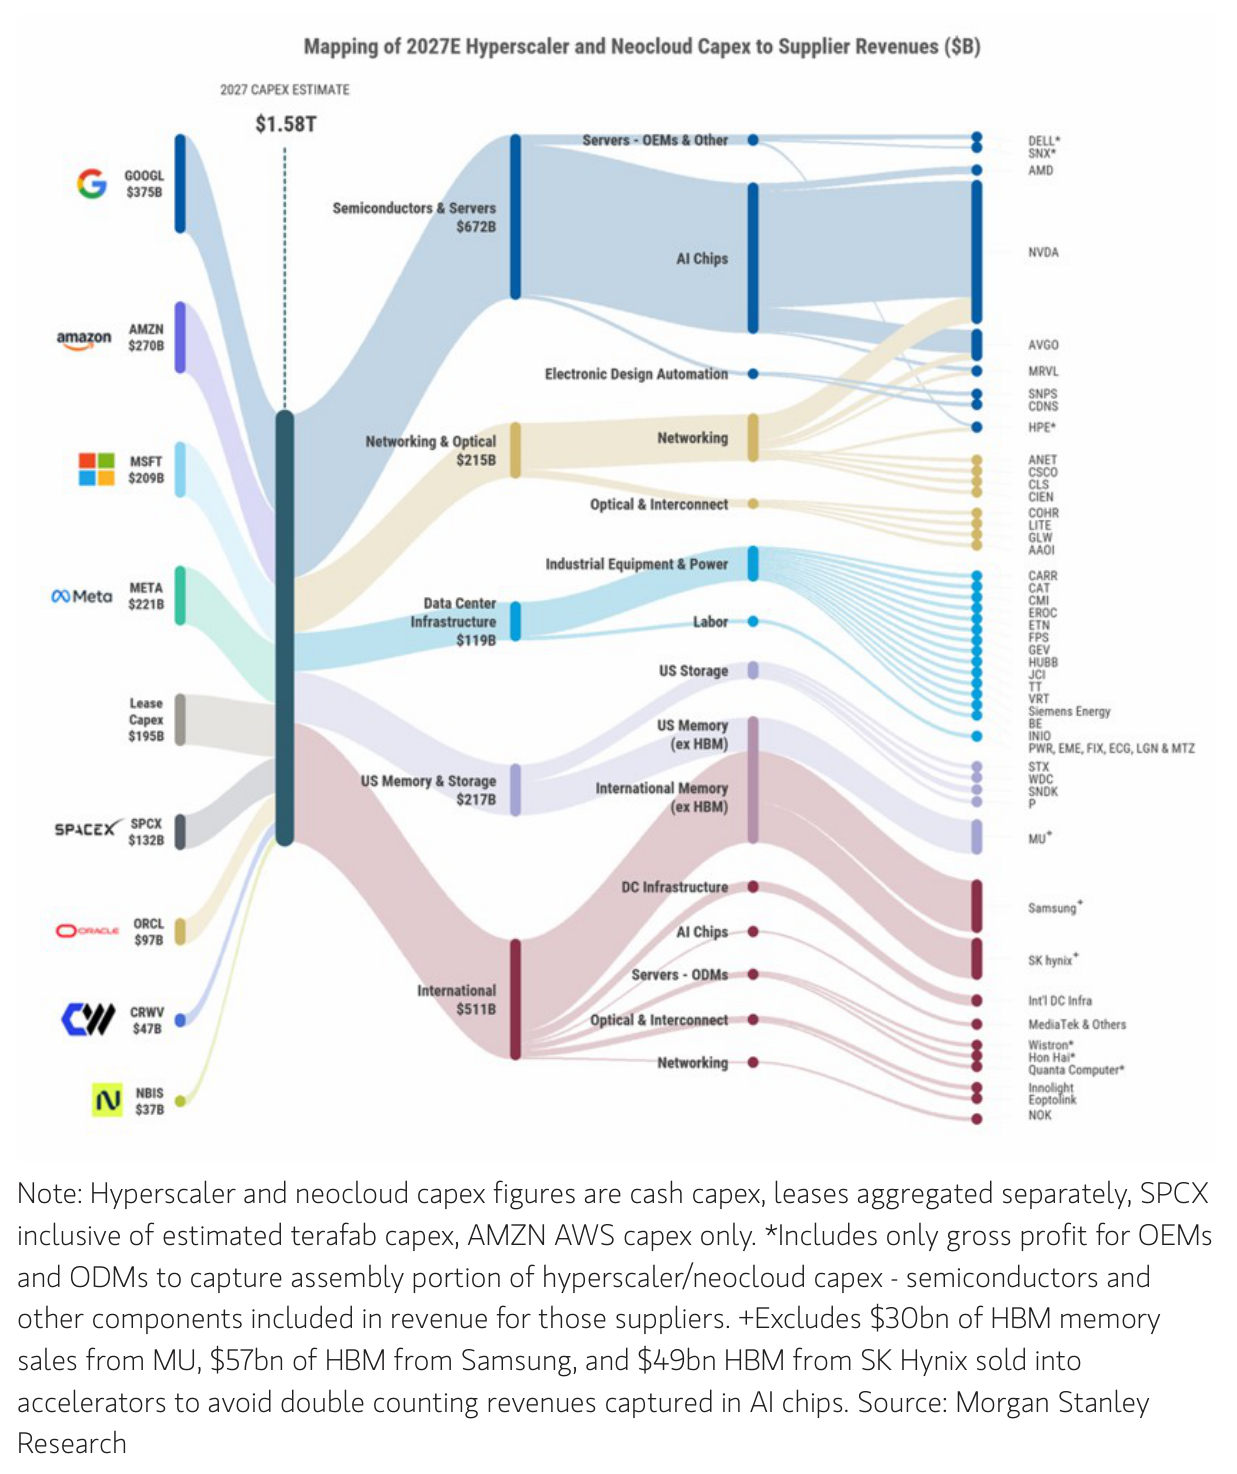
At the heart of the Morgan Stanley report is a Sankey diagram that traces the combined $1.58 trillion in 2027 spending by nine major buyers—Alphabet, Amazon AWS, Microsoft, Meta, the lease pool, SpaceX, Oracle, CoreWeave, and Nebius—layer by layer through semiconductors and servers, networking and optics, data center infrastructure, storage, and international suppliers, ultimately landing on specific ticker symbols.
Among the nine buyers, semiconductors and servers represent the largest single spending category, absorbing $672 billion, the vast majority of which flows to Nvidia. The second-largest category is "international" suppliers, totaling $511 billion, encompassing Samsung, SK Hynix, TSMC-related infrastructure, and Taiwanese ODM manufacturers—none of which are S&P 500 constituents.
The report also notes that the entire map translates $1.6 trillion in capital expenditure into approximately $1.7 trillion in supplier revenue, with the gap stemming from distortions in customer splits by private emerging cloud providers and Bitcoin miners, timing differences, and supplier price increases not yet reflected in capex forecasts. Morgan Stanley's interpretation: the next round of capex upward revisions is already embedded in supplier models.
Nvidia Takes Two-Thirds Alone, the Other 499 Split the Remains
Of the approximately $1.03 trillion in revenue that the S&P 500 absorbs from AI capital expenditure, 67% flows to Nvidia—roughly $690 billion, equivalent to 44% of the entire $1.58 trillion capex budget landing on a single company's income statement. Excluding Nvidia, the entire AI capex boom contributes only 1.6% to S&P 500 sales.
A rough breakdown: about $700 billion goes to Nvidia, about $340 billion is shared by the remaining 499 S&P constituents, and another roughly $550 billion flows outside the index to Korean memory manufacturers, Taiwanese ODMs, and various private companies.
At the individual stock level, Morgan Stanley examined the proportion of each company's 2027 revenue tied to AI infrastructure buildout. Nvidia leads at 91.7%, followed by Erock (EROC) at 91%, Vertiv (VRT) at 90%, Applied Opto (AAOI) at 83%, Broadcom (AVGO) at 81%, and Bloom Energy (BE) at 80%. Even Caterpillar (CAT) has 21% of its revenue tied to the AI capex trend; Seagate (STX) and Western Digital (WDC) both reach 60%.
This structure means that for at least a dozen large companies, "AI capex" and "revenue" are virtually synonymous—a boon on the way up, but on the way down, any correction in capital expenditure will translate directly into earnings revisions, with no other business to buffer.
$195 Billion in Hidden Liabilities
One of the report's most important methodological adjustments is the inclusion of leases in capex accounting. Morgan Stanley used disclosed signed-but-not-yet-commenced leases, analyst forecasts for new capacity, and the lease capex ratio per GW of new capacity to add $195 billion to 2027 capex and $246 billion to 2028 capex.
This raises total 2027 AI capital expenditure from $1.39 trillion (cash capex) to $1.58 trillion, a year-over-year growth rate of approximately 60%; for 2028, it rises from $1.57 trillion to $1.81 trillion.
In terms of lease scale, Oracle leads with $57 billion, followed by Microsoft ($45 billion), Meta ($37 billion), Amazon ($28 billion), and Alphabet ($27 billion). As of the second quarter of 2026, the signed-but-not-yet-commenced lease pipeline had swelled to $1.118 trillion, more than doubling in just two quarters, with Microsoft ($329 billion), Oracle ($288 billion), and Meta ($279 billion) as the primary signatories.
Morgan Stanley's qualitative judgment: leasing data centers is economically identical to debt-financed capital expenditure, merely bypassing GAAP capex line items.
Debt: The Underestimated First Link
Morgan Stanley credit strategists Fernanda Lima and Vishwas Patkar expect that free cash flow for hyperscalers and emerging cloud providers will hit its most negative level in 2027, and the funding gap will be even larger when lease payments are included.
Hyperscalers have issued approximately $255 billion in unsecured bonds year-to-date, roughly 30% of their estimated 2026 capital expenditure, with Amazon ($98 billion) and Alphabet ($81 billion) leading, while blended yields have risen 100 to 180 basis points since the start of the year. Oracle's 10-year bond spread has widened the most, by 180 basis points.
Morgan Stanley's stress test shows that if AA-rated hyperscalers issue $400 billion in bonds at 7% interest, the interest coverage ratio would fall from 30.7x to a still-comfortable 11.9x; but if Oracle and SpaceX raise $120 billion at 8.5%, their combined interest coverage ratio would plummet from 4.0x to 1.8x.
The report explicitly states that emerging cloud providers are most dependent on debt financing, "relying almost entirely on debt issuance to support their capital expenditure ambitions." Days before the report's publication, CoreWeave's stock had fallen sharply; the company corresponds to $47 billion in spending in Morgan Stanley's capex map.
Slowing Growth and the "Power Wall"
Morgan Stanley expects AI capex growth to slow sharply from approximately 60% in 2027 to approximately 14% in 2028. Against this backdrop, the report screens for names that retain pricing power as capex growth moderates, with power equipment dominating, alongside storage, hard drives, and cooling equipment.
Power supply is another structural constraint. Morgan Stanley's proprietary "AI power supply" model shows that even accounting for various rapid power solutions (covering 34% of the 97GW needed), the U.S. still faces a net shortfall of 32GW by 2028, widening to approximately 72GW by 2029. The report characterizes this as a timing mismatch rather than a demand collapse, but notes that storage, networking, optics, and ODM construction are most sensitive to power supply pauses.
On downside risks, Morgan Stanley is unusually blunt: the market currently has a "fear of missing procurement" mentality—buyers are snapping up at high prices today because they expect it to be more expensive tomorrow—and once supply catches up with demand, this logic will reverse. The report cites the 2022 NAND memory cycle as an example—shipments fell only about 5%, but prices dropped 20% to 30%—and concludes: "We believe the market is currently underestimating the risk of simultaneous volume and price declines."
Morgan Stanley's report provides the market with the first dollar-by-dollar map of AI capital expenditure flows, clearly showing that approximately 25% of S&P 500 sales growth and 78% of earnings growth depend on a $1.6 trillion capital expenditure budget—a budget in which two-thirds of the index-level benefit is concentrated in a single company, and an increasingly large share is supported by leases not counted as capex and by debt that only becomes visible upon refinancing.