


Tiger Research: Do Prediction Markets Really Have Practical Utility?

Key Takeaways
• This article is from Tiger Research. Driven by real financial "skin in the game," prediction markets deliver precise probability distributions through dynamic real-time updates, and their accuracy consistently matches or even surpasses traditional polls, expert surveys, and economic forecasts.
• Prediction markets have moved beyond simple sports and election forecasting to become vital macroeconomic and geopolitical data infrastructure, widely adopted by mainstream financial media, central bank researchers, and institutional-grade market platforms.
• To establish prediction market data as trusted decision-making infrastructure globally, platforms must deepen liquidity to resist market manipulation, actively engage with regulators to reframe prediction markets as monitoring tools, and maintain open, transparent data supported by an independent research community.
From Bets to High-Value Data
The first report explored the definition and operating mechanisms of prediction markets, while the second reviewed major regulatory developments. The core argument of both reports is that prediction markets are essentially high-value data sources, not merely venues for betting and gaming.
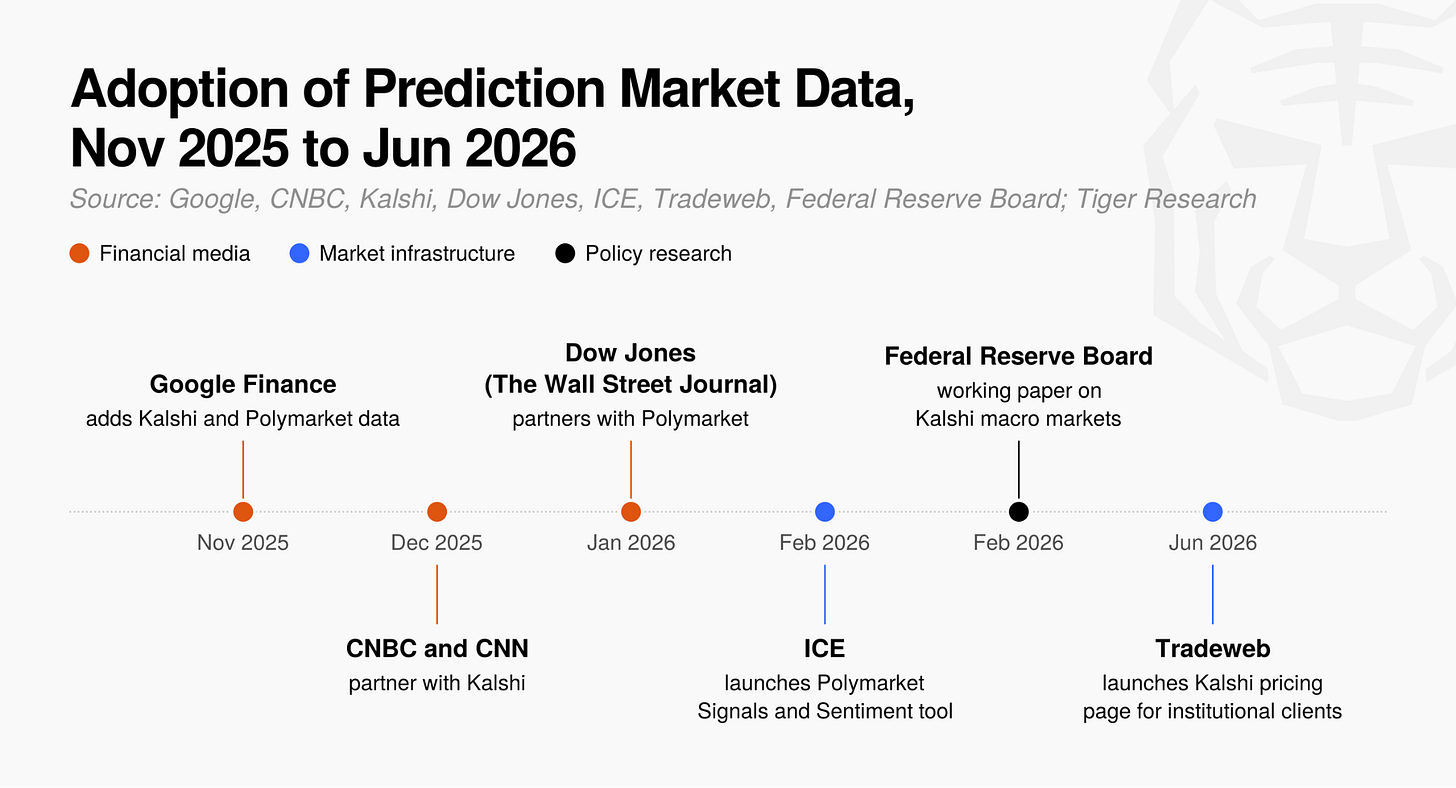
Figure 1: Prediction markets are evolving from simple betting platforms into high-value financial data infrastructure.
Mainstream financial media and financial market infrastructure providers have begun widely adopting prediction market data, vividly demonstrating the core value of this data category.
Google Finance, CNBC, CNN, and The Wall Street Journal (WSJ) have all begun displaying prediction market win probabilities; Intercontinental Exchange (ICE), the parent company of the New York Stock Exchange, as well as Tradeweb, an electronic trading platform for bonds and other assets, have also begun distributing prediction market data alongside their existing market data to institutional clients.
A working paper from the Federal Reserve Board similarly describes prediction market data as a benchmark indicator for macroeconomic expectations including interest rate decisions, inflation, unemployment, and GDP growth.
Federal Reserve economists and their co-authors defined the order book data of the prediction market Kalshi as "a high-frequency, continuously updated, and distribution-rich data benchmark of great value to both researchers and policymakers" (Diercks, Katz and Wright, 2026). As a result, prediction markets are increasingly regarded by the mainstream as rigorous data sources rather than mere gambling websites.
The industry has fully recognized the value of prediction market data and put it into practical use. As the final report in the prediction market series, this report will examine the practical utility of this data through the following three core questions:
• How do prediction market prices translate into high-value data?
• In what specific fields is prediction market data applied?
• Are today's prediction markets actually producing such high-quality data?
How Do Prediction Market Prices Become High-Value Data?
As noted in the first report, the core mechanism of prediction markets is the binary contract, which typically pays $1 or $0 depending on whether a specific event occurs. For example, if a "will it rain tomorrow" contract trades at $0.62, it means market participants estimate the probability of that event occurring at 62%.
Thus, the prediction market price ($0.62) directly serves as a measure of the probability (62%) of a future event occurring. Four structural characteristics explain why these prices can become high-value data that global financial institutions and media rely on for actual decision-making, rather than insignificant odds figures:
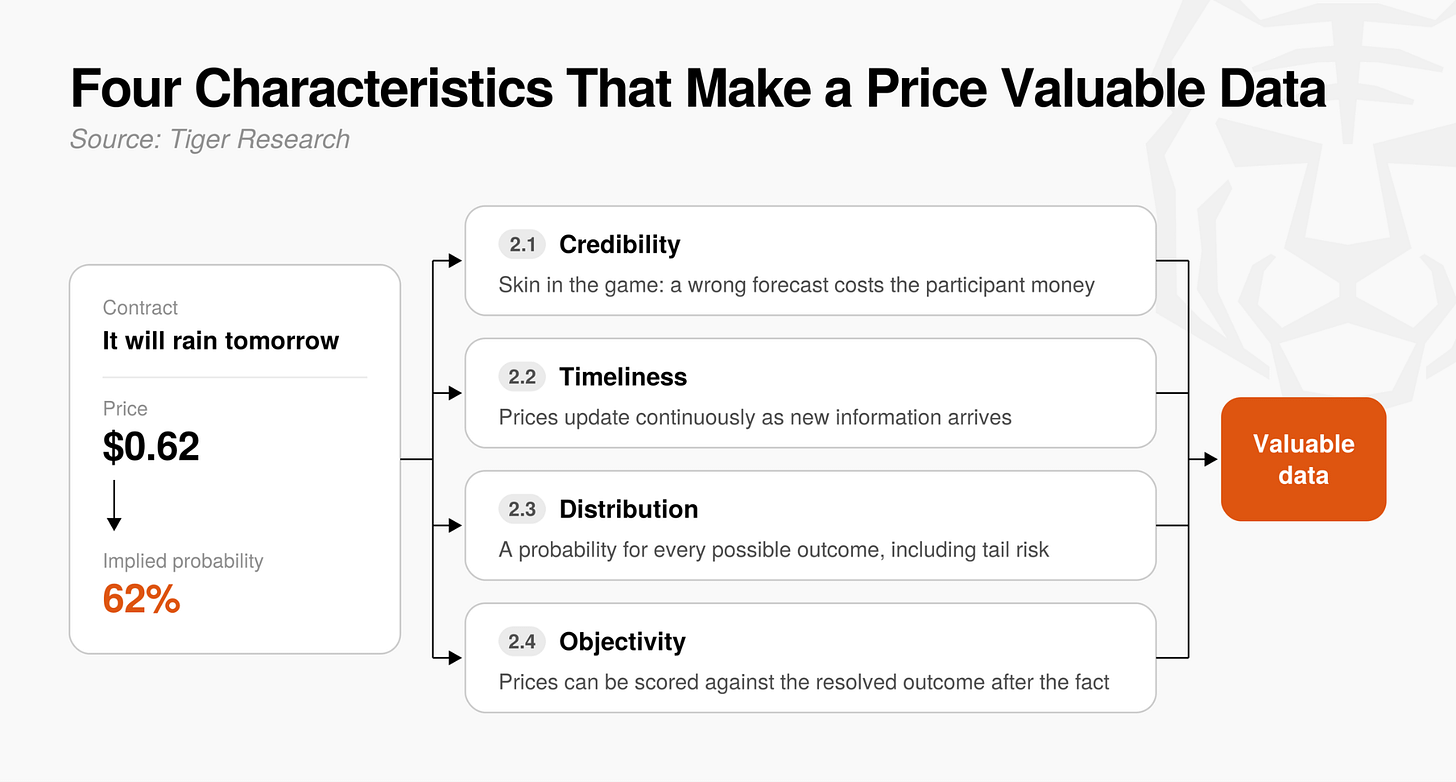
Figure 2: The four core characteristics through which prediction market prices become high-value data: skin in the game, real-time updates, probability distributions, and ex-post verification.
Credibility from Skin in the Game
Some view betting on prediction markets as pure gambling, but real money at stake actually gives participants genuine "skin in the game."
"Skin in the game" means participants must bear real risk and responsibility for their decisions. Unlike costless verbal statements, an incorrect prediction causes participants to suffer actual financial losses, so participants incorporate only carefully verified information and genuine inner convictions into their quotes.
When numerous individual forecasts backed by skin in the game are aggregated together, as long as the market has sufficient liquidity, prediction market prices evolve into highly reliable probability data.
Timeliness from Continuous Real-Time Updates
Traditional polls and expert surveys can only provide a static snapshot of the period in which they were conducted, making it difficult to capture rapidly evolving market changes. For example, if an external economic shock or emergency policy statement occurs today, on the eve of tomorrow's central bank interest rate announcement, a poll completed days ago or a monthly-updated expert survey simply cannot reflect it.
In stark contrast, prediction market prices fluctuate the instant new information enters the market. Whenever breaking news, unexpected events, or regulatory announcements are released, participants quickly readjust their positions, driving prices to update continuously in real time.
Therefore, prediction market prices are by no means stale probabilities frozen in the past, but highly time-sensitive dynamic data that can shift in real time as events unfold.
Probability Distributions Covering All Outcomes
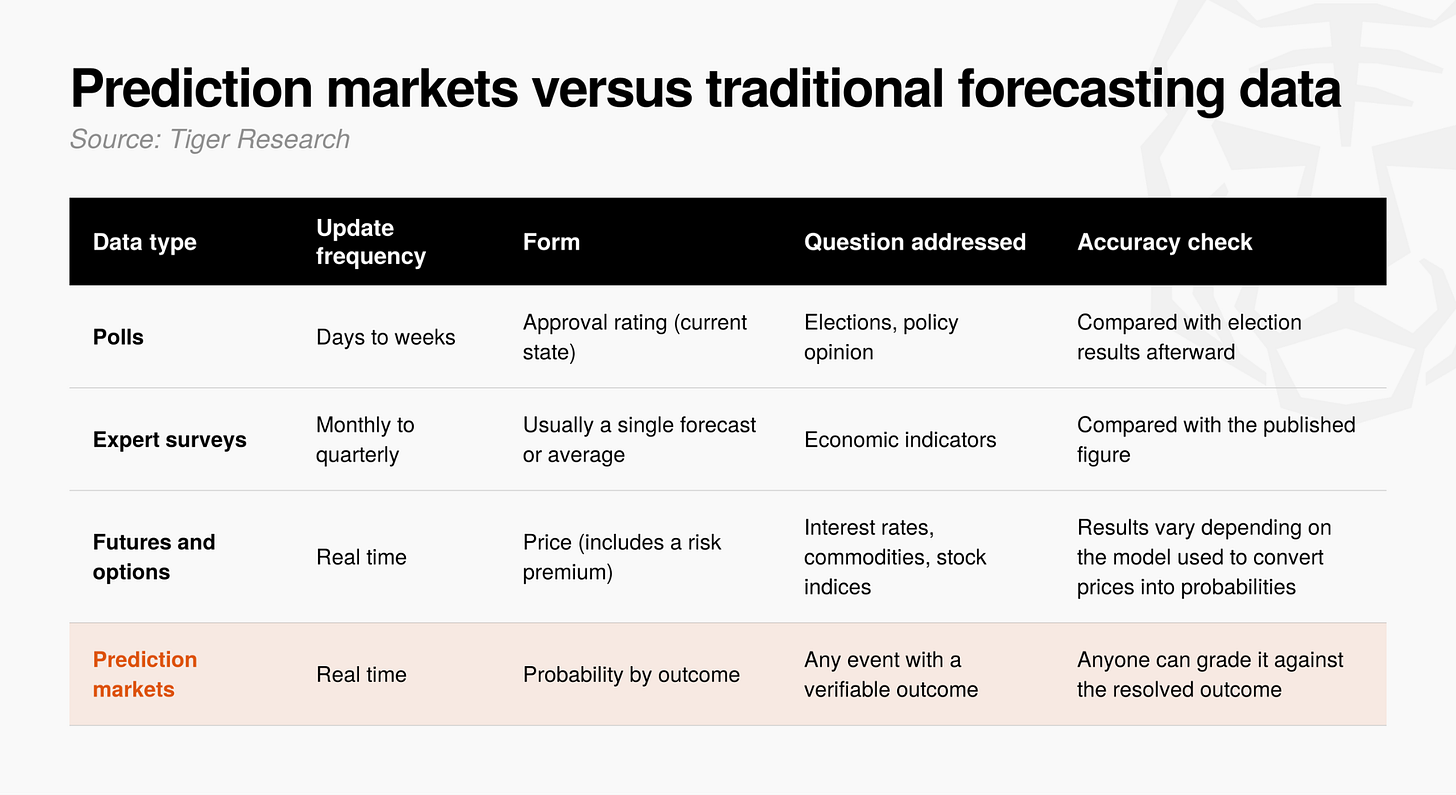
Figure 3: A comparison between single-point numerical forecasts and full-domain probability distributions (covering all scenarios and tail risks).
Traditional indicators focused on a single average or peak value often lose substantial information because they compress numerous complex views into an isolated number. For example, when predicting the magnitude of a central bank rate cut, conventional expert surveys typically provide only an average expected value (such as "a 25 basis point cut") but cannot present the probabilities of multiple scenarios depending on subtle shifts in committee members' remarks.
In contrast, prediction markets can generate a complete "probability distribution" for each possible outcome. The probability distribution here can simultaneously display the corresponding probabilities of all potential scenarios (for example: hold steady 20%, 25 basis point cut 70%, 50 basis point cut 10%), presented as a continuous time series.
This enables prediction markets to measure not only the most likely central baseline scenario but also effectively gauge tail risks—low-probability events that would have severe impact if they occurred. Therefore, prediction markets provide far more than a single-point forecast; their full-domain probability distributions offer comprehensive quantitative support for assessing future market volatility and potential risks.
Objectivity from Ex-Post Verification
The most critical foundation for prediction market data earning deep trust in academia and global financial markets is that their forecast results can be fully and objectively verified after the fact.
Conventional expert forecasts and survey questionnaires can certainly have their accuracy checked once events unfold, but the evaluation process typically involves enormous room for subjective interpretation, and institutions tend to selectively cite track records favorable to themselves. By contrast, prediction market data is fully recorded as clear quantitative prices (probabilities) and typically settles definitively at 0 or 1 upon expiration. Consequently, its accuracy assessment has strict mathematical precision and leaves no room for subjective embellishment.
Anyone can transparently and unerringly compare historical price trajectories against actual outcomes. Because this objective record cannot be tampered with by anyone and can be publicly retrieved at any time, prediction market prices have completely departed from the realm of subjective speculation: professional data teams and authoritative institutions can rigorously verify their historical accuracy, which provides the most compelling foundation for adopting them as core decision-making references.
Where Is Prediction Market Data Applied?
Although prediction market data has only recently attracted broad public attention, its historical origins trace back to the Iowa Electronic Markets (IEM) in the 1980s. For a long time, its most renowned application was election forecasting; as prediction markets have expanded into more macroeconomic domains in recent years, their practical value is becoming increasingly clear.

Figure 4: The broad application landscape of prediction market data across elections, macroeconomics, public health, and corporate intelligence.
Elections: Earlier and More Accurate Than Polls
The first classic case demonstrating the powerful potential of prediction markets is the aforementioned Iowa Electronic Markets (IEM). Researchers systematically compared IEM's performance across five U.S. presidential elections held between 1988 and 2004 against 964 traditional poll results, finding that in 74% of cases, IEM's forecasts of actual election outcomes significantly exceeded those of contemporaneous polls (Berg, Nelson and Rietz, 2008).
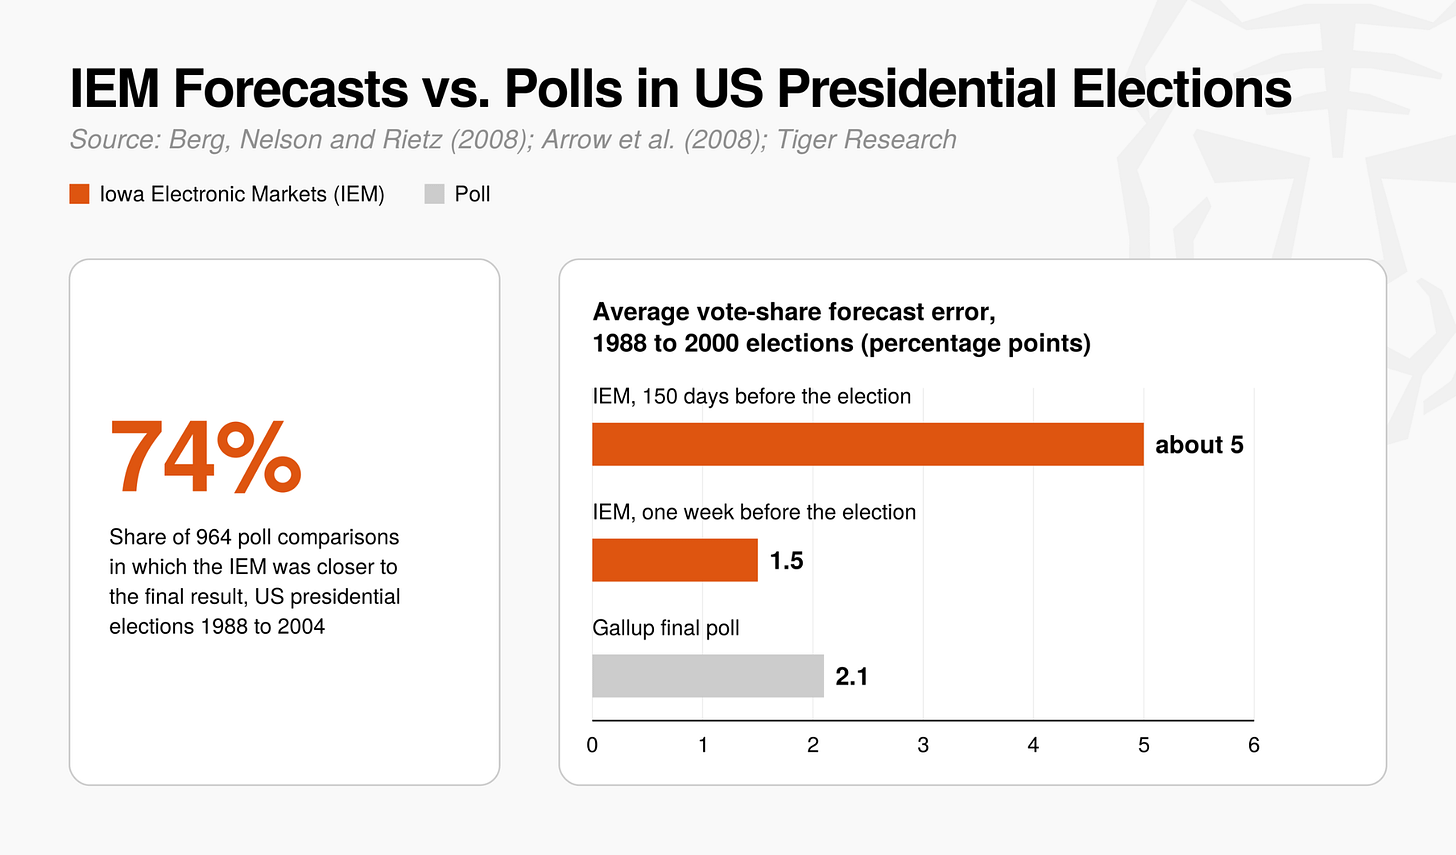
Figure 5: The Iowa Electronic Markets (IEM) significantly outperformed traditional polls in forecasting accuracy across U.S. presidential elections.
This forecasting advantage was not limited to the eve of elections. Analysis of data from the 1988 to 2000 elections showed that in the week before the election, IEM's forecast error for vote share (the gap from actual vote share) averaged only 1.5 percentage points, lower than Gallup's final poll error of 2.1 percentage points; even as early as 150 days before the election, its average forecast error was only around 5 percentage points (Arrow et al., 2008).
However, the two are not directly equivalent in terms of indicator nature. Polls are current-state indicators, asking "whom would you support if the election were held today"; prediction market prices are forward-looking indicators, pricing "who will ultimately win on election day."
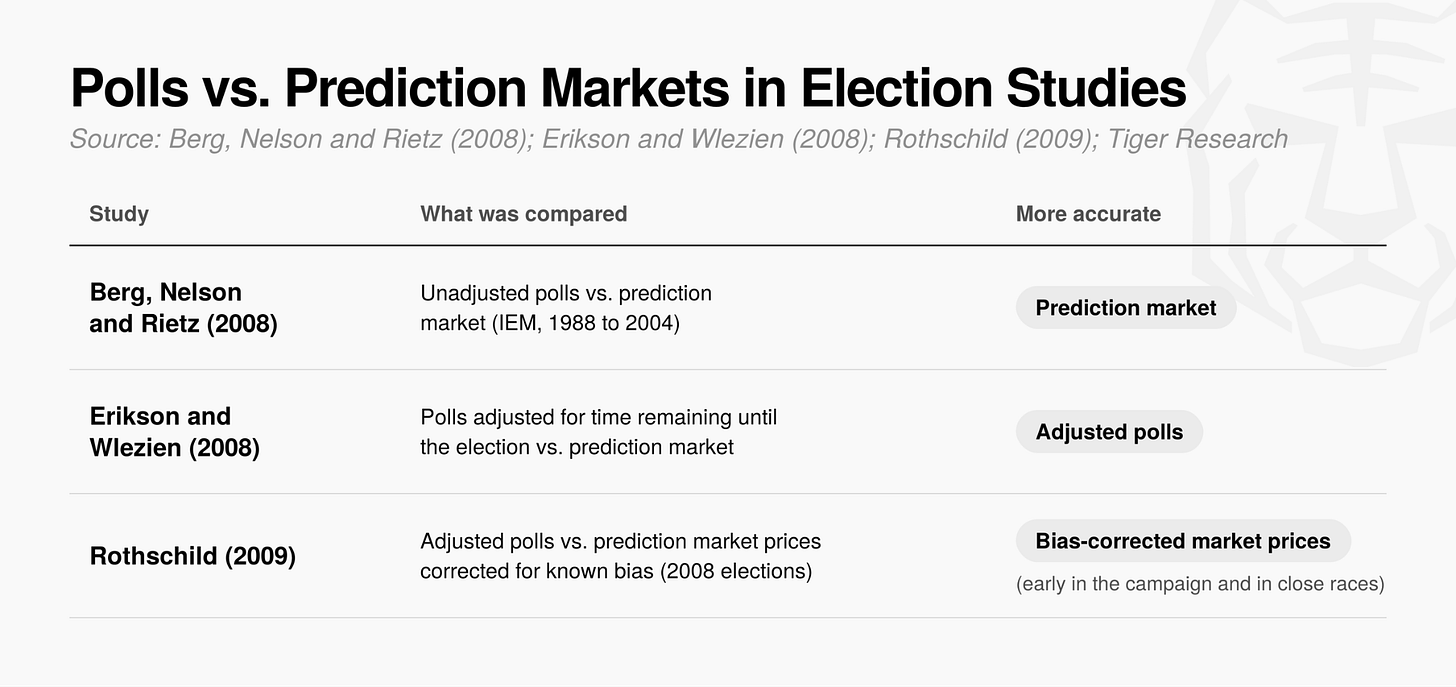
Figure 6: A comparison between polls' current-sentiment snapshots and prediction markets' forward-looking expectation pricing mechanism.
In fact, one study found that if poll data is time-adjusted based on days remaining until the election, its accuracy is even slightly better than prediction markets (Erikson and Wlezien, 2008). But another in-depth analysis of the 2008 election pointed out that if prediction markets' known structural biases are calibrated, their forecasting ability still comprehensively outperforms adjusted polls during the early campaign period and in tight, competitive races (Rothschild, 2009).
Therefore, the accuracy of prediction market prices not only significantly surpasses unadjusted traditional polls but also fully rivals highly calibrated advanced polling models. More importantly, prediction markets can provide daily, high-frequency forward-looking expectations starting months before an election, creating incremental value that traditional surveys cannot match.
Economy: Real-Time Insight into Macroeconomic Expectations
For macroeconomic indicators such as interest rates, inflation, and employment, accurately grasping the market's expected level before official release is of enormous practical significance.
Traditionally, market expectations have been measured mainly through expert surveys or conventional financial derivatives prices. However, surveys are typically updated only every few weeks, severely lacking timeliness; futures prices provide only a single-point value, and option-implied distributions exist only for a few instruments such as interest rates and headline inflation. In contrast, prediction markets can directly generate full-dimensional real-time probability distributions by pricing each potential outcome separately.
This quantitative practical value was fully demonstrated as early as in the economic derivatives market between 2002 and 2005. Analysis of binary option trading data tied to releases of indicators such as nonfarm payrolls, retail sales, and initial jobless claims showed that market-implied forecasts matched or even exceeded the average accuracy of expert surveys, and that market-implied probability distributions closely matched the actual frequency of events (Gürkaynak and Wolfers, 2006).
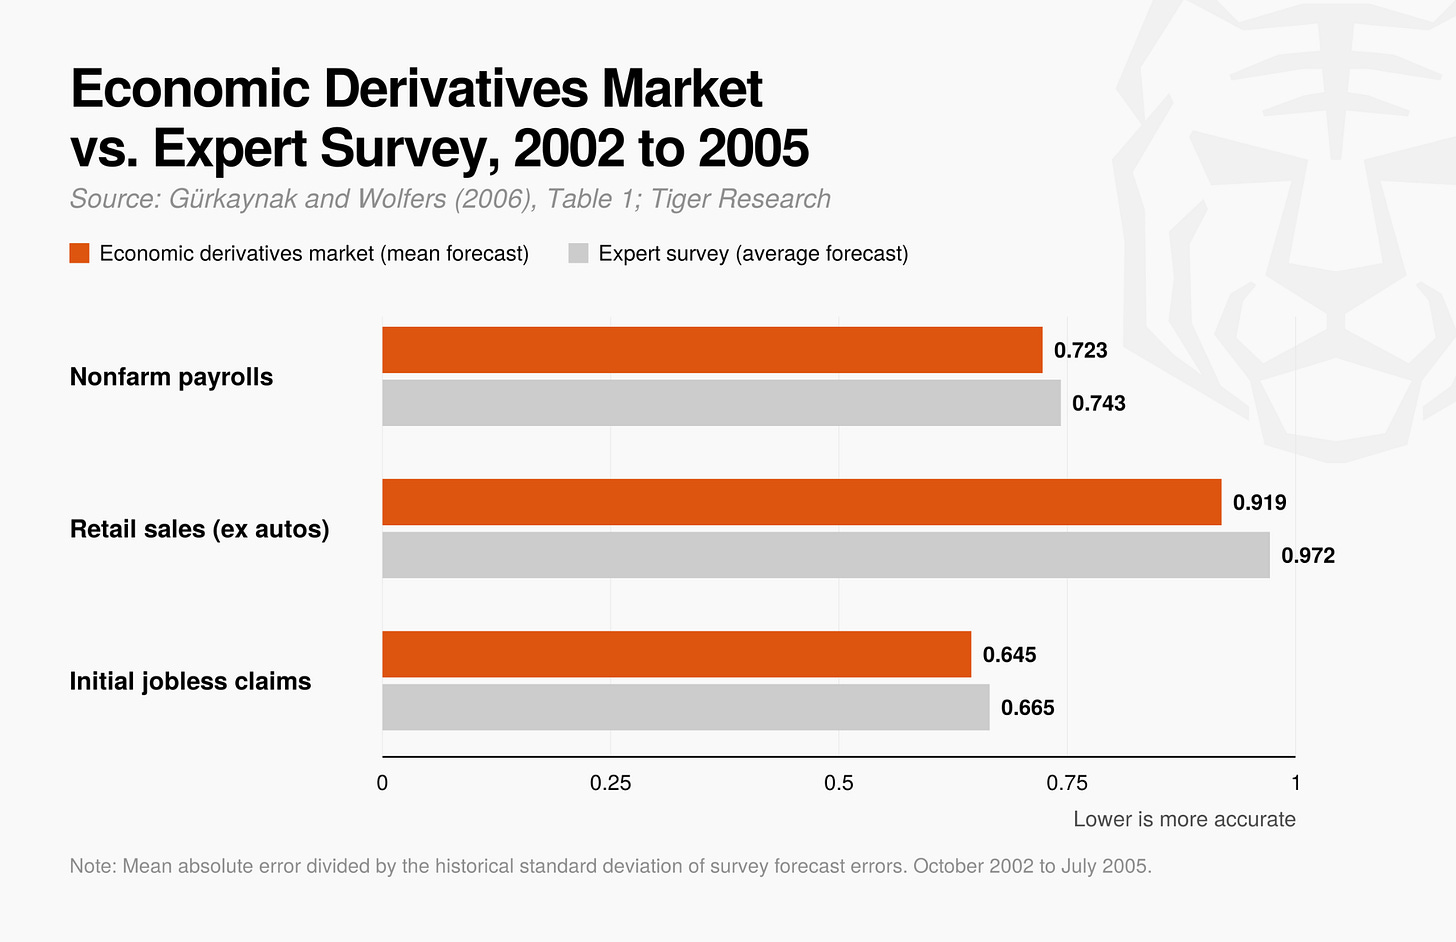
Figure 7: Forecast performance of the economic derivatives market jointly operated by Deutsche Bank and Goldman Sachs for nonfarm payroll and retail data.
A recent Federal Reserve Board working paper (Diercks, Katz and Wright, 2026) conducted an in-depth evaluation of prediction market performance against existing benchmarks. The authors found that Kalshi prediction markets' median and mode forecasts for the federal funds rate had a perfect track record on the day before FOMC meetings, significantly outperforming federal funds rate futures over that time span. Compared with Bloomberg consensus expectations, Kalshi's forecasts for headline CPI inflation were significantly more accurate, while performance on core CPI and unemployment was statistically comparable. This indicates that prediction markets have already surpassed traditional benchmarks on some key indicators and are fully on par in other areas.
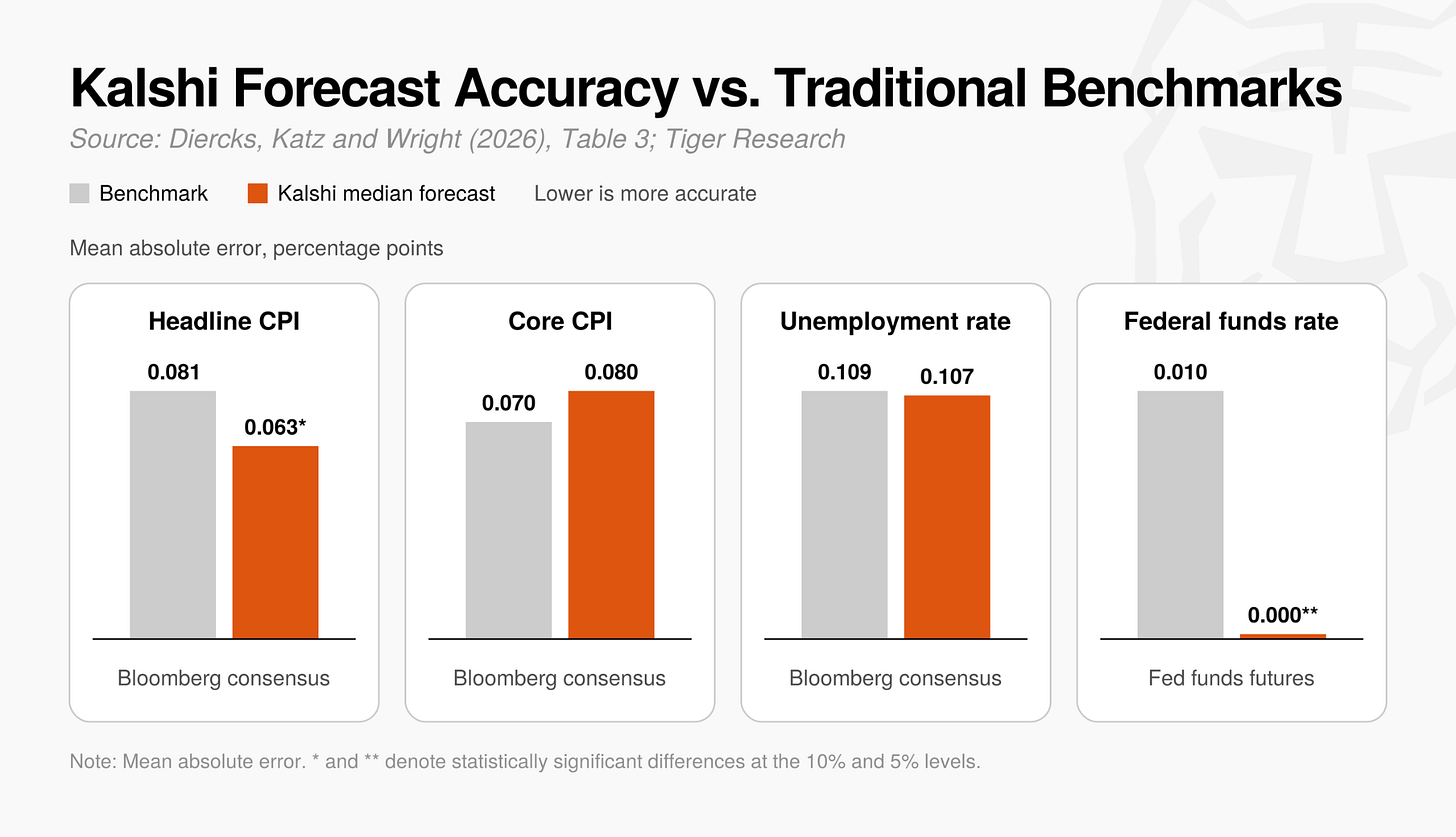
Figure 8: The Federal Reserve working paper shows that Kalshi prediction markets outperformed futures markets in forecasting the federal funds rate on the eve of FOMC meetings.
The study also noted that beyond forecast accuracy, prediction markets have broader practical application prospects. Previously, core macroeconomic data such as real GDP growth, core inflation, unemployment, and nonfarm payrolls lacked derivative indicators with sufficient liquidity. Prediction markets have completely broken this constraint by providing real-time market-based expectations backed by real money and fine-grained probability distributions, thereby offering scholars and macro policymakers a valuable new data benchmark.
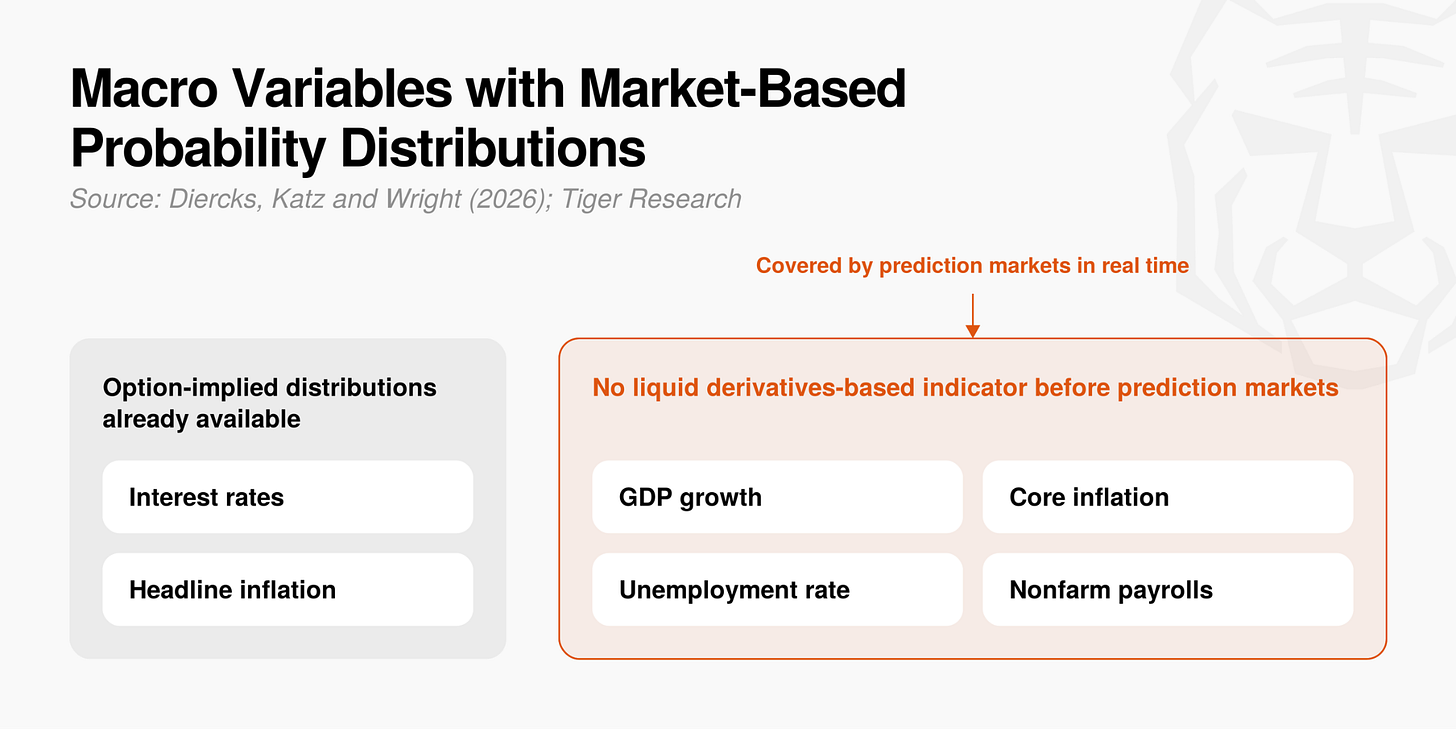
Figure 9: Prediction markets provide continuous probability benchmarks for data such as GDP, core inflation, and unemployment that previously lacked liquid derivatives.
Prediction markets are more accurate than traditional indicators on headline CPI, at least equally precise on interest rate decisions, and clearly present a broad range of macroeconomic expectations never covered by traditional financial markets in the form of real-time probability distributions—making them a highly practical and efficient information source.
Public Health: 2 to 4 Weeks of Early Warning on Flu Trends
The U.S. Centers for Disease Control and Prevention (CDC) releases official flu statistics weekly, so there is inevitably a time lag when tracking the actual spread of influenza.
To compensate for this lag, researchers at the University of Iowa conducted a pilot flu prediction market in which medical professionals traded. The market effectively aggregated first-line clinical observations voluntarily provided by participants and successfully provided accurate early warning of influenza activity spread across the state of Iowa 2 to 4 weeks in advance (Polgreen, Nelson, and Neumann, 2007).
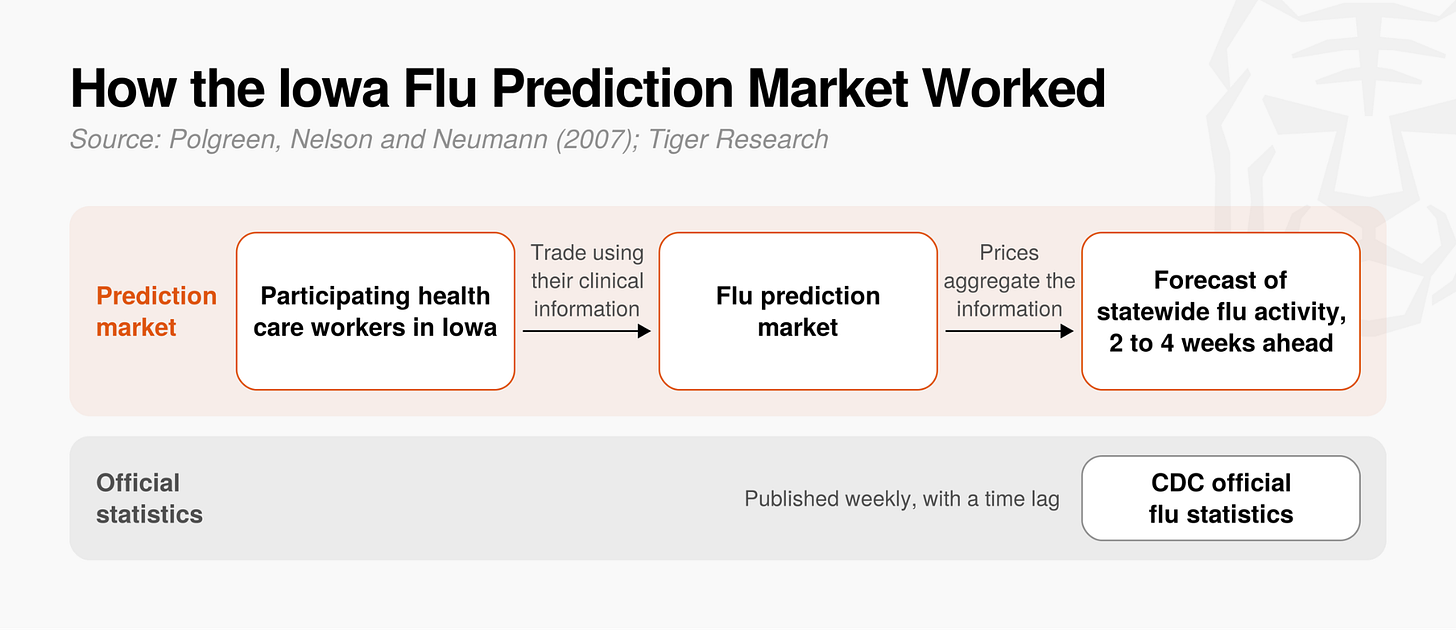
Figure 10: The University of Iowa flu prediction market provided 2 to 4 weeks of early warning on influenza transmission trends statewide.
Such forward-looking forecasts won valuable windows for clinical diagnosis and treatment, early prevention and control, and public health policy formulation. This practice fully demonstrates that prediction markets can provide strong decision-making support for public health emergency response, although the study was still limited to a pilot scope in Iowa at the time.