


Original author: CRYPTO, DISTILLED
Original translation: TechFlow
You may have heard of the banana zone, but do you know when it actually arrives?
(Note: Banana Zone refers to a special period in the financial market during which asset prices may rise sharply)
Here are 6 key metrics you can’t miss:

1. Small-cap stocks and the real economy
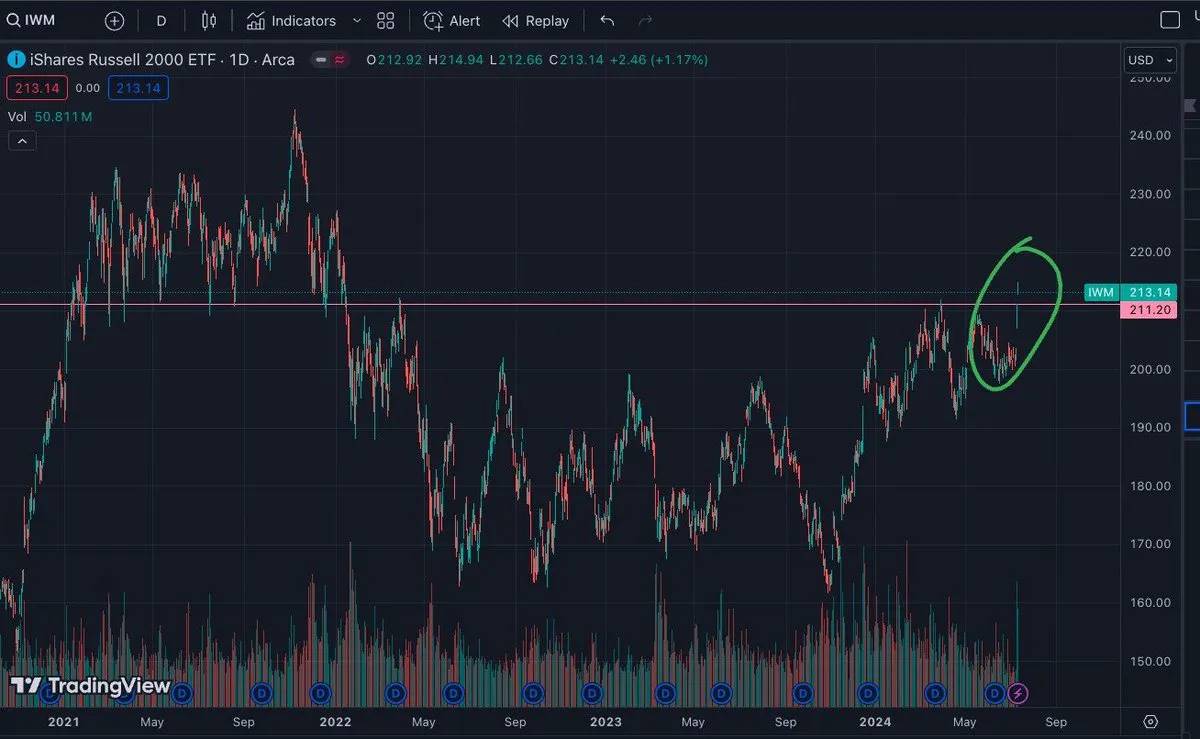
Indicator 1 : Russell 2000 Index ($IWM)
Insight : $IWM represents small-cap stocks and has recently started to break out. This index is an important indicator of the health of the real economy. As corporate earnings increase, more money usually flows into these assets.
Source: @pakpakchicken
2. Rising risk appetite
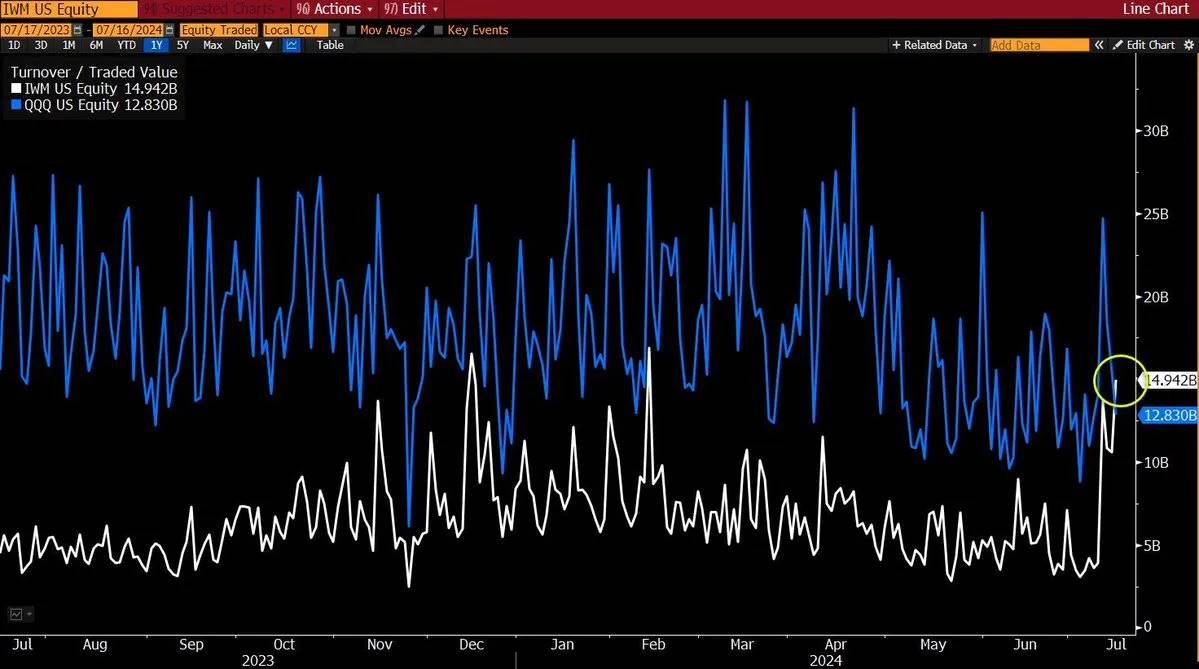
Indicator 2 : Russell 2000 ($IWM) and Nasdaq 100 ($QQQ) trading volume
Insight : $IWM trading volume also reflects the market’s risk appetite. Recently, $IWM’s trading volume exceeded $QQQ ($14 billion vs. $12 billion). This rare situation last occurred in 2017, indicating that investors are more inclined to “risk-on”.
Source: Eric Balchunas
3. ISM Manufacturing Index
Indicator 3 : ISM Manufacturing Index
Insight : The index is crucial to understanding the business cycle. Its cyclicality emerges approximately every four years, driving liquidity trends. Raoul Pal predicts that the index will peak in mid-2025.
Source: RaoulGMI on X
4. Fed Liquidity
Indicator 4 : Federal Reserve’s H4.1 data
Insight : Monitoring the Fed’s “money printing” activity is critical as liquidity drives the cryptocurrency market. Check H 4.1 data every Thursday (EST).
Source: MartyParty on X
5. People’s Bank of China (PBoC)
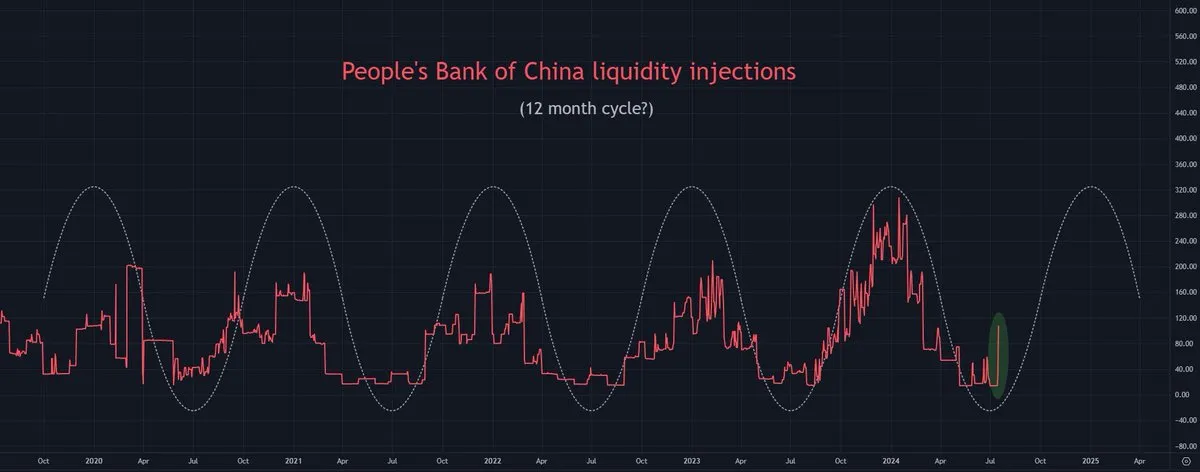
Indicator 5 : PBoC liquidity injection
Insight : Second only to the Federal Reserve, the People’s Bank of China plays a major role in global liquidity dynamics. Watch the PBoC’s liquidity injections, which are starting to show movement.
Source: @tomasonmarkets on X
6. Corporate FOMO
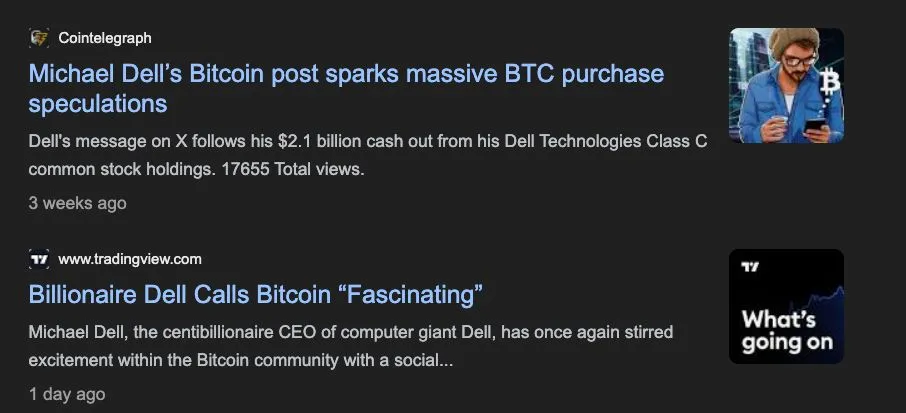
Indicator 6 : Corporate BTC purchases
Insight : Large companies buying $BTC can trigger market frenzy. For example, Tesla bought $1.5 billion of $BTC in 2021, influencing the last cycle. Watch for similar moves by other companies like Dell.
Source: Google


