Original source: AICoin
In the volatile cryptocurrency market, investors often face the challenge of buying at the bottom and selling at the top. To help investors seize key opportunities in the bull market, AICoin Research Institute and Bitget Research Institute jointly conducted a series of classic strategy research, aiming to help users make wise decisions and avoid blind operations through in-depth analysis of core indicators.
In this study, we focus on an important indicator that is widely used but often overlooked: OBV (On Balance Volume). OBV provides another perspective on market trends by combining trading volume with price changes. Its uniqueness lies in that OBV does not rely solely on price changes, but incorporates changes in trading volume.
Considering that it provides a signal of potential trend reversal. Both AICoin and Bitget platforms use K-line to support OBV indicators to assist investors in investment analysis.
In general, OBV has the following classic uses: confirming trends, escaping tops and buying bottoms, and judging the behavior of main players. OBV is often used in conjunction with moving averages to predict market conditions, with price moving averages to find key points for price breakthroughs, and with volume moving averages to identify institutional entry.
1. Usage
1. Confirming the trend
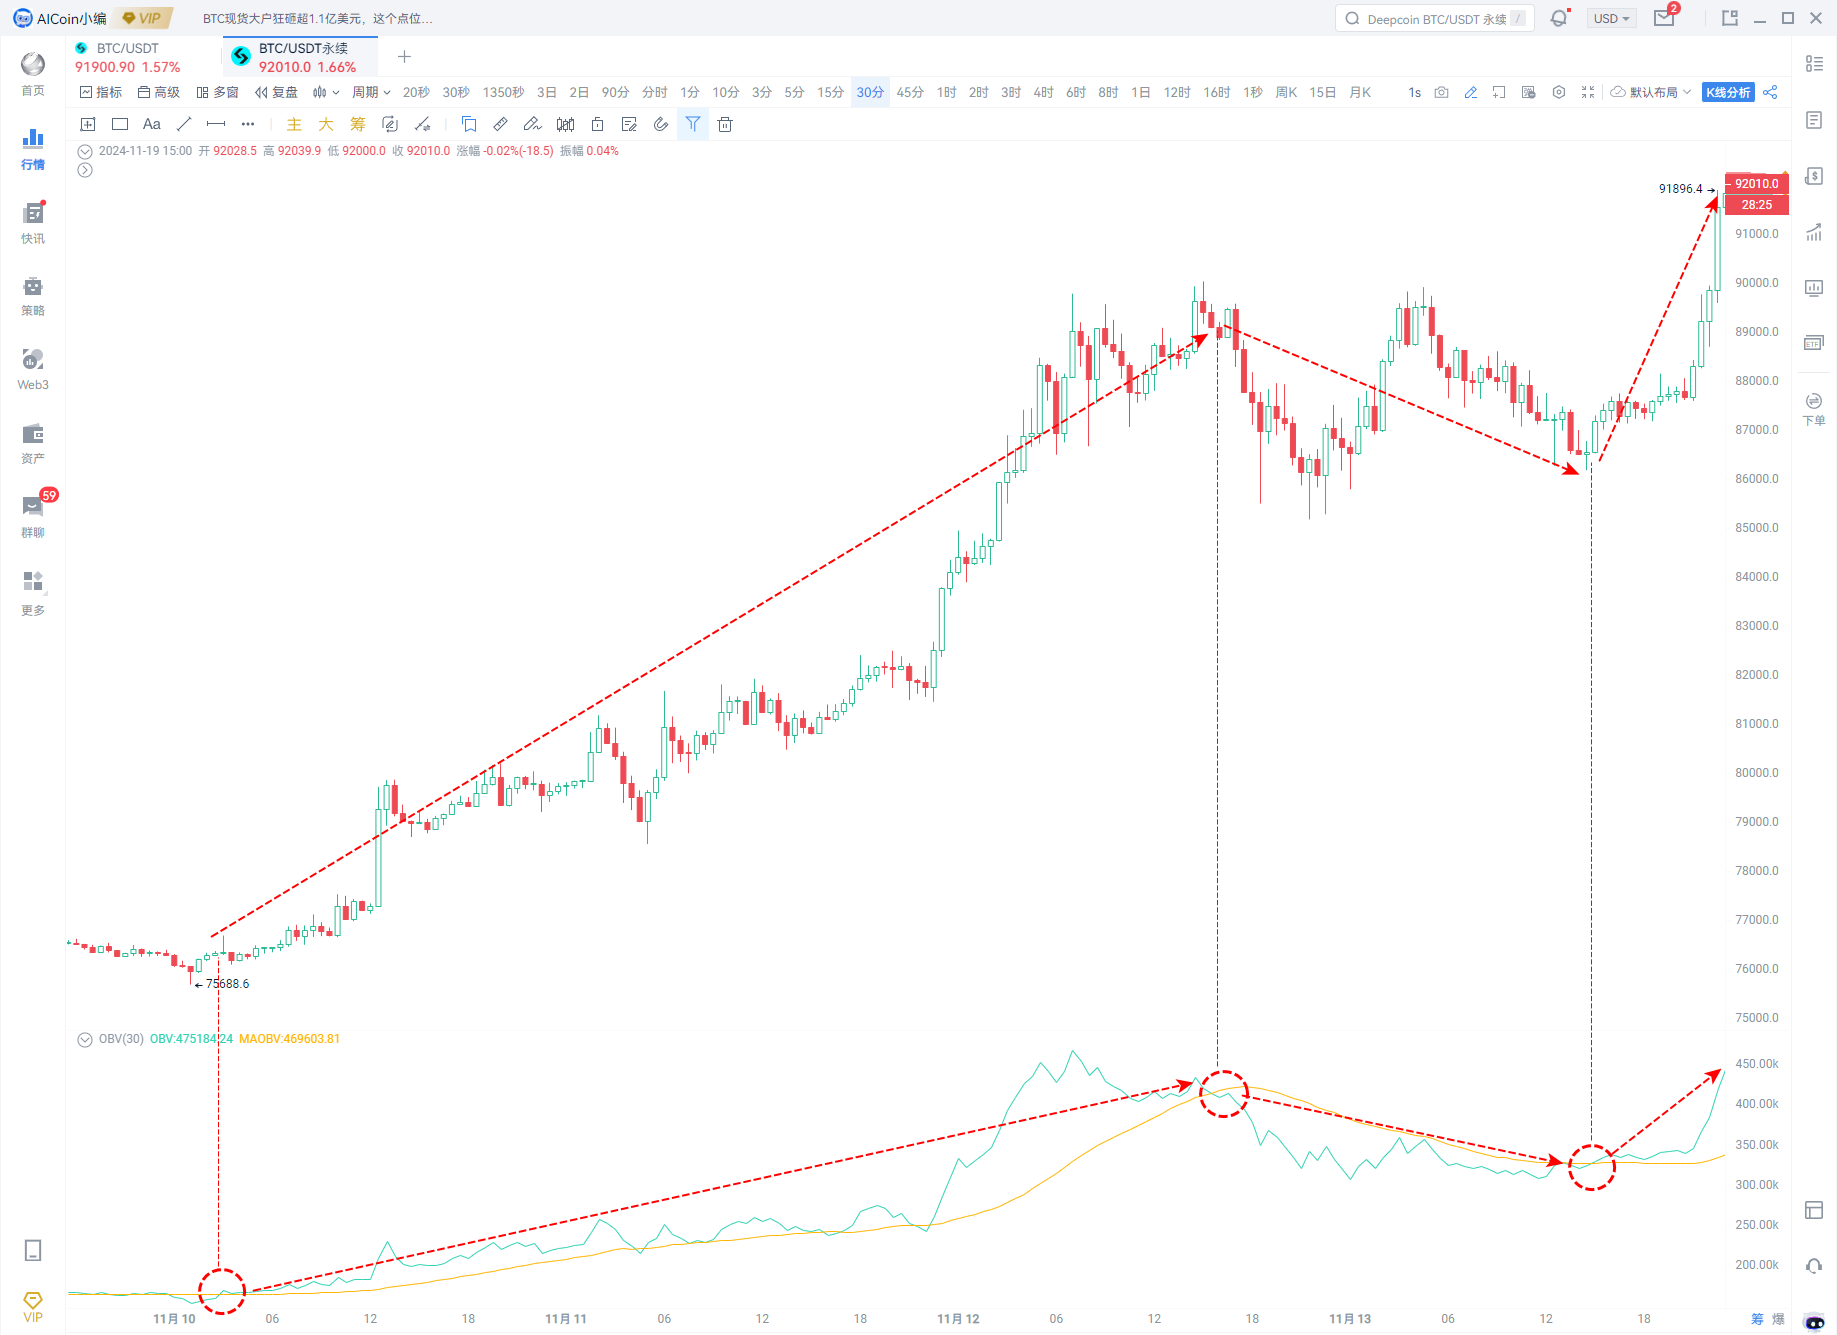
Uptrend: OBV rises as prices rise, indicating bullish strength;
Downtrend: The OBV declines with the falling price, which shows strong bearish sentiment.
(II) Determining the main force’s behavior
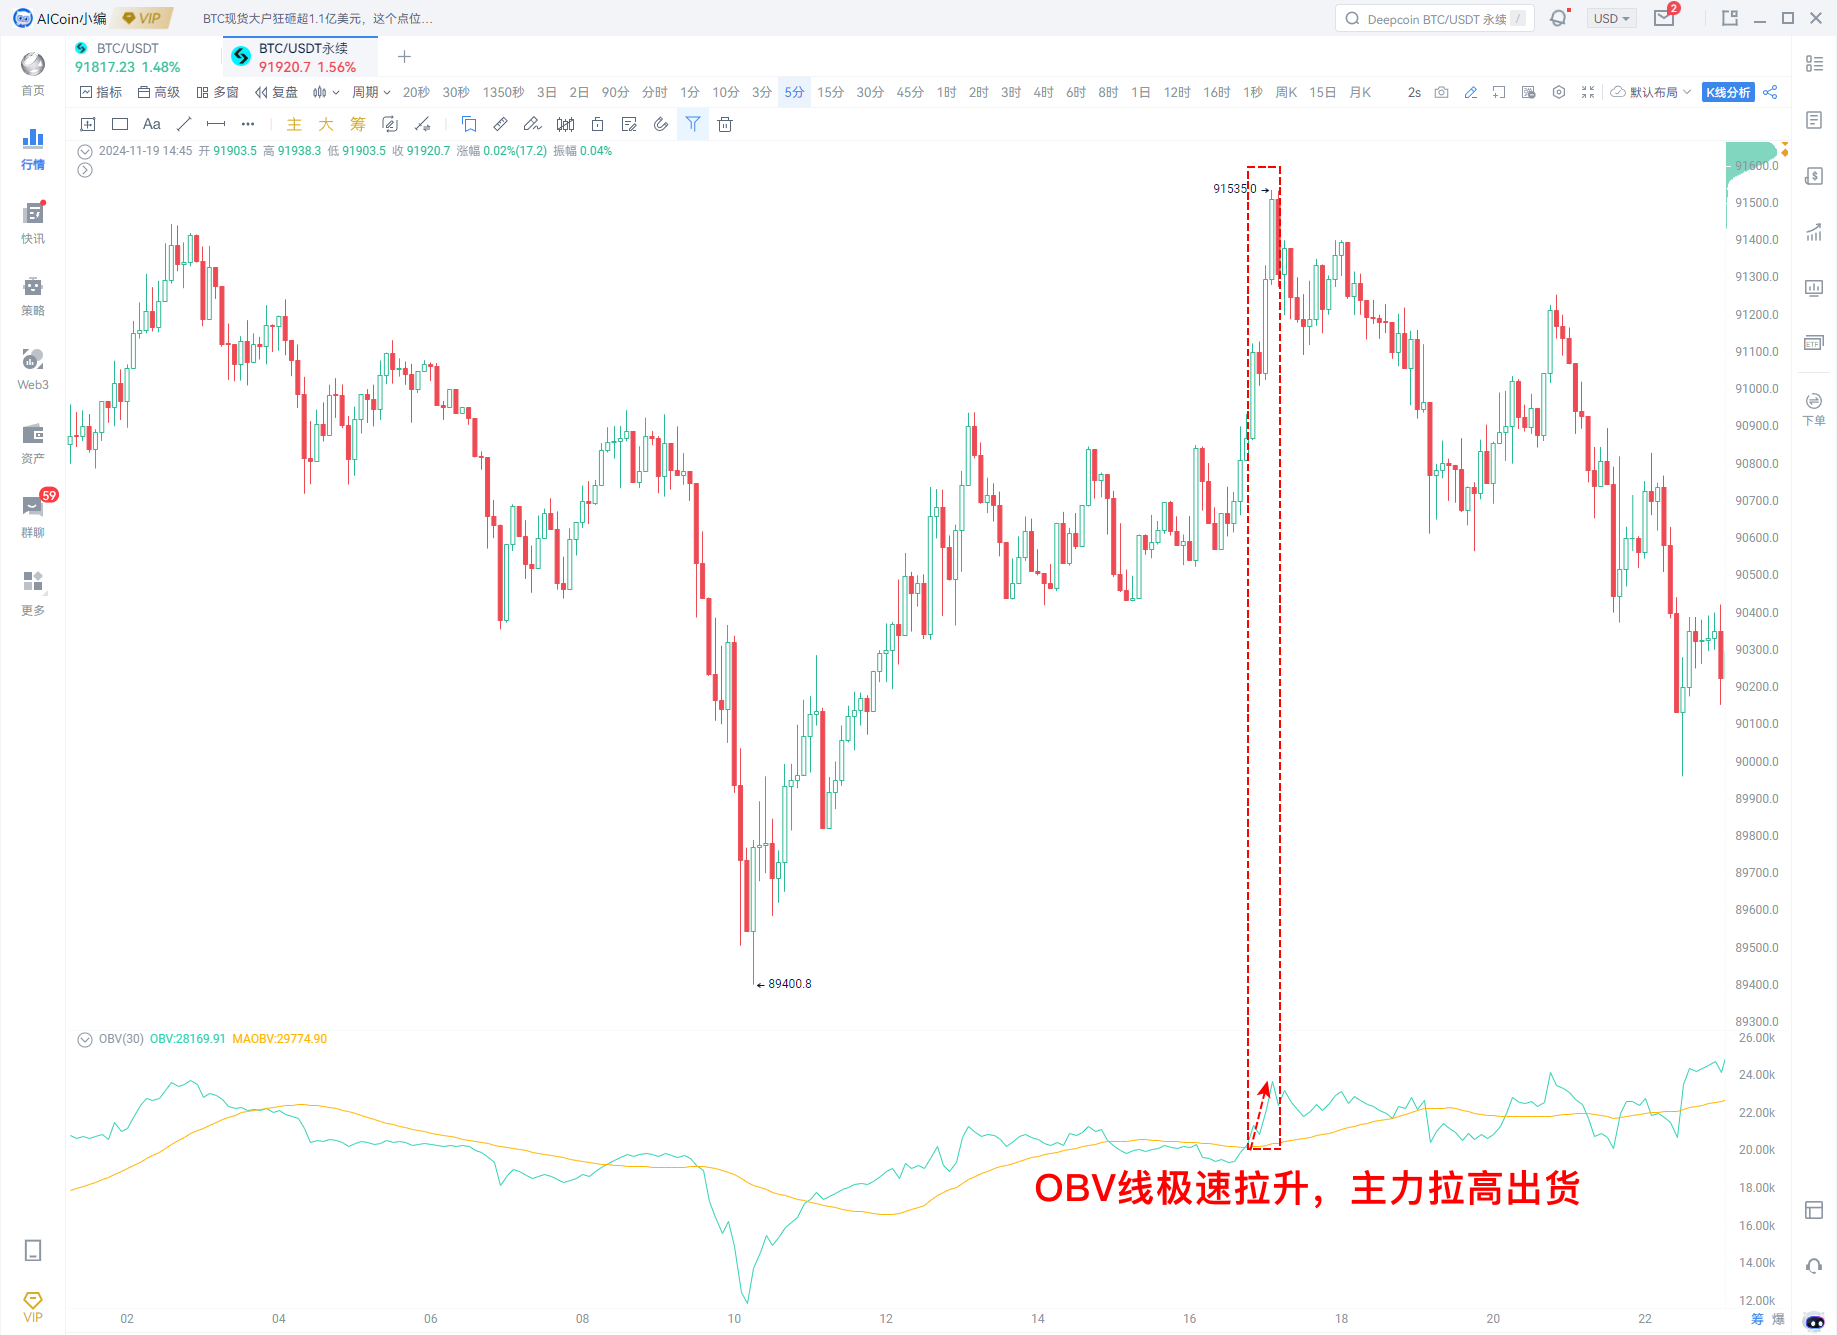
1. The main force pushes up shipments
When the OBV line rises rapidly, it means that the buyers power is about to run out, and the main force pulls up and flees, which is regarded as a sell signal. If it appears in the late stage of the trend, the effect is more significant.
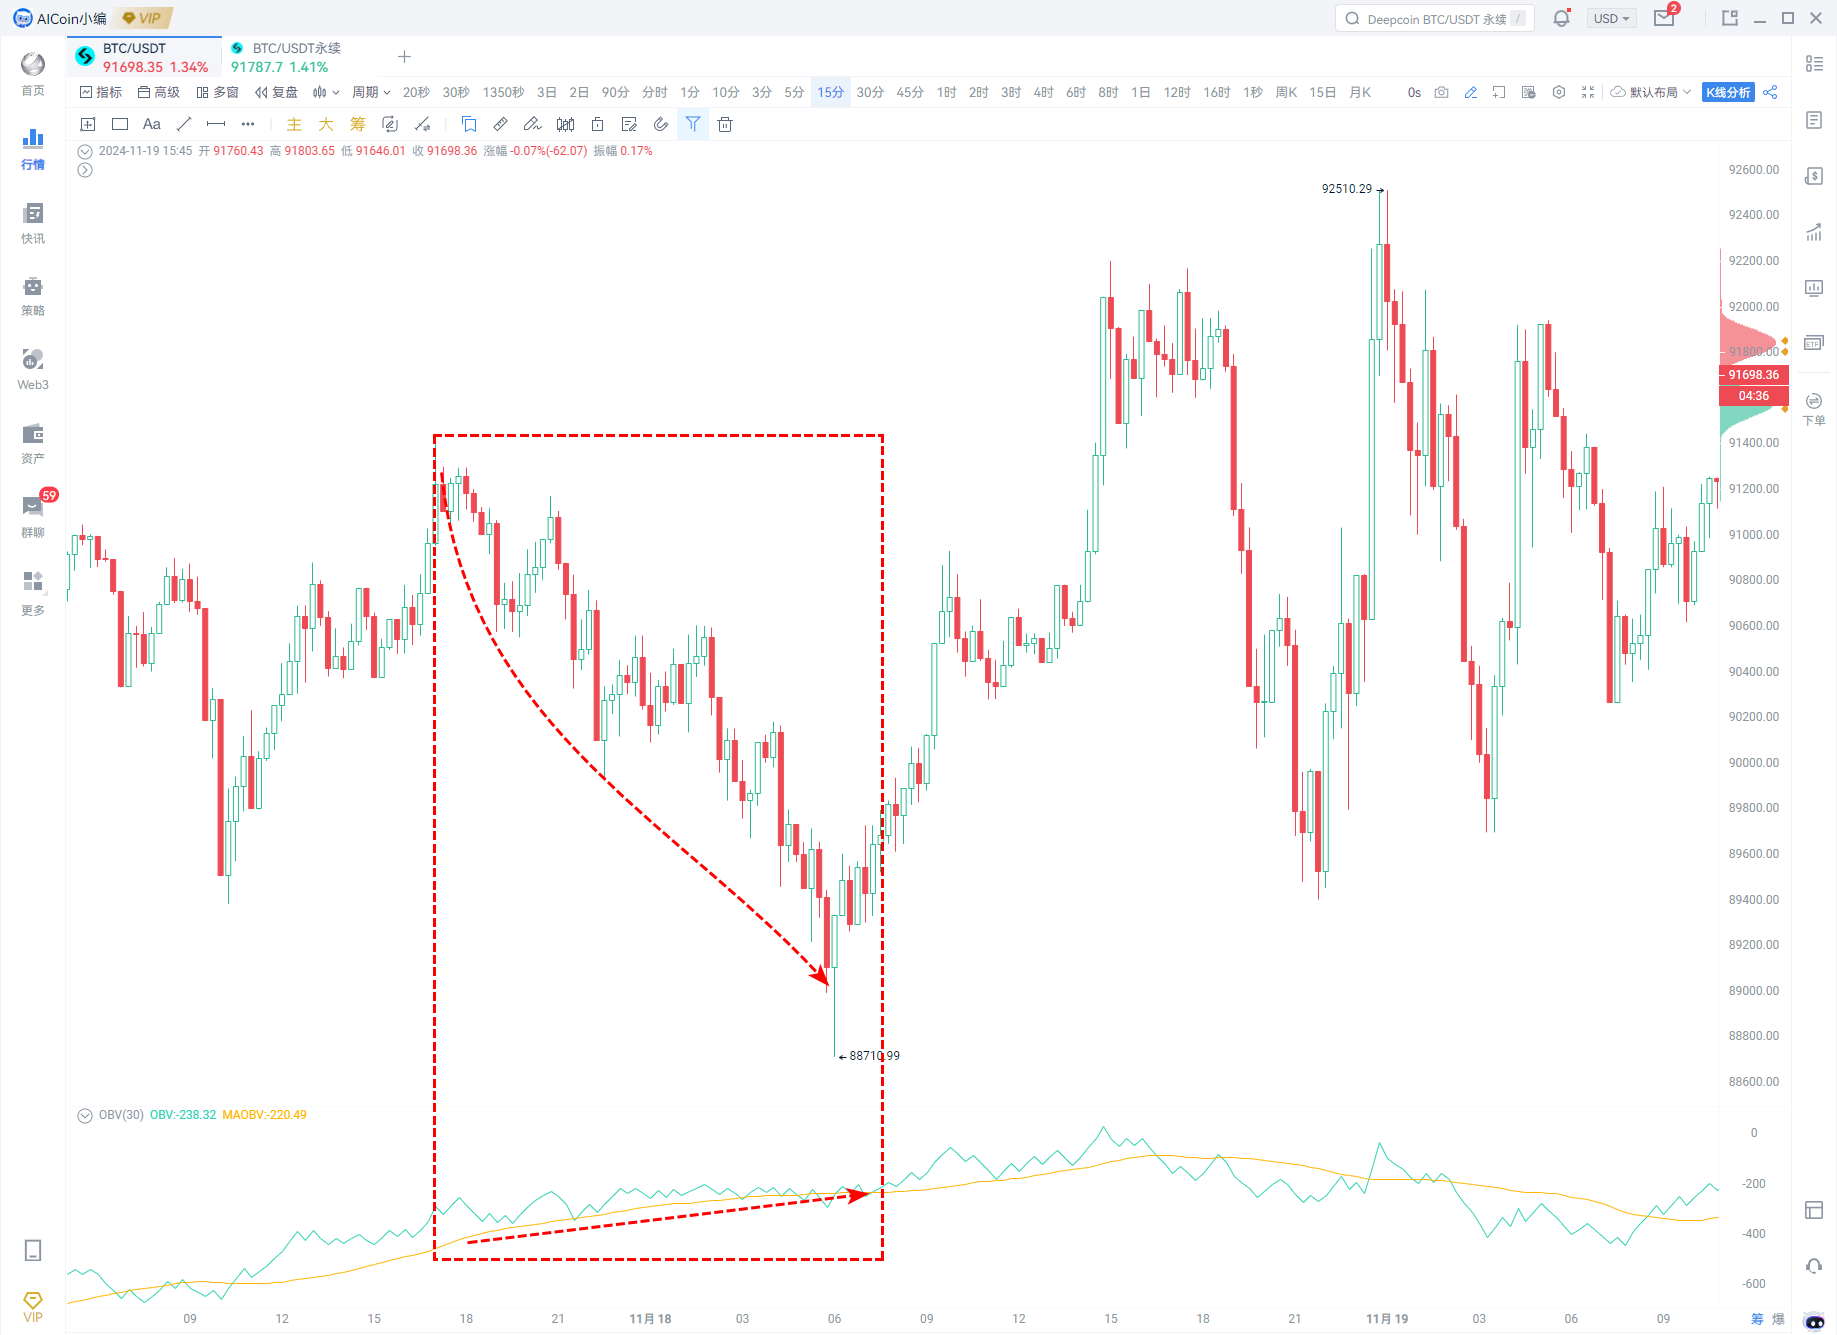
2. Main force pressure plate
The price falls, but OBV rises, indicating strong buying. The main force buys on dips, and the price may stop falling and rise again.
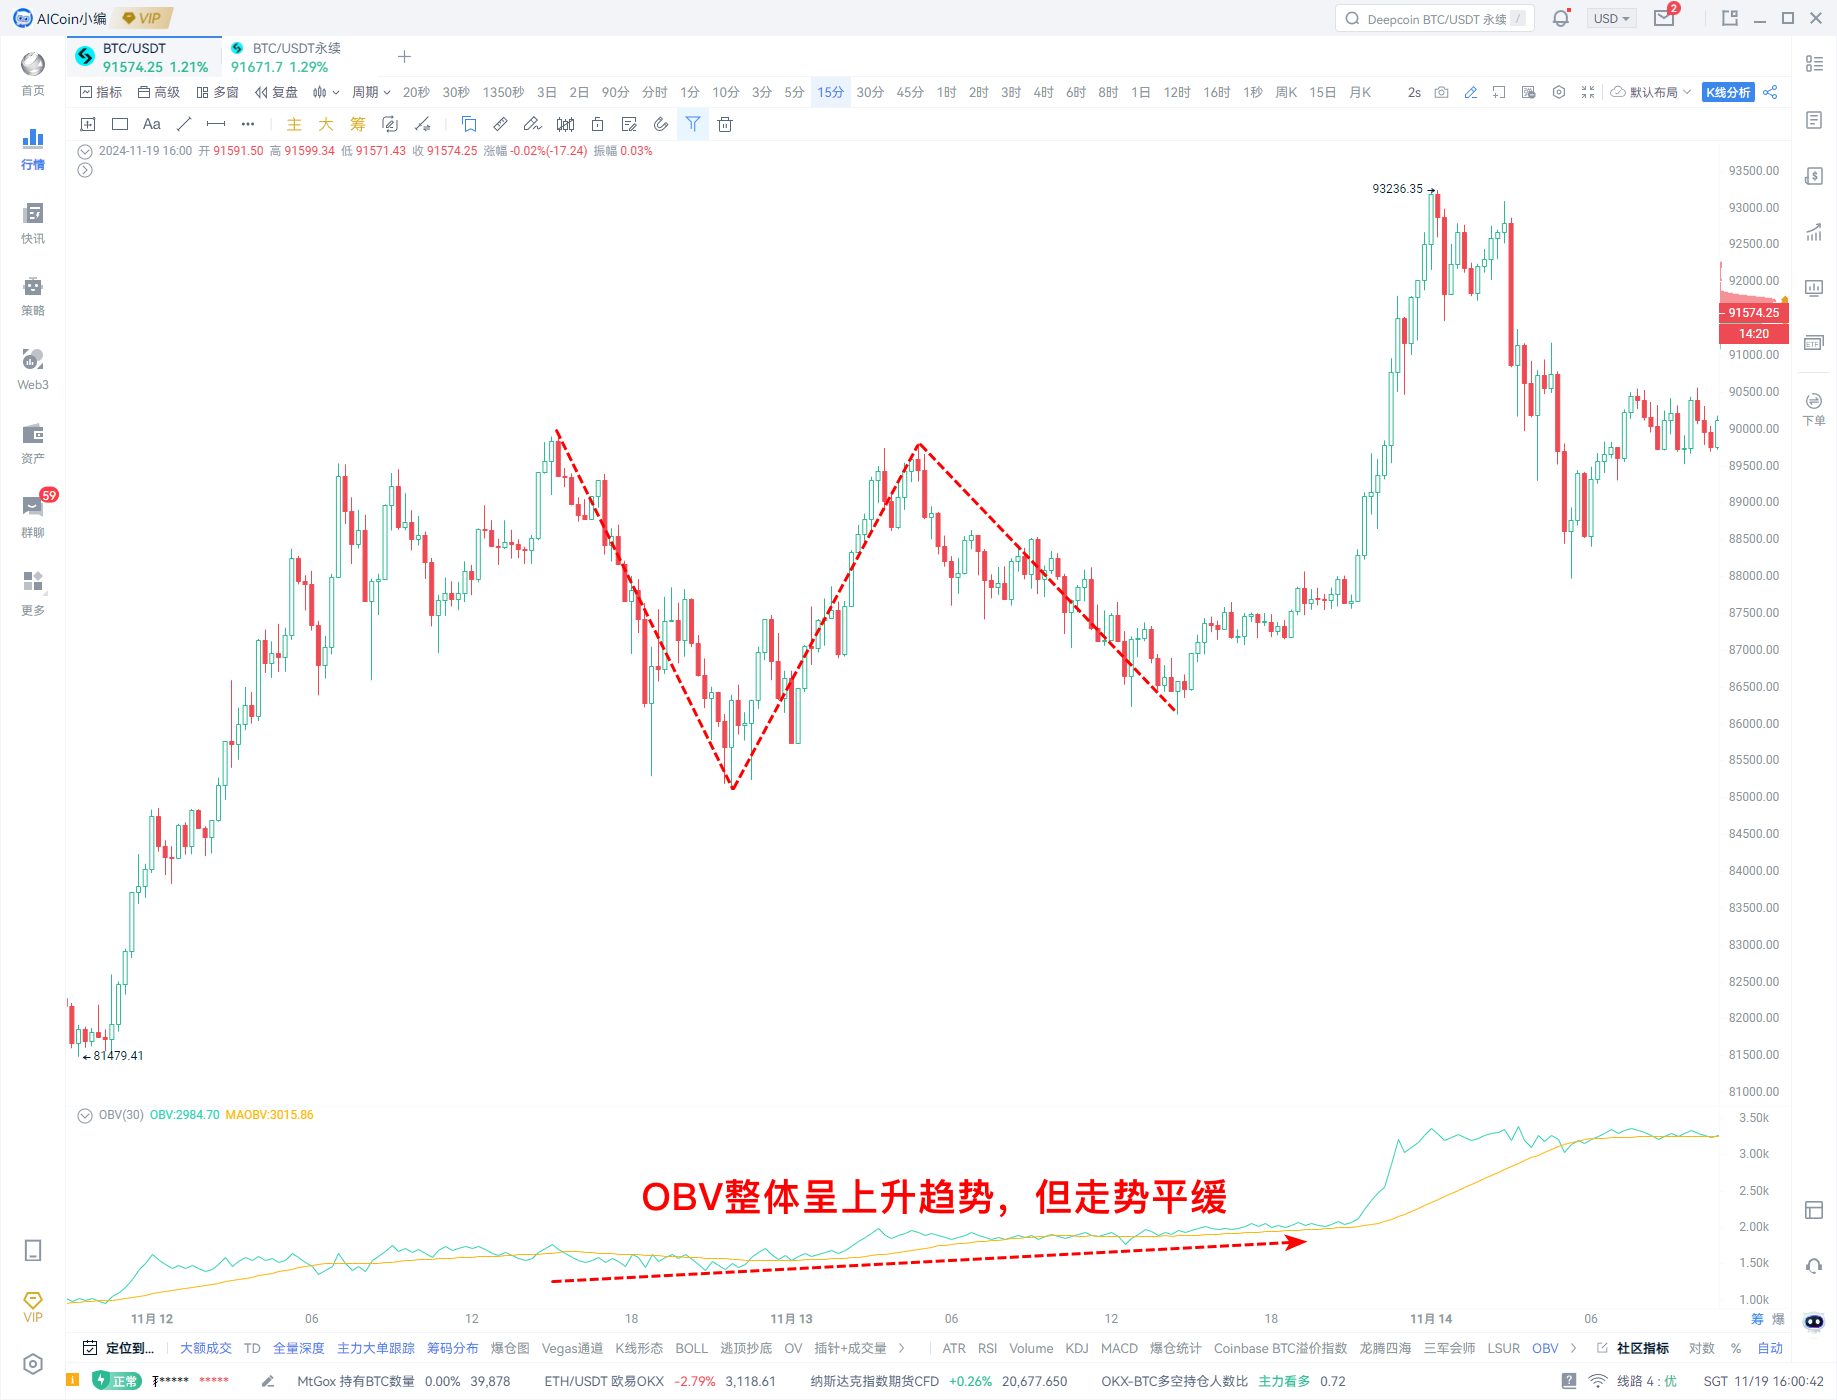
3. Main force wash
The OBV line rises slowly, but the price fluctuates violently, indicating that the buyers power is gradually increasing, which can be regarded as a buy signal.
3. Use with other indicators
1. Use with moving average
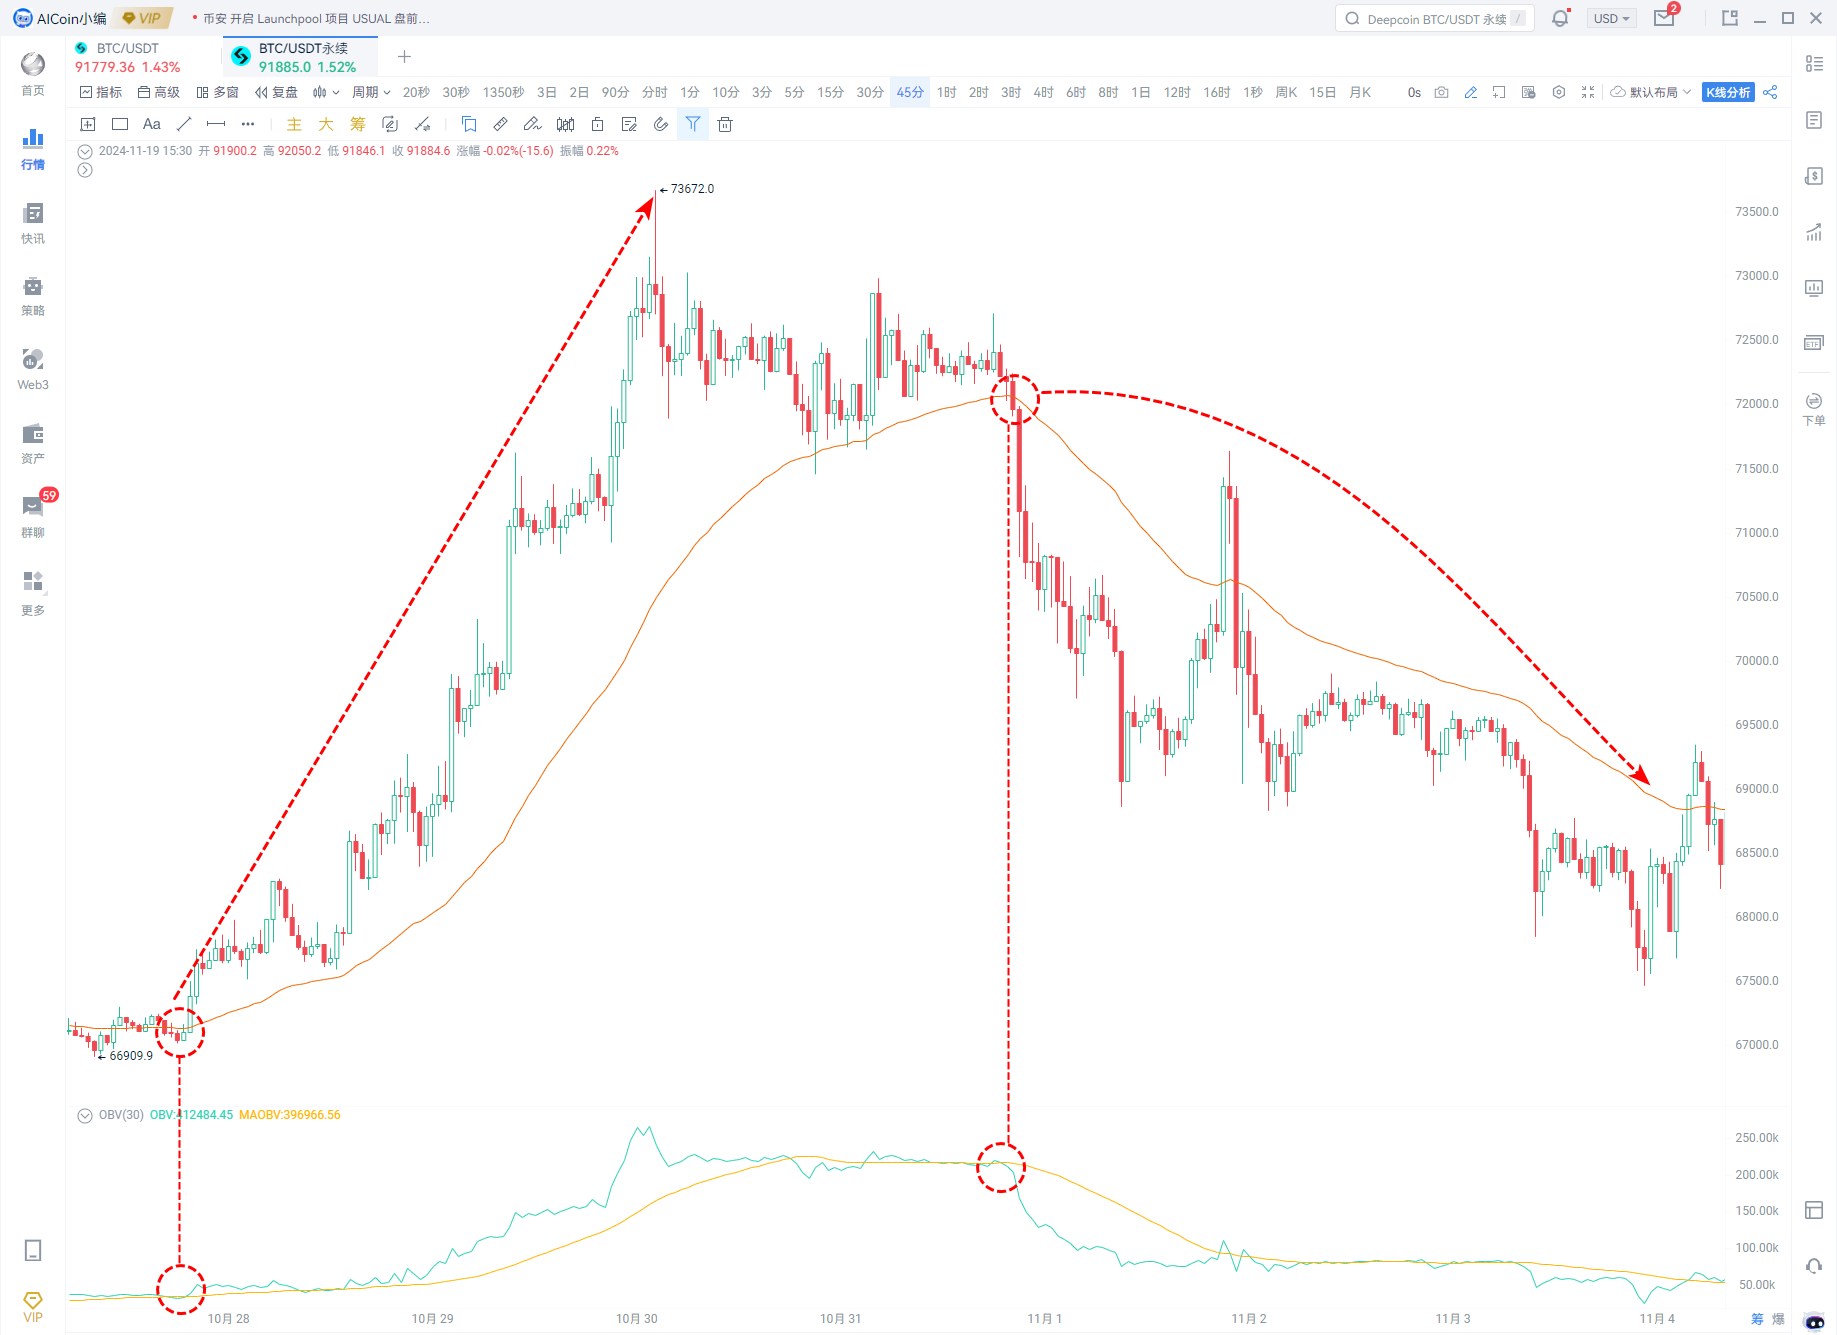
The moving average can be selected as a simple moving average. The specific moving average and parameters can be adjusted according to personal viewing habits. Take EMA 52+OBV as an example:
When OBV rises and the price remains above EMA 52, it is considered a bullish trend;
When OBV turns down from its high point and the price crosses below the moving average and remains below it, it is considered a bearish trend.
2. Breakthrough of key support and pressure
Buy signal: Breaking through the chip pressure or falling back without breaking the chip support, and OBV breaking through at the same time, is considered a bullish signal;
Sell signal: If the price falls below the chip support or fails to break through the chip pressure, and OBV falls below, it is considered a bearish signal.
3. Use with trading volume
a. Trading volume
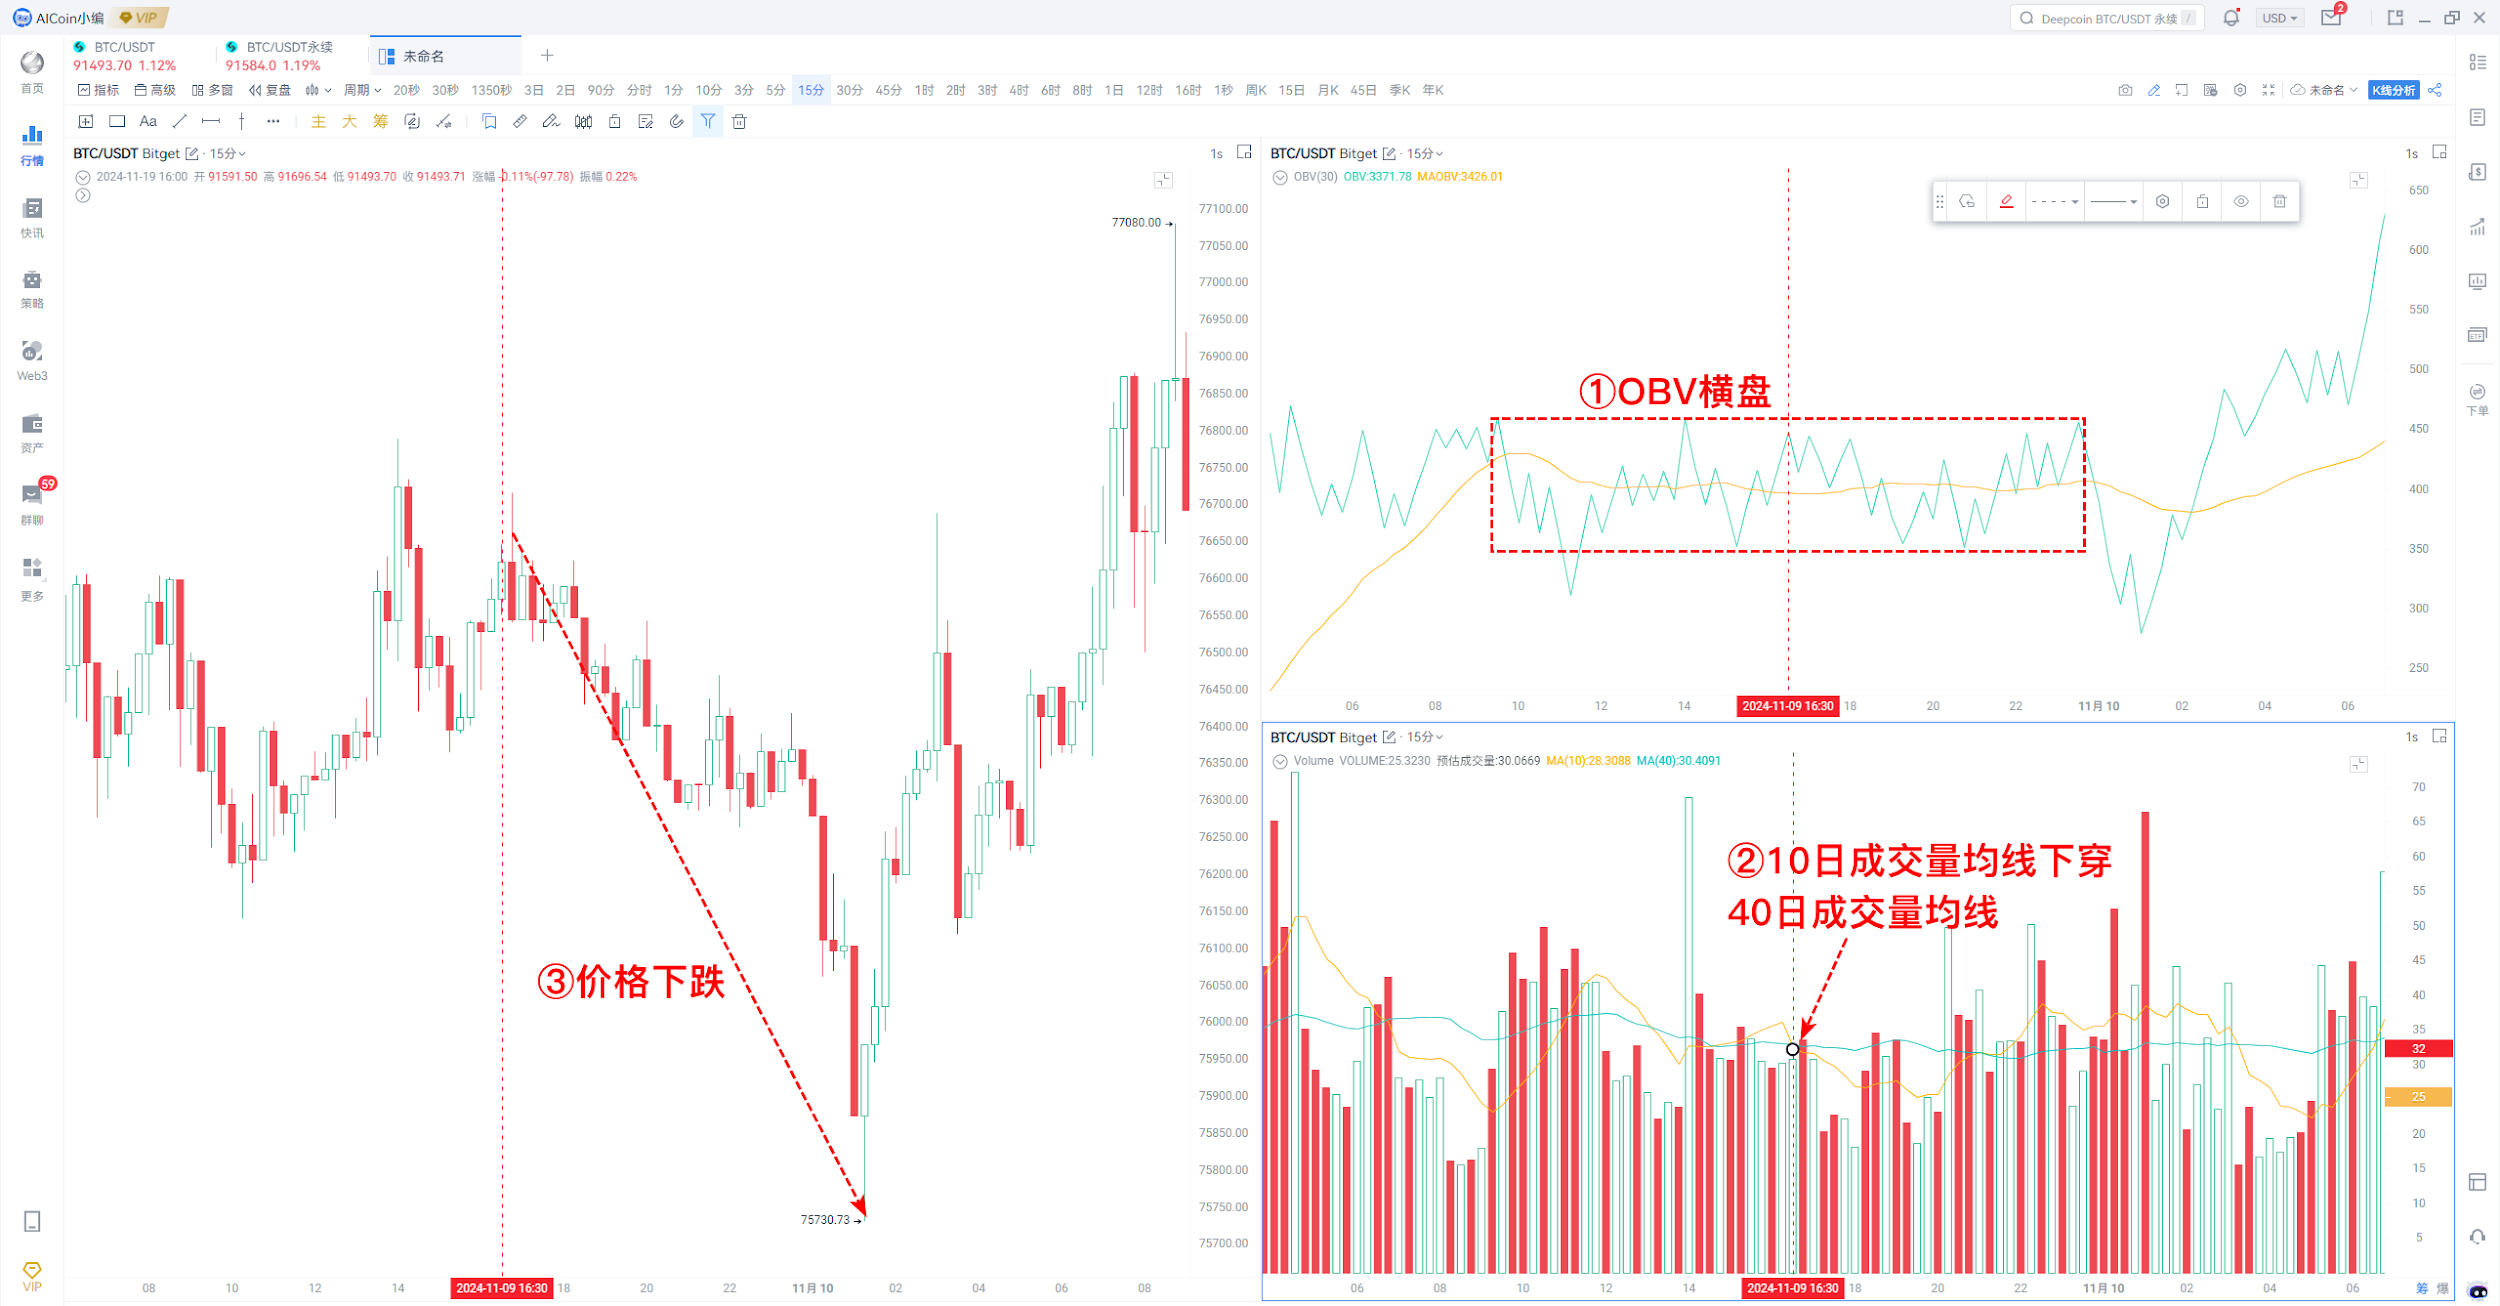
After OBV moves sideways for a period of time, it breaks through MAOBV and the trading volume increases, which is a good time to buy.
b. Volume Moving Average
The average volume line is MA 10 and MA 40, and the specific parameters can be defined according to personal habits.
Buy signal: OBV rises, and the 10-day line crosses the 40-day average volume line.
Sell signal: OBV is in a non-trending state, and the 10-day line crosses below the 40-day average volume line.
2. Escape from the top and buy from the bottom
1. Bottom-picking - OBV bottom divergence
Description: Price makes a previous low, but OBV fails to make a previous low at the same time.
Interpretation: The weakening of selling pressure and the lack of downward force in the market usually suggest that the price may reverse upward, which can be regarded as a signal. OBV has shown a strong ability in identifying bottom-picking signals. When the price is in a downward trend, if OBV appears at a low level and no longer reaches a new low, the so-called low divergence, which usually indicates that the downward momentum is weakening and the opportunity to buy at a bottom may come.
2. Escape the top - OBV top divergence
Description: Price makes a previous high, but OBV fails to make a previous high at the same time.
Interpretation: Prices are rising, but trading volume is not increasing. Bullish forces are weakening, which usually indicates that prices may pull back and can be seen as a signal to sell or reduce positions. Similar to capturing the bottom signal, when OBV reaches a new high and OBV no longer reaches a corresponding high, a high-level divergence occurs, which may indicate that the rise is weak and is a signal for investors to consider exiting. At the top of the bull market, investors are often easily driven by market sentiment, and abnormal changes in OBV can serve as a warning to help investors decide whether they need to re-evaluate their position strategy.
OBV indicator backtest
This issue uses three models for backtesting the OBV indicator:
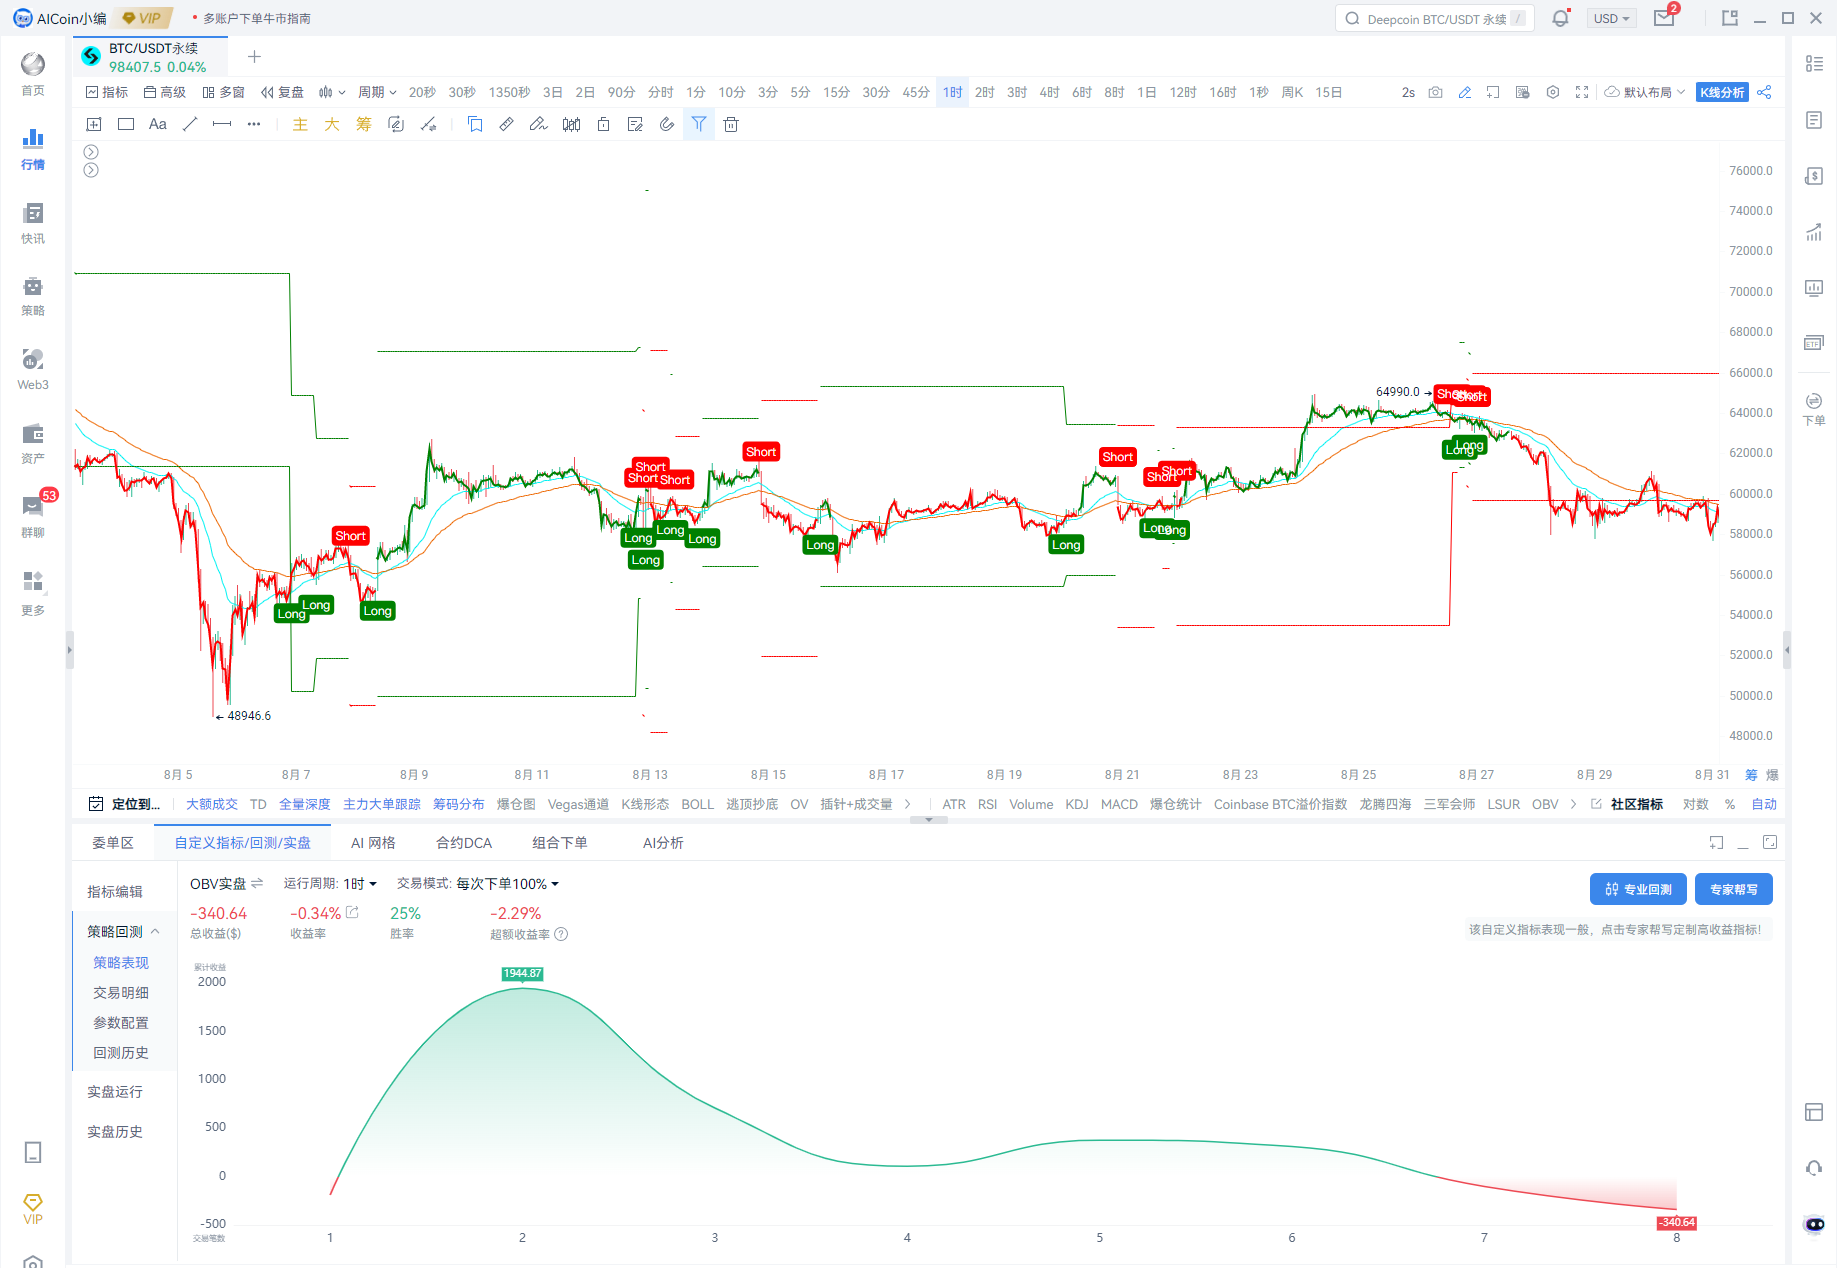
Model 1: OBV bottom-picking and top-selling signals under the 1-hour sideways oscillation cycle
Win rate 20%, yield -0.34%
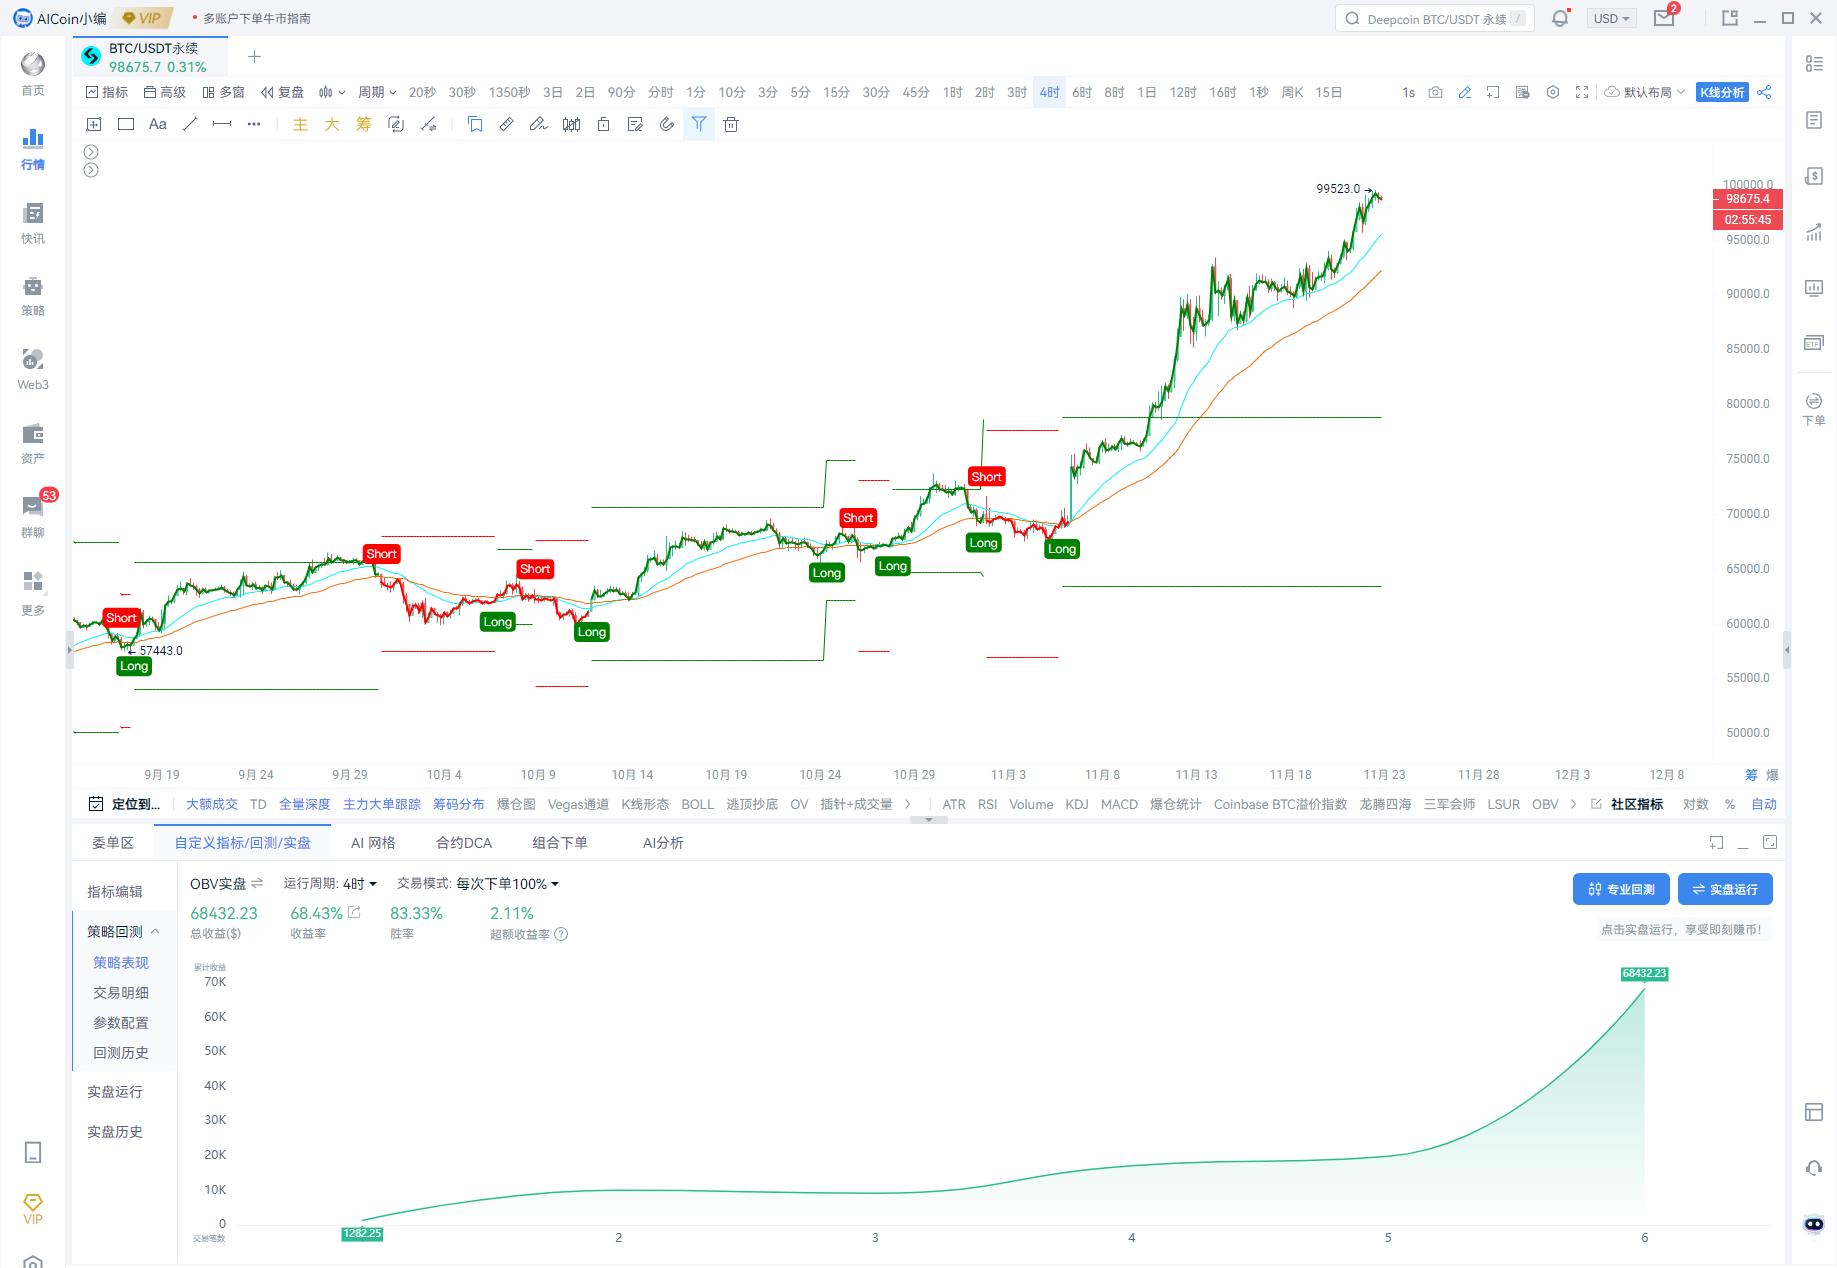
Model 2: OBV bottom-picking and top-selling signals in an uptrend with a 4-hour operating cycle
Win rate 83.33%, profit rate 68.43%
Model 3: OBV bottom-picking and top-selling signals in a downtrend with a 4-hour operating cycle
Too few items, not included in the statistics
According to AICoin backtesting, the OBV indicator is suitable for rising markets, with many signals, and relatively stable winning rate and yield rate.
Note: The underlying logic of the above strategy is based on OBV+EMA 52 moving average
4. Analysis and Summary
In summary, the OBV indicator has important application value in the dynamic cryptocurrency market. Investors should flexibly use the OBV strategy according to different market conditions:
Bottom-picking opportunity: When the price hits a new low but OBV does not hit a new low, a bottom divergence signal is formed, which indicates that the selling pressure is weakening and it is a good buying opportunity.
Time to escape the top: When the price hits a new high but OBV fails to hit a synchronous high, a top divergence signal is formed, indicating that the bullish momentum is weakening. You may consider reducing your position or closing your position to avoid potential risks.
Confirming the trend: OBV changes with the price trend up or down, which can effectively determine the strength of the market.
Through this joint research, we hope that users can master the skills of using the OBV indicator to capture bottom-picking and top-selling, and improve trading efficiency in the bull market. In the future, AICoin and Bitget will continue to cooperate to explore the application of more classic strategies, provide investors with more valuable market insights, and help them move forward steadily in the cryptocurrency market.
About AICoin OBV indicator and custom indicators
1. AICoin OBV indicator:
1. Download and log in to AICoin
2. Select the OBV indicator in the indicator library on the market K-line page.
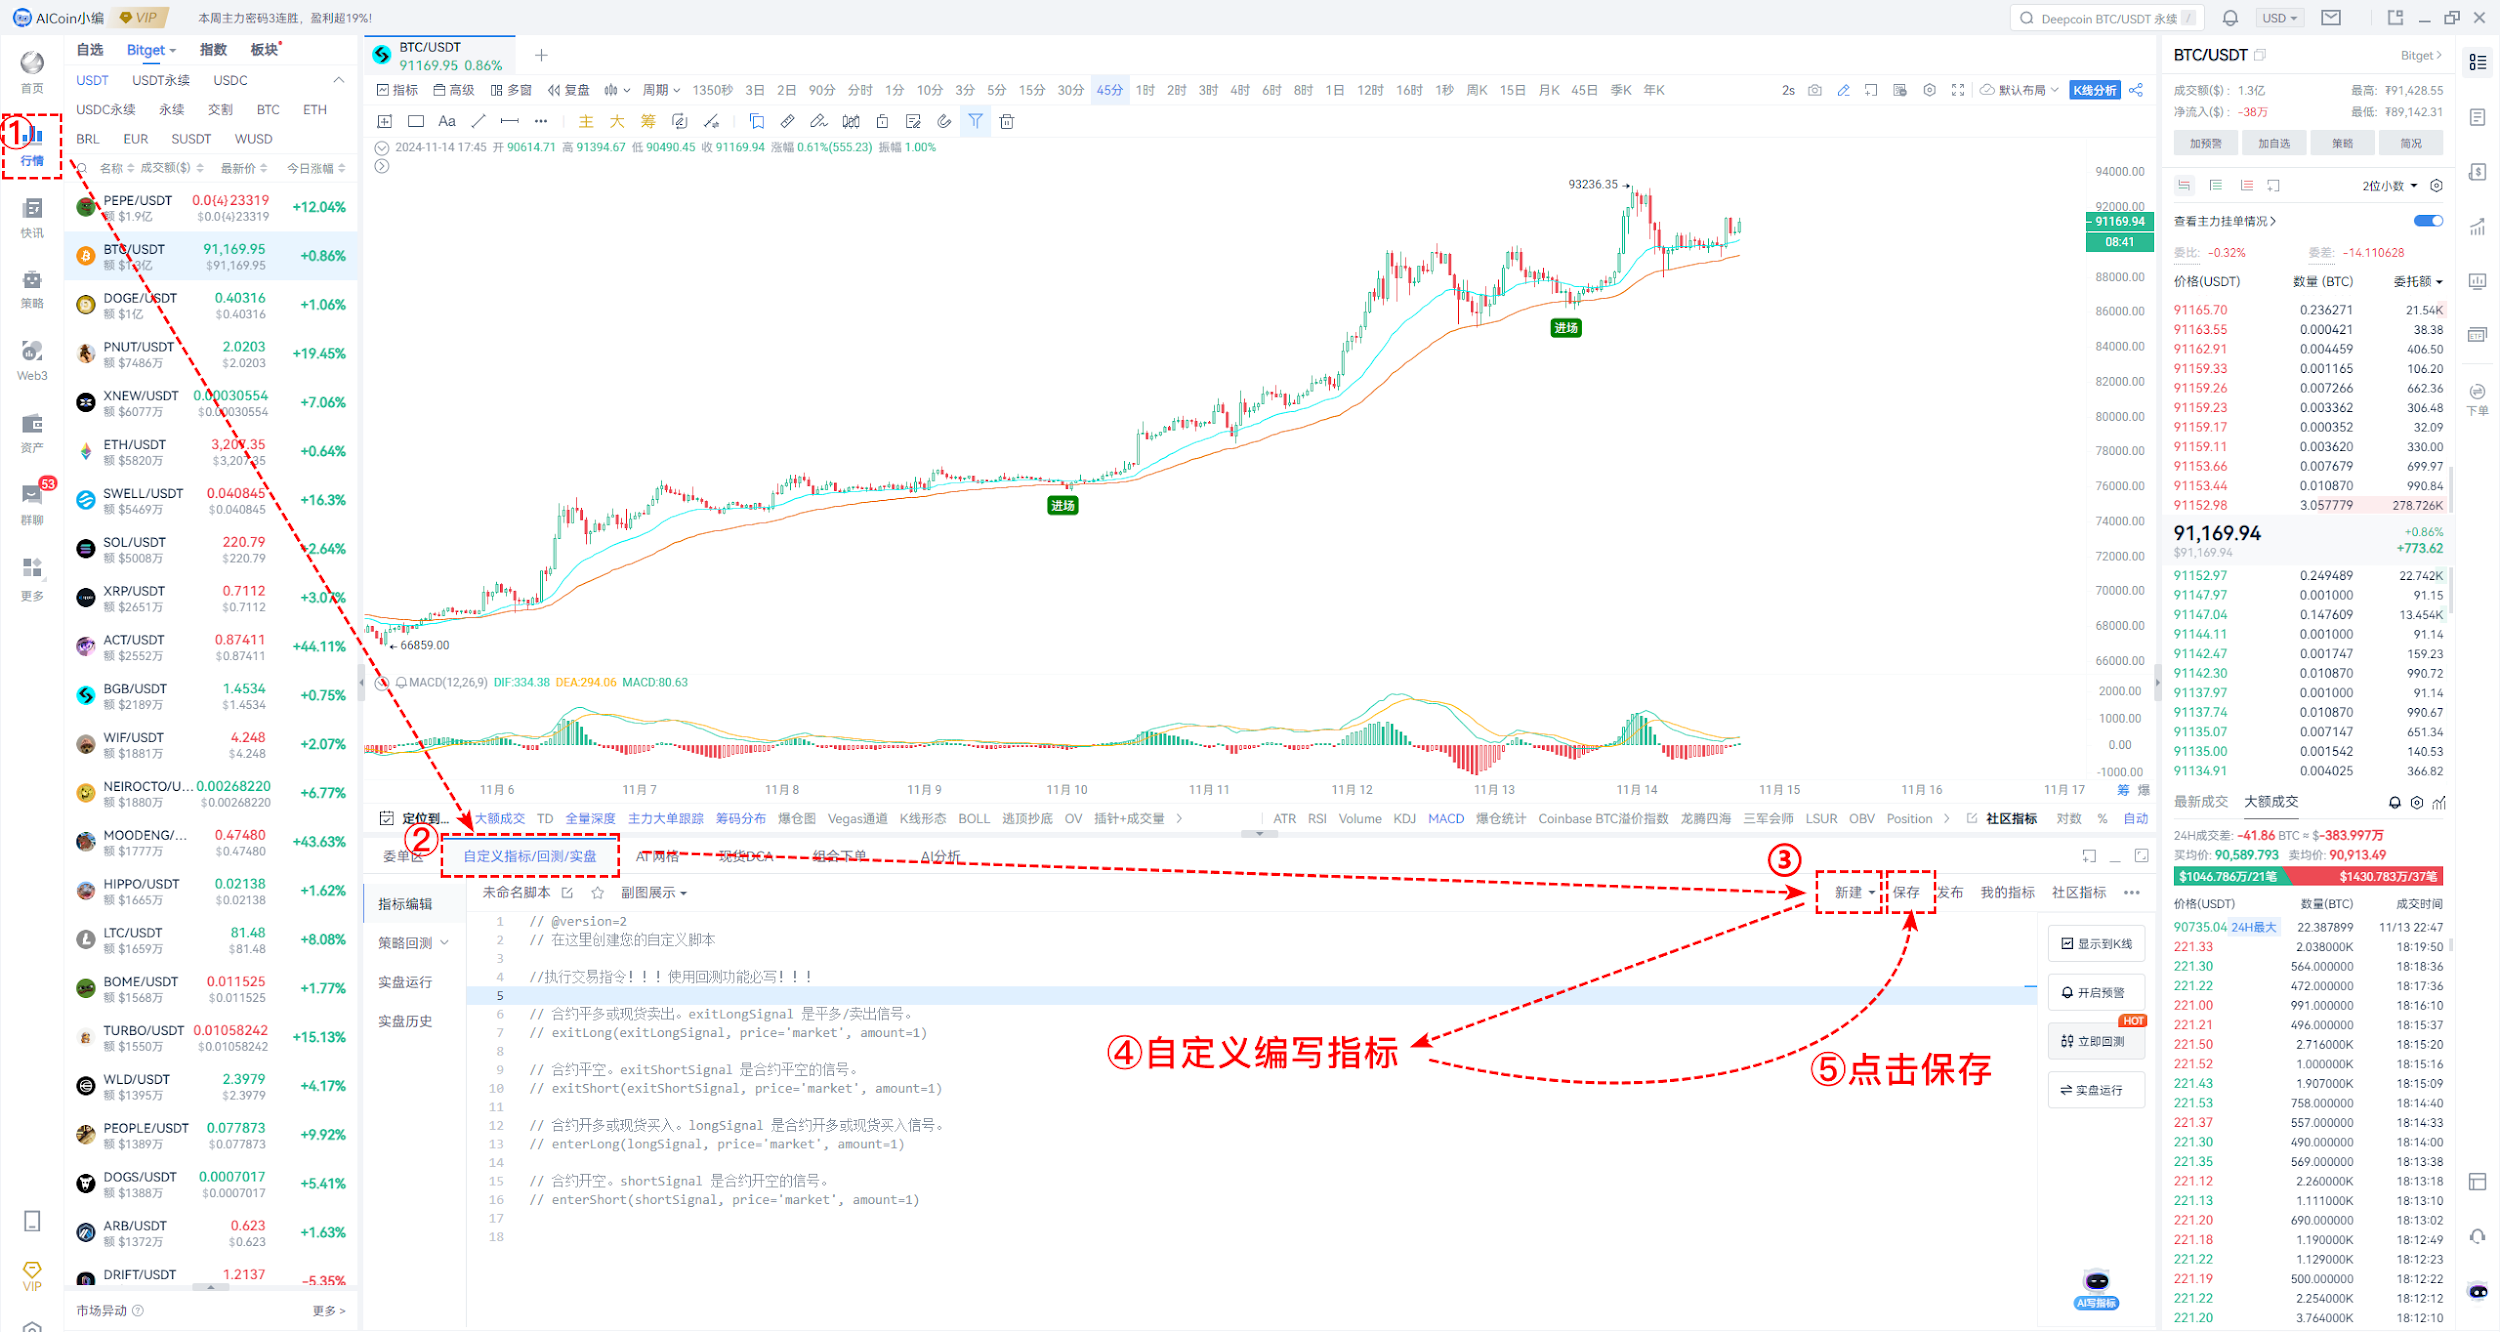
(II) AICoin custom indicators: realize quantitative trading of all Bitget currencies!
AICoins custom indicators allow users to deeply customize according to their own trading strategies and risk preferences. Whether it is tracking market trends, quantifying signals, or setting specific trading conditions, you can create indicators that meet the users unique needs through simple adjustments!
At the same time, AICoins custom indicators fully support all currencies on the Bitget platform. Whether it is mainstream currencies or emerging hot currencies, users can easily apply custom indicators for analysis and trading, ensuring that they can handle every transaction with ease.
Choose AICoin custom indicators to start your quantitative trading journey, seize every market opportunity, and achieve more efficient returns on investment!
About Bitget OBV indicator and copy trading products
1. Bitget OBV indicator
1. Download and log in to Bitget
2. Switch to OBV at the bottom of the market K-line page. This indicator can be viewed on both the web and mobile terminals.
(II) About Bitgets copy trading products: No fear of market changes, accurately grasp the long and short trends
Bitget is the first cryptocurrency trading platform to introduce copy trading, which was officially launched in May 2020. Currently, Bitget supports spot copy trading and contract copy trading. New traders can view the investment portfolios and historical performance of trading experts, choose to subscribe to strategies that meet their return expectations and risk preferences, and gather top trading experts to share strategies. The platform has more than 180,000 trading experts and 800,000 copy traders, with more than 90 million successful transactions.
Disclaimer
This article is for information sharing only and represents the authors personal views only, not Bitget and AICoins position. We do not provide any form of trading advice, including but not limited to specific investment recommendations, digital asset buying and selling advice, or financial, legal and tax guidance. The information presented may be inaccurate or incomplete, so please carefully assess the relevant risks before investing. The trading and holding of digital assets may face drastic price fluctuations, so be sure to carefully consider whether to participate based on your personal financial situation.


