

CoinW Research Weekly Report (Issue 2026.4.6 - 2026.4.12)

Key Takeaways
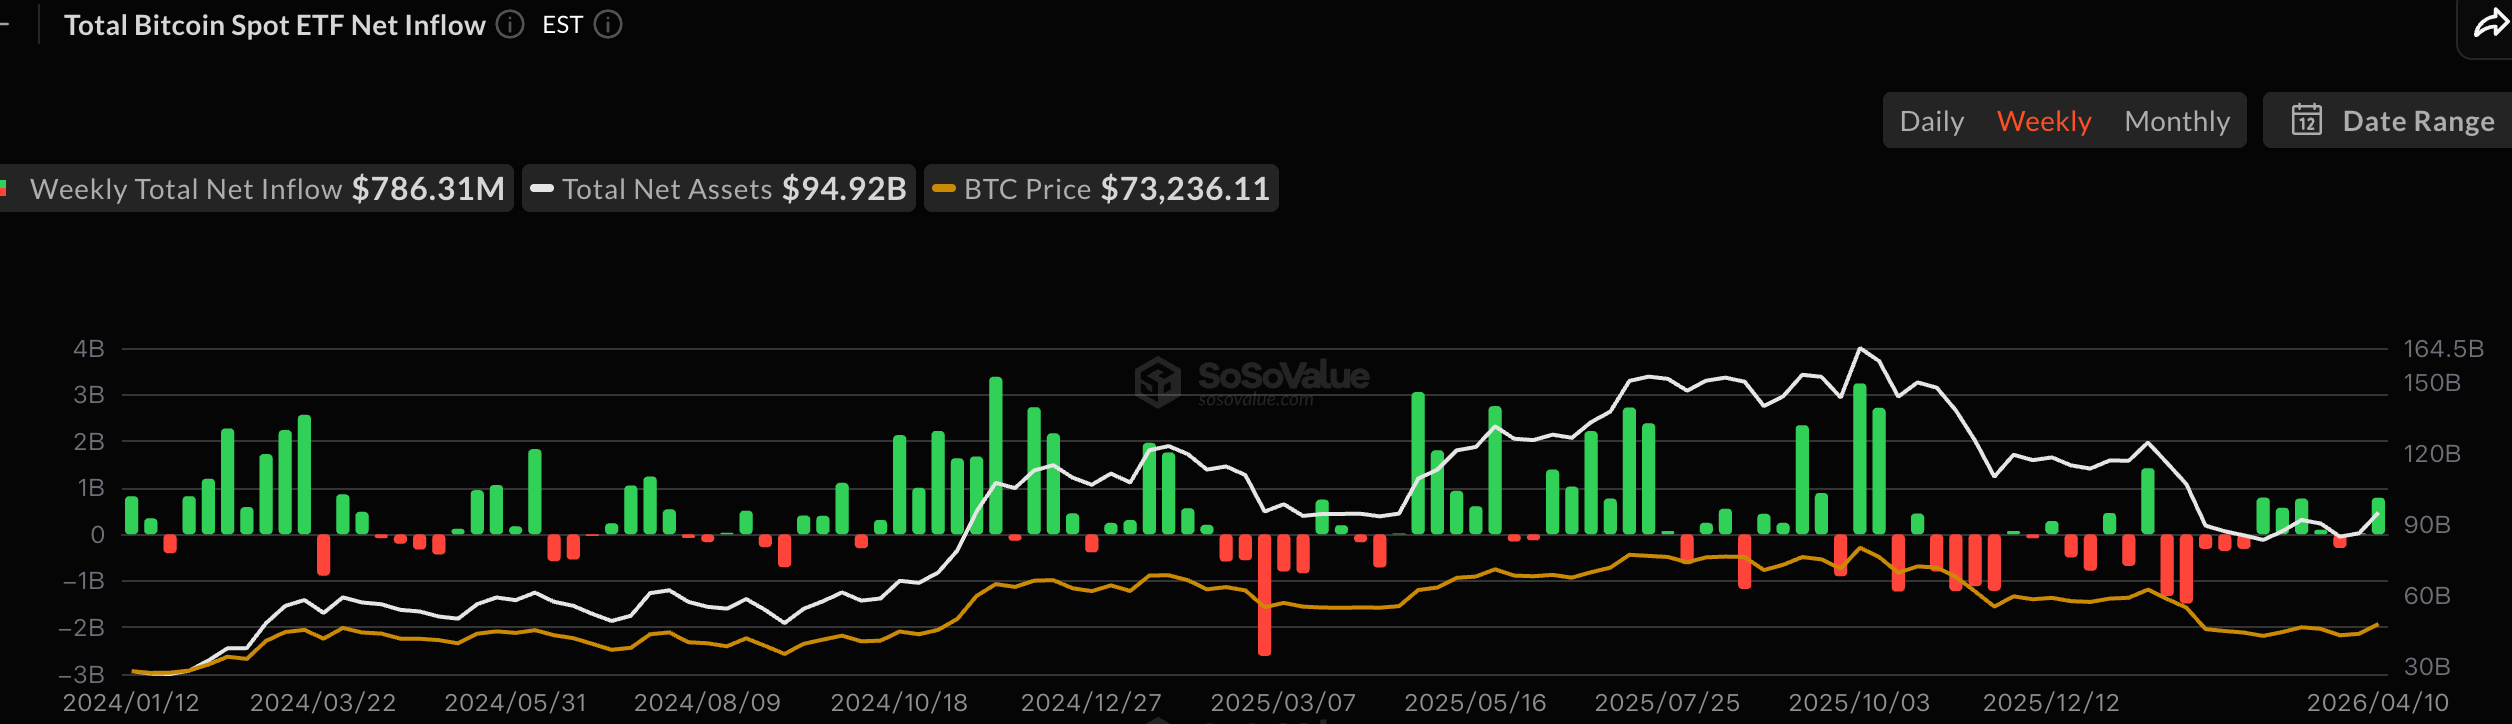
The total global cryptocurrency market capitalization is $2.49 trillion, up approximately 1.63% this week from $2.45 trillion last week. As of press time, the cumulative total net inflow for U.S. Bitcoin spot ETFs is approximately $56.74 billion, with a net inflow of $786 million this week; the cumulative total net inflow for U.S. Ethereum spot ETFs is approximately $11.67 billion, with a net inflow of $187 million this week.
The total stablecoin market capitalization is $310.3 billion, up about 0.12% from $309.9 billion last week. Among them, USDT's market cap is $184.43 billion, accounting for 59.44% of the total stablecoin market cap, up 0.19% from $184.07 billion last week; followed by USDC with a market cap of $78.6 billion, accounting for 25.33% of the total stablecoin market cap, up about 1.41% from $77.5 billion last week; DAI's market cap is $5.36 billion, accounting for 1.75% of the total stablecoin market cap, unchanged from last week.
According to data from DeFiLlama, the total DeFi TVL this week is $94.871 billion, up about 0.36% from $94.524 billion last week. Divided by public chain, the three public chains with the highest TVL are Ethereum, accounting for 56.69%; Solana, accounting for 6.02%; and BNB Chain, accounting for 5.64%.
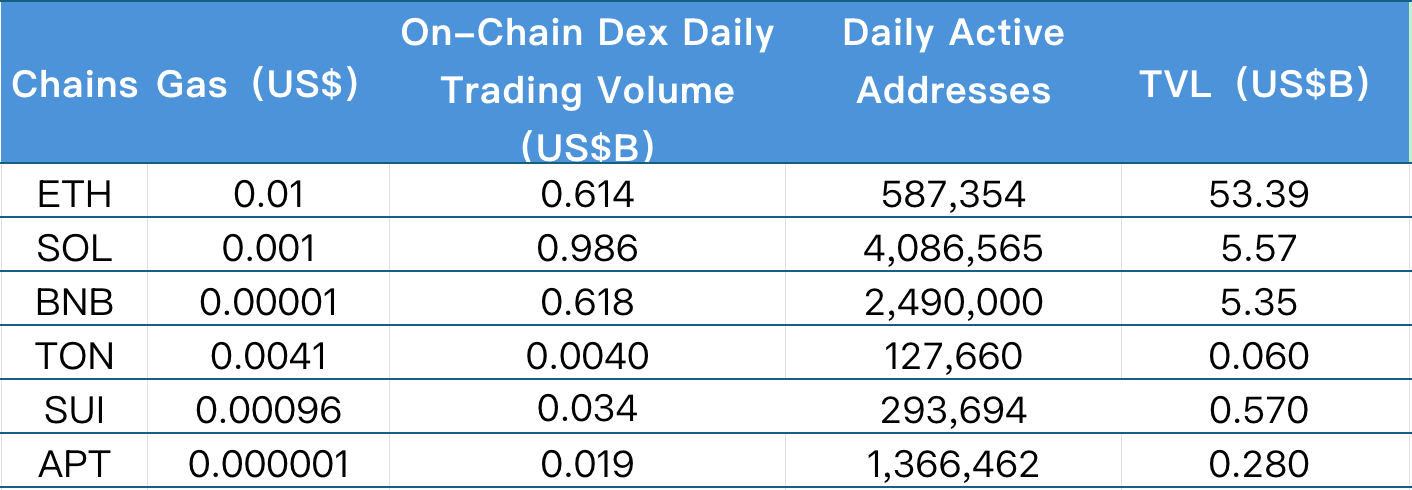
On-chain data showed some recovery this week. In terms of daily on-chain DEX trading volume, Solana continues to lead with $0.986B, followed by BNB Chain ($0.618B) and Ethereum ($0.614B), while Ton saw the most significant growth, reaching $0.004B (+226.83%). Regarding transaction fees, Ethereum ($0.01) and BNB Chain ($0.00001) remained largely stable, Ton increased to $0.0033 (+24.64%), while Solana ($0.001, -86.30%) and Sui ($0.00096, -41.89%) declined. In terms of daily active on-chain users, Solana leads with 4.086 million daily active users, followed by BNB Chain (2.49 million), with Aptos (1.366 million) showing the largest increase (+57.48%). Ethereum (587k) and Ton (127k) also saw growth. Overall TVL changes were minimal, with only Ton ($0.06B, +9.64%) and Aptos ($0.28B, +4.03%) showing some improvement.
New Projects to Watch: Enhanced Finance is a next-generation on-chain structured products infrastructure platform focused on providing yield enhancement solutions for users' crypto assets. NanoVita is a decentralized science (DeSci) platform that combines nanotechnology, AI biointelligence, and real-world assets, aiming to revolutionize health research. Splyce Finance is a decentralized finance protocol on the Solana ecosystem dedicated to providing real yield from real-world assets.
Table of Contents
Key Takeaways
I. Market Overview
1. Total Cryptocurrency Market Cap / Bitcoin Dominance
2. Fear & Greed Index
3. ETF Inflow/Outflow Data
4. ETH/BTC and ETH/USD Exchange Rate
5. Decentralized Finance (DeFi)
6. On-Chain Data
7. Stablecoin Market Cap and Issuance
II. This Week's Hot Money Trends
1. Top 5 Gaining VC Coins and Meme Coins This Week
2. New Project Insights
III. Industry News
1. Major Industry Events This Week
2. Upcoming Major Events Next Week
3. Important Fundraising from Last Week
IV. Reference Links
I. Market Overview
1. Total Cryptocurrency Market Cap / Bitcoin Dominance
The global total cryptocurrency market cap is $2.49 trillion, up approximately 1.63% this week from $2.45 trillion last week.
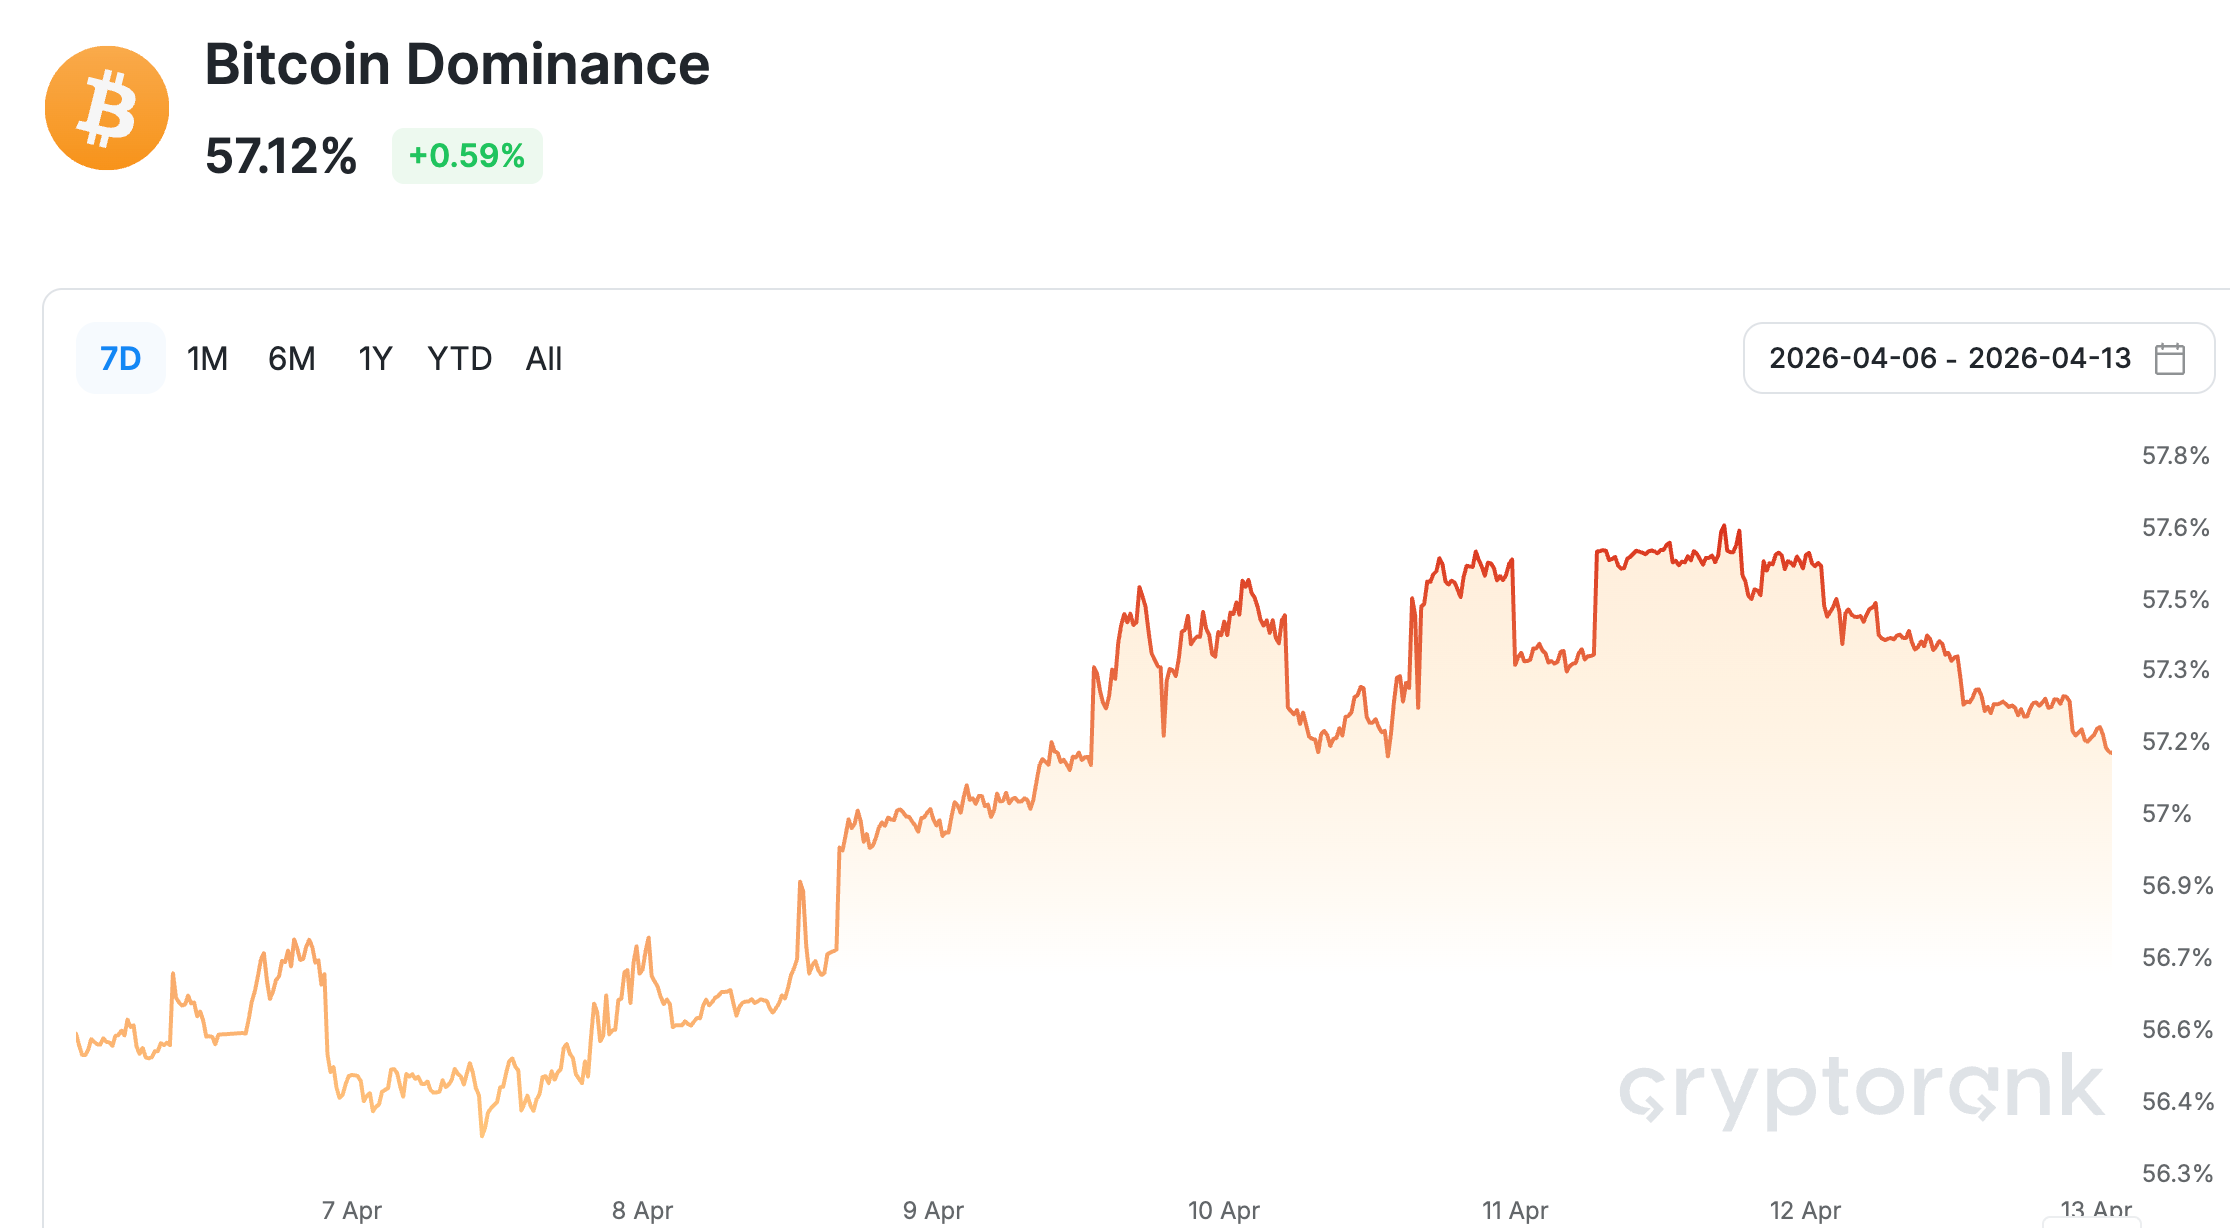
Data Source: Bitcoin dominance from cryptorank, https://cryptorank.io/charts/btc-dominance
Data as of April 12, 2026
As of press time, Bitcoin's market cap is $1.42 trillion, accounting for 57.02% of the total cryptocurrency market cap. Meanwhile, the stablecoin market cap is $310.3 billion, accounting for 12.46% of the total cryptocurrency market cap.
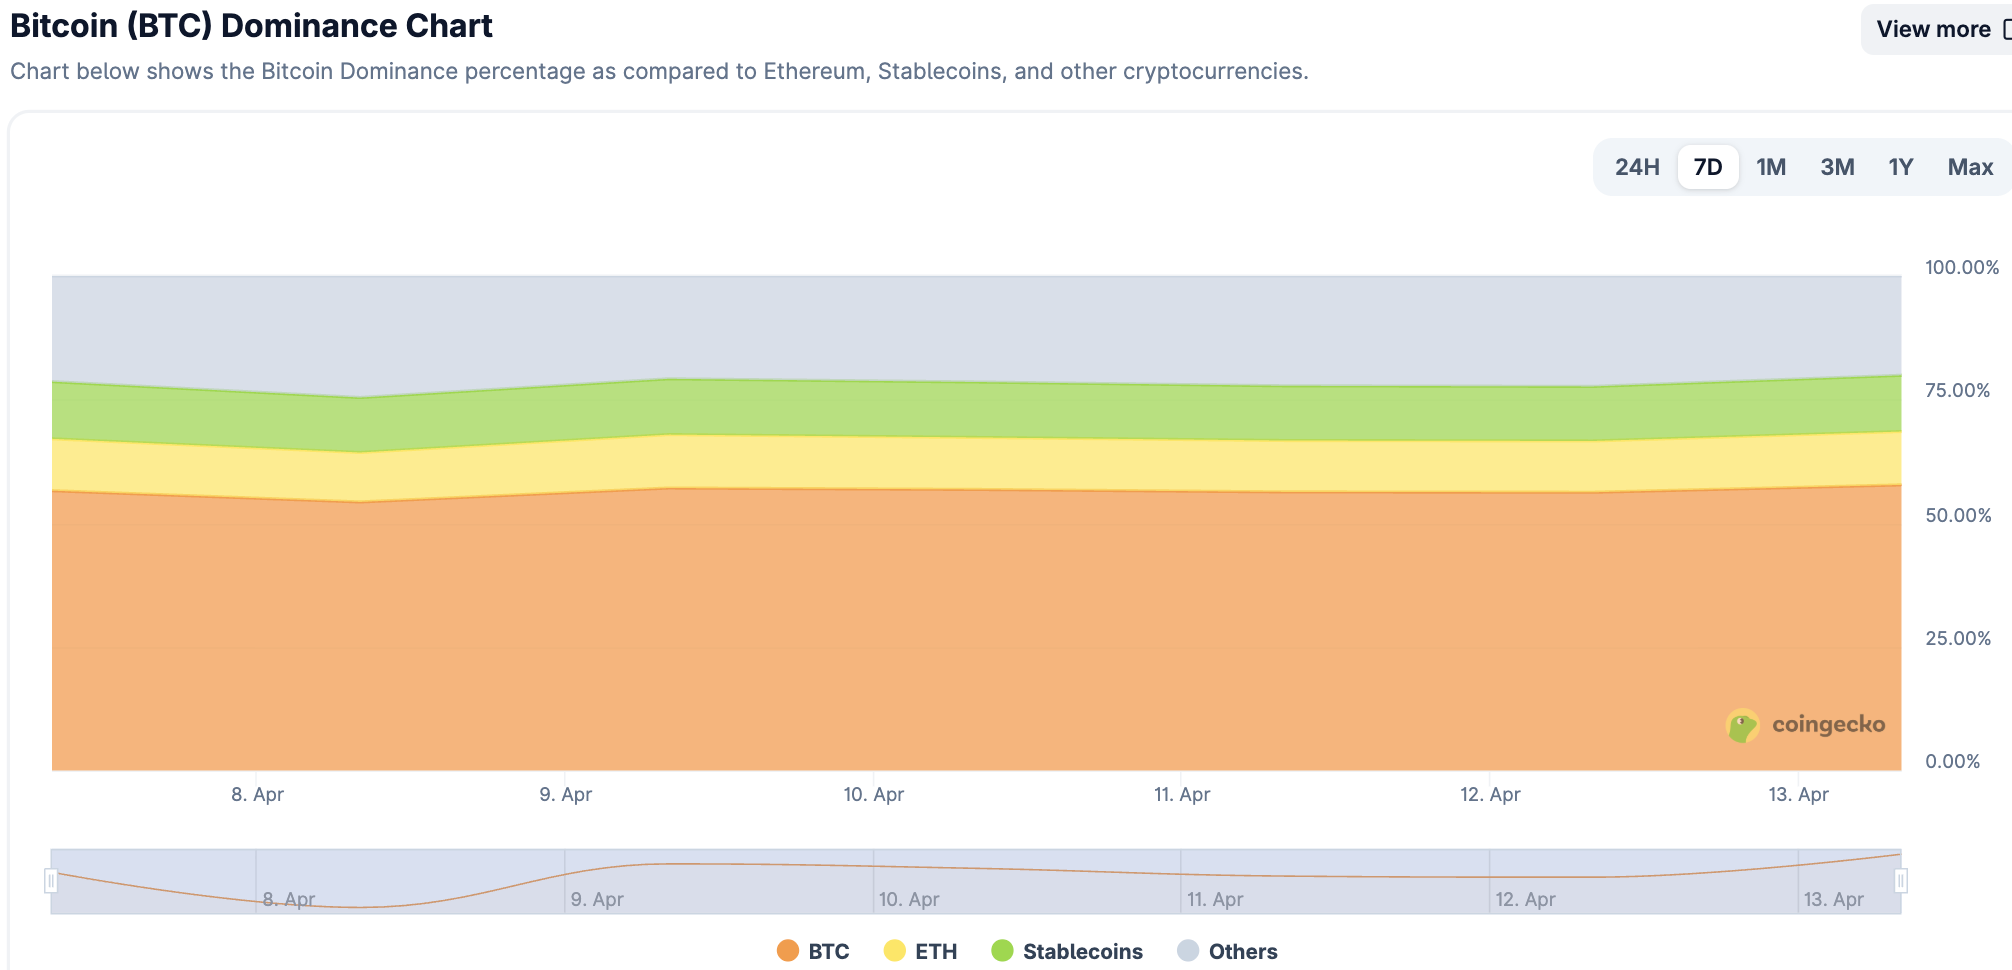
Data Source: coingecko, https://www.coingecko.com/en/charts
Data as of April 12, 2026
2. Fear & Greed Index
The Crypto Fear & Greed Index is 13, indicating Extreme Fear.
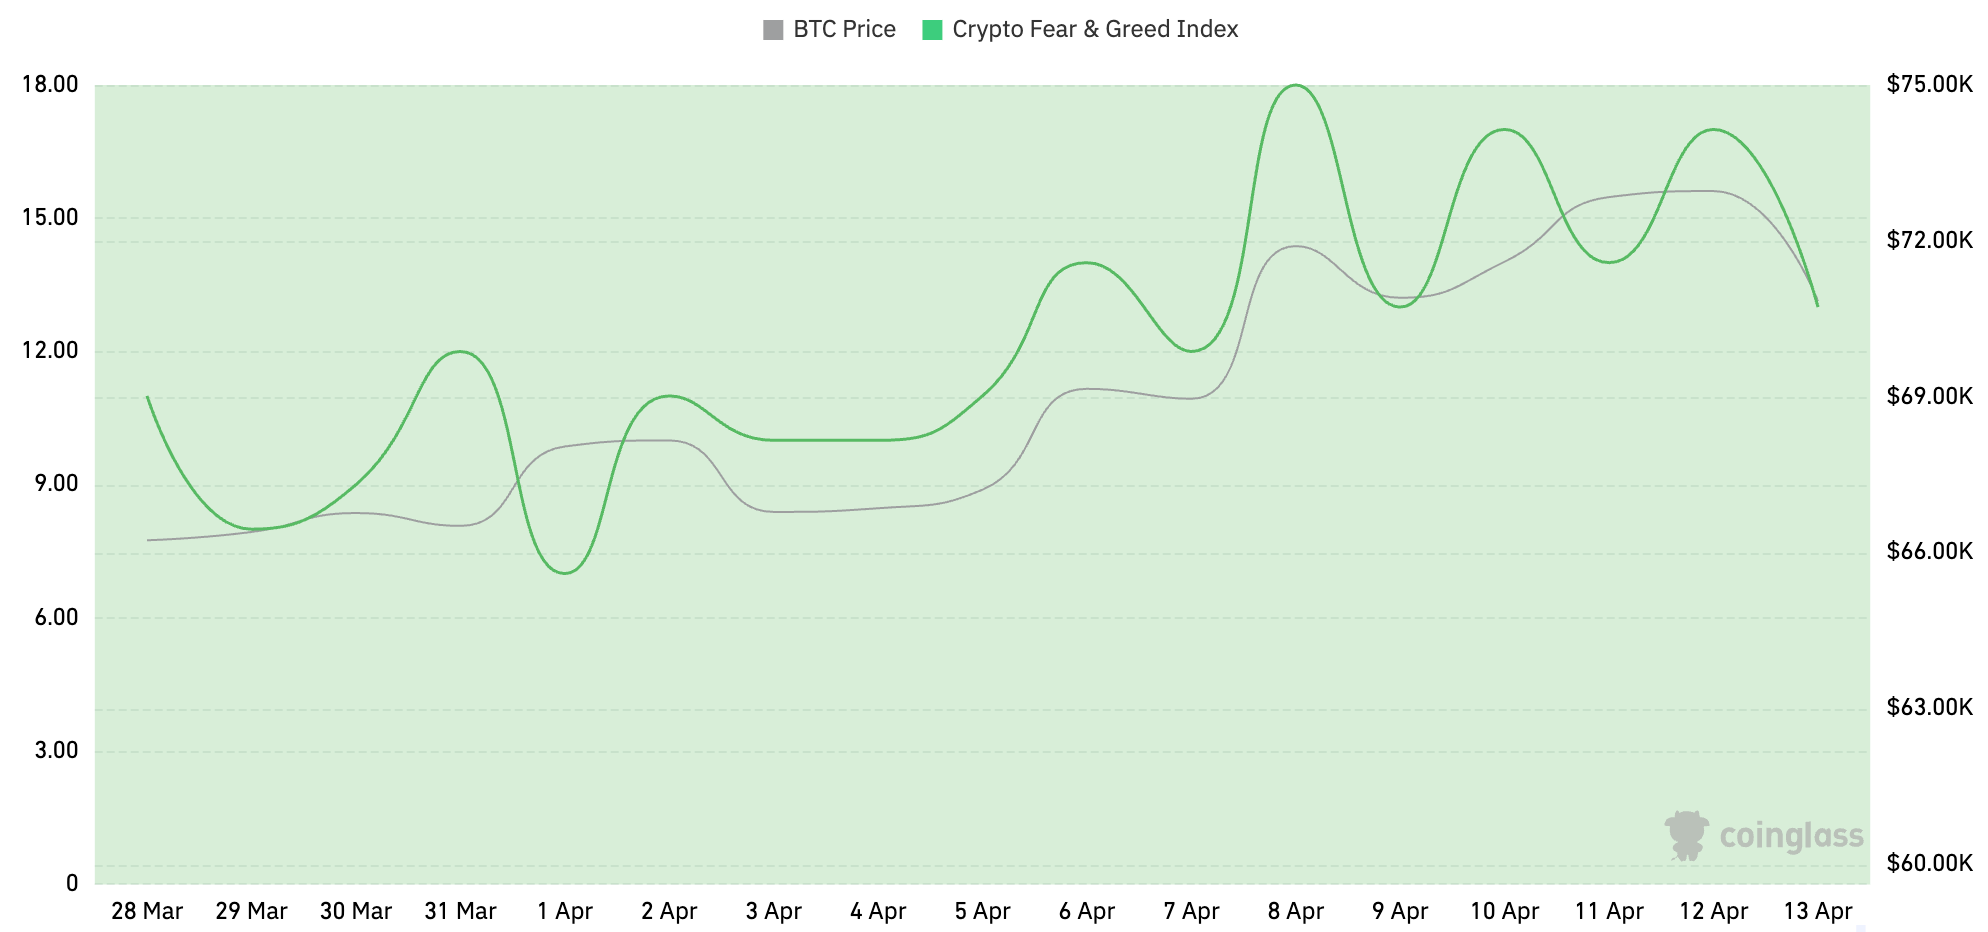
Data Source: coinglass, https://www.coinglass.com/pro/i/FearGreedIndex
Data as of April 12, 2026
3. ETF Inflow/Outflow Data
As of press time, the cumulative total net inflow for U.S. Bitcoin spot ETFs is approximately $56.74 billion, with a net inflow of $786 million this week; the cumulative total net inflow for U.S. Ethereum spot ETFs is approximately $11.67 billion, with a net inflow of $187 million this week.
Data Source: sosovalue, https://sosovalue.com/zh/assets/etf
Data as of April 12, 2026
4. ETH/BTC and ETH/USD Exchange Rate
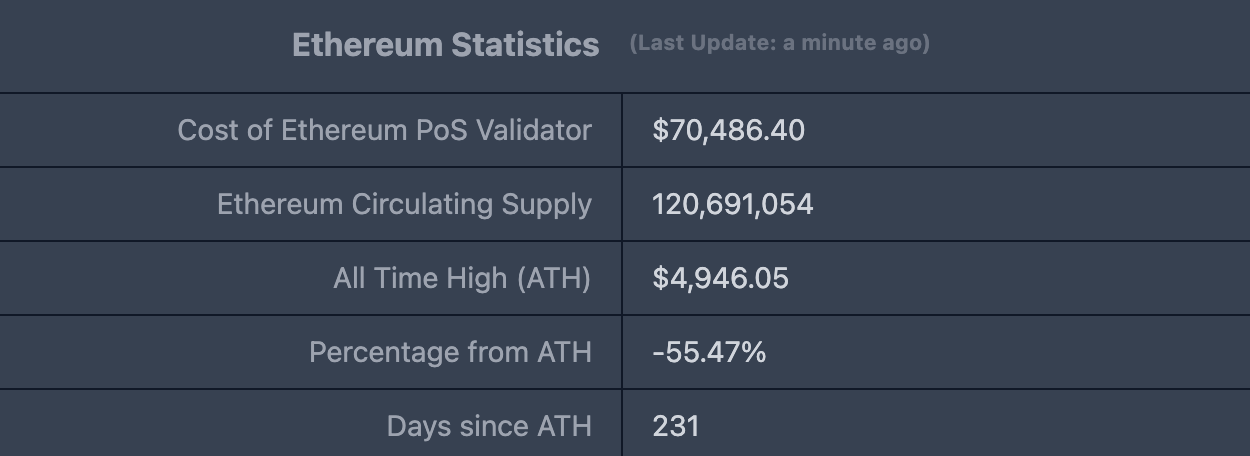
ETHUSD: Current price $2,202.53, all-time high $4,946.05, down approximately 55.48% from the high.
ETHBTC: Currently 0.030972, all-time high 0.1238
Data Source: ratiogang, https://ratiogang.com/
Data as of April 12, 2026
5. Decentralized Finance (DeFi)
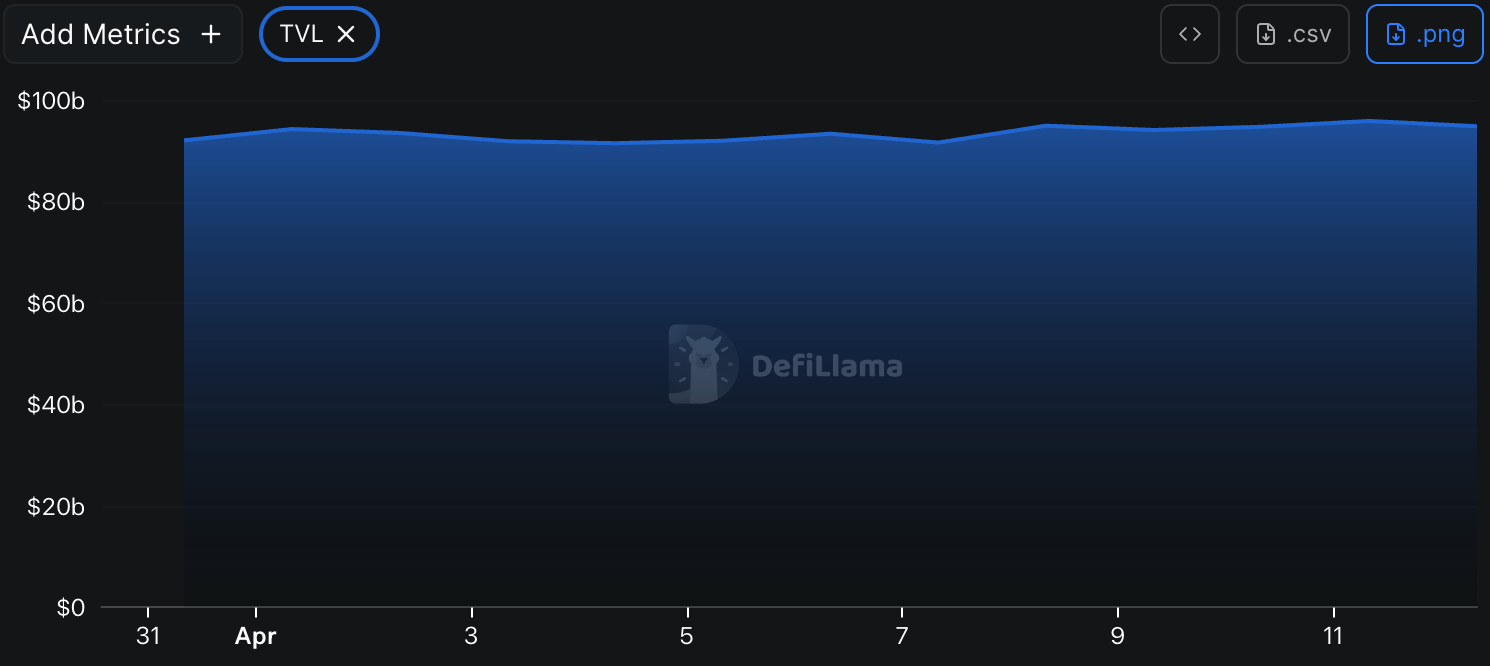
According to data from DeFiLlama, the total DeFi TVL this week is $94.871 billion, up about 0.36% from $94.524 billion last week.
Data Source: defillama, https://defillama.com
Data as of April 12, 2026
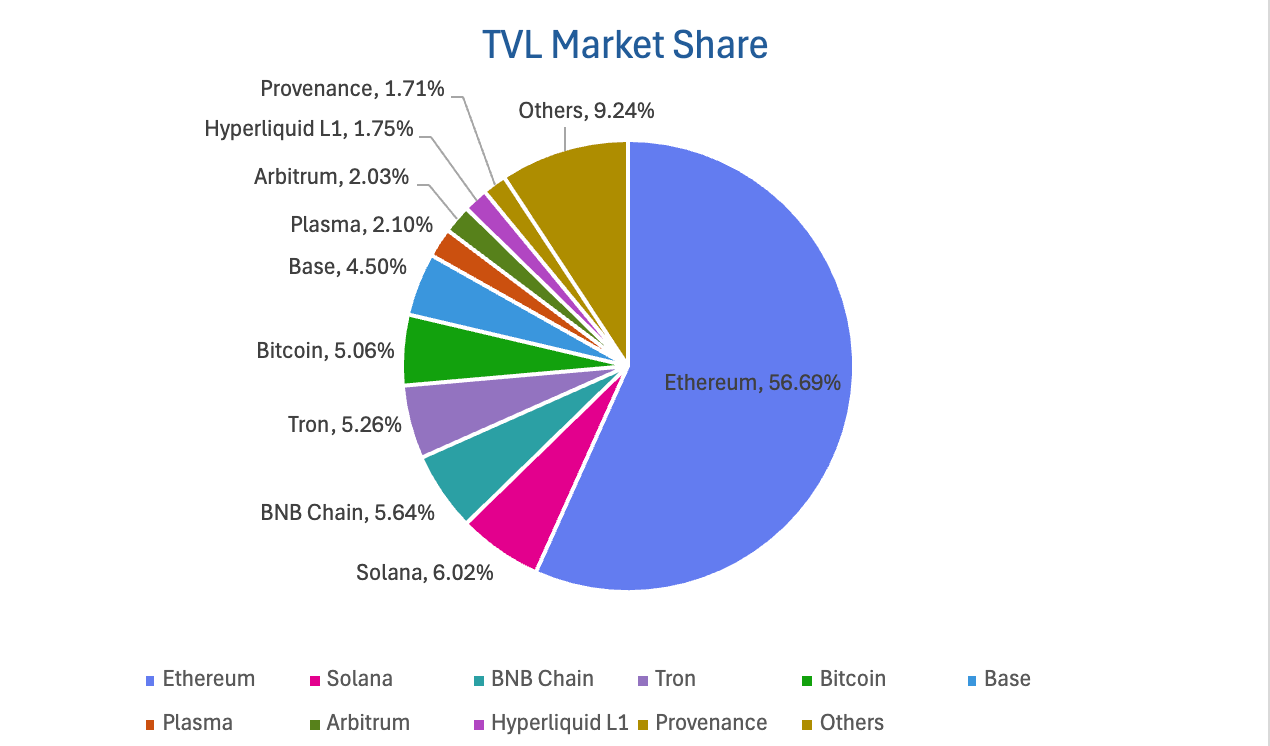
Divided by public chain, the three public chains with the highest TVL are Ethereum, accounting for 56.69%; Solana, accounting for 6.02%; and BNB Chain, accounting for 5.64%.
Data Source: CoinW Research Institute, defillama, https://defillama.com
Data as of April 12, 2026
6. On-Chain Data
Layer 1 Related Data
This section analyzes key data for major Layer 1s including ETH, SOL, BNB, TON, SUI, and APTOS, focusing on daily trading volume, daily active addresses, and transaction fees.
Data Source: CoinW Research Institute, defillama, https://defillama.com
Data as of April 12, 2026
On-Chain DEX Daily Volume and Transaction Fees: On-chain DEX daily volume and transaction fees are core metrics for measuring public chain activity and user experience. In terms of on-chain DEX daily volume this week, Ton ($0.004B) performed exceptionally well, rising 226.83%; other chains saw varying degrees of increase: BNB Chain ($0.618B, +17.05%), Sui ($0.034B, +11.08%), Ethereum ($0.614B, +9.06%), Solana ($0.986B, +7.17%), and Aptos ($0.019B, +4.00%). Regarding transaction fees, Ethereum ($0.01) and BNB Chain ($0.00001) remained largely unchanged from last week; Ton ($0.0033) increased by 24.64%; other chains declined: Solana ($0.001, -86.30%), Sui ($0.00096, -41.89%), and Aptos ($0.000001, -4.65%).
Daily Active Addresses and TVL: Daily active addresses reflect the ecosystem participation and user stickiness of a public chain, while TVL reflects user trust in the platform. In terms of daily active addresses, all chains saw a recovery this week. Aptos (1.366 million) led with a 57.48% increase; followed by Ethereum (587k) and Ton (127k), rising 28.86% and 21.71% respectively; BNB Chain (2.49 million), Sui (293k), and Solana (4.086 million) corrected by 1%-4%. Regarding TVL, Ton ($0.06B) rose 9.64%; Aptos ($0.28B) rose 4.03%; changes on other chains were minimal compared to last week.
Layer 2 Related Data
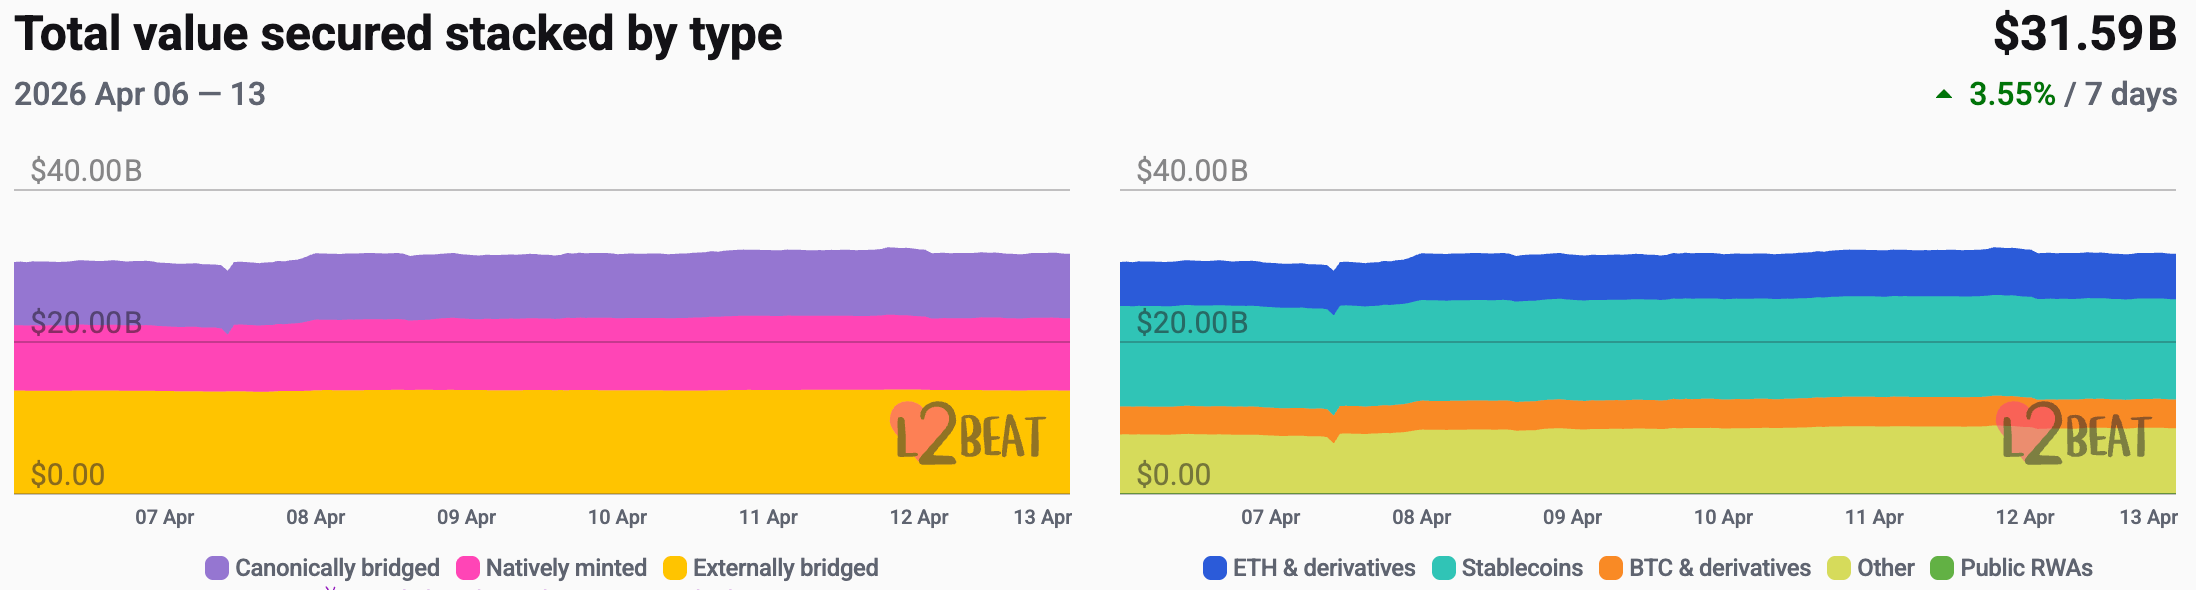
According to L2Beat data, the total TVL for Ethereum Layer 2 this week is $31.59 billion, up 2.89% from $30.70 billion last week.
Data Source: L2Beat, https://l2beat.com/scaling/tvs
Data as of April 12, 2026
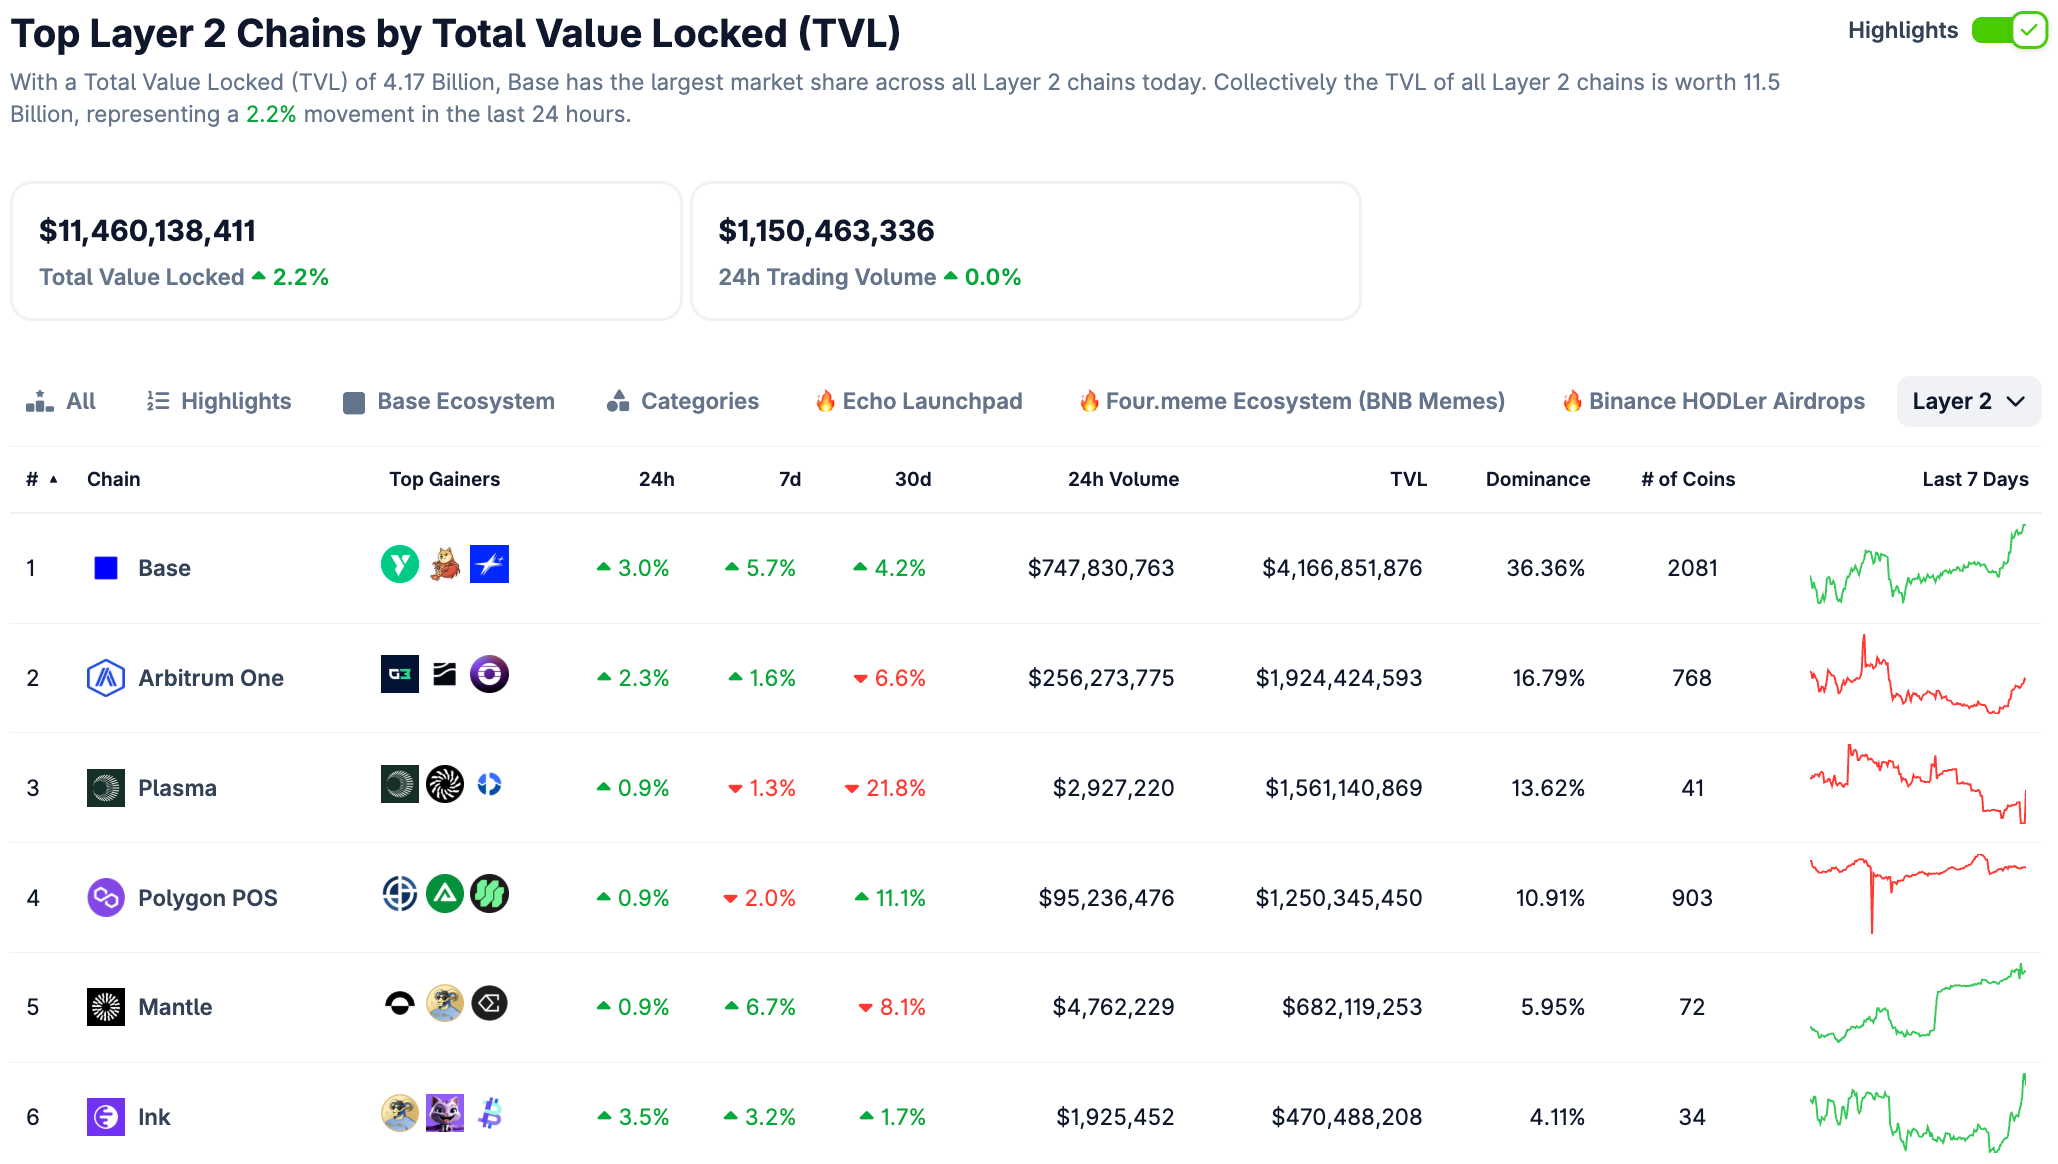
This week, Base and Arbitrum hold market shares of 35.60% and 16.58% respectively, ranking first and second.
Data Source: CoinGecko, https://www.coingecko.com/en/chains/layer-2
Data as of April 12, 2026
7. Stablecoin Market Cap and Issuance
According to Coinglass data, the total stablecoin market capitalization is $310.3 billion, up about 0.12% from $309.9 billion last week. Among them, USDT's market cap is $184.43 billion, accounting for 59.44% of the total stablecoin market cap, up 0.19% from $184.07 billion last week; followed by USDC with a market cap of $78.6 billion, accounting for 25.33% of the total stablecoin market cap, up about 1.41% from $77.5 billion last week; DAI's market cap is $5.36 billion, accounting for 1.75% of the total stablecoin market cap, unchanged from last week.