

Fed Rate Hikes Meet Record Highs: What Really Drives US Stocks?

Original title: History Says Investors Should Not Fear Fed Rate Hikes or Record Highs
Original author: Phil Rosen, Opening Bell Daily
Editor's note: On September 16, the Federal Reserve raised the target range for the federal funds rate by 25 basis points to 3.75%-4.00%, an important step after this policy cycle shifted back toward rate hikes. A few days later, US tech stocks quickly recovered their losses, and the Nasdaq Composite Index hit a fresh record high again on September 22. A seemingly contradictory combination thus emerged: monetary policy is tightening, yet the stock market is simultaneously sitting at record highs.
The most instinctive conclusion the market draws is that rate hikes mean valuation pressure, while record highs mean upside room is shrinking. But in Opening Bell Daily, Phil Rosen offers another interpretation: neither rate hikes nor new highs can be understood in isolation from the economic environment at the time.
Citing historical data, he points out that since 1982, the average 12-month return for the S&P 500 after Fed rate hikes has actually been higher than after rate cuts; and over a longer horizon, the subsequent performance of buying stocks near record highs has not been significantly weaker than on other trading days.
This set of data does not mean that "rate hikes are bullish for US stocks," nor can it prove that the current market will definitely continue to rise. What it truly challenges is another, simpler trading logic: "Fed rate hike" or "index hits record high" alone is not enough to justify a bearish view on the market. What really needs to be judged is why the Fed is hiking now, and whether the earnings and economic conditions supporting the stock market's rise still exist.
Below is the translated original text:
The Federal Reserve just raised rates, yet US stocks once again climbed to record highs.
On September 16, the Federal Reserve raised the target range for the federal funds rate by 25 basis points to 3.75%-4.00%. In its statement, the FOMC said US economic activity continued to expand at a "moderate pace," domestic spending remained resilient, capital investment was strong, and inflation remained elevated.
Less than a week later, the US tech sector regained strength. On September 22, the Nasdaq Composite Index set a new record. Reuters that day linked the rebound to multiple factors including strength in tech stocks, renewed momentum in AI trading, and falling oil prices.
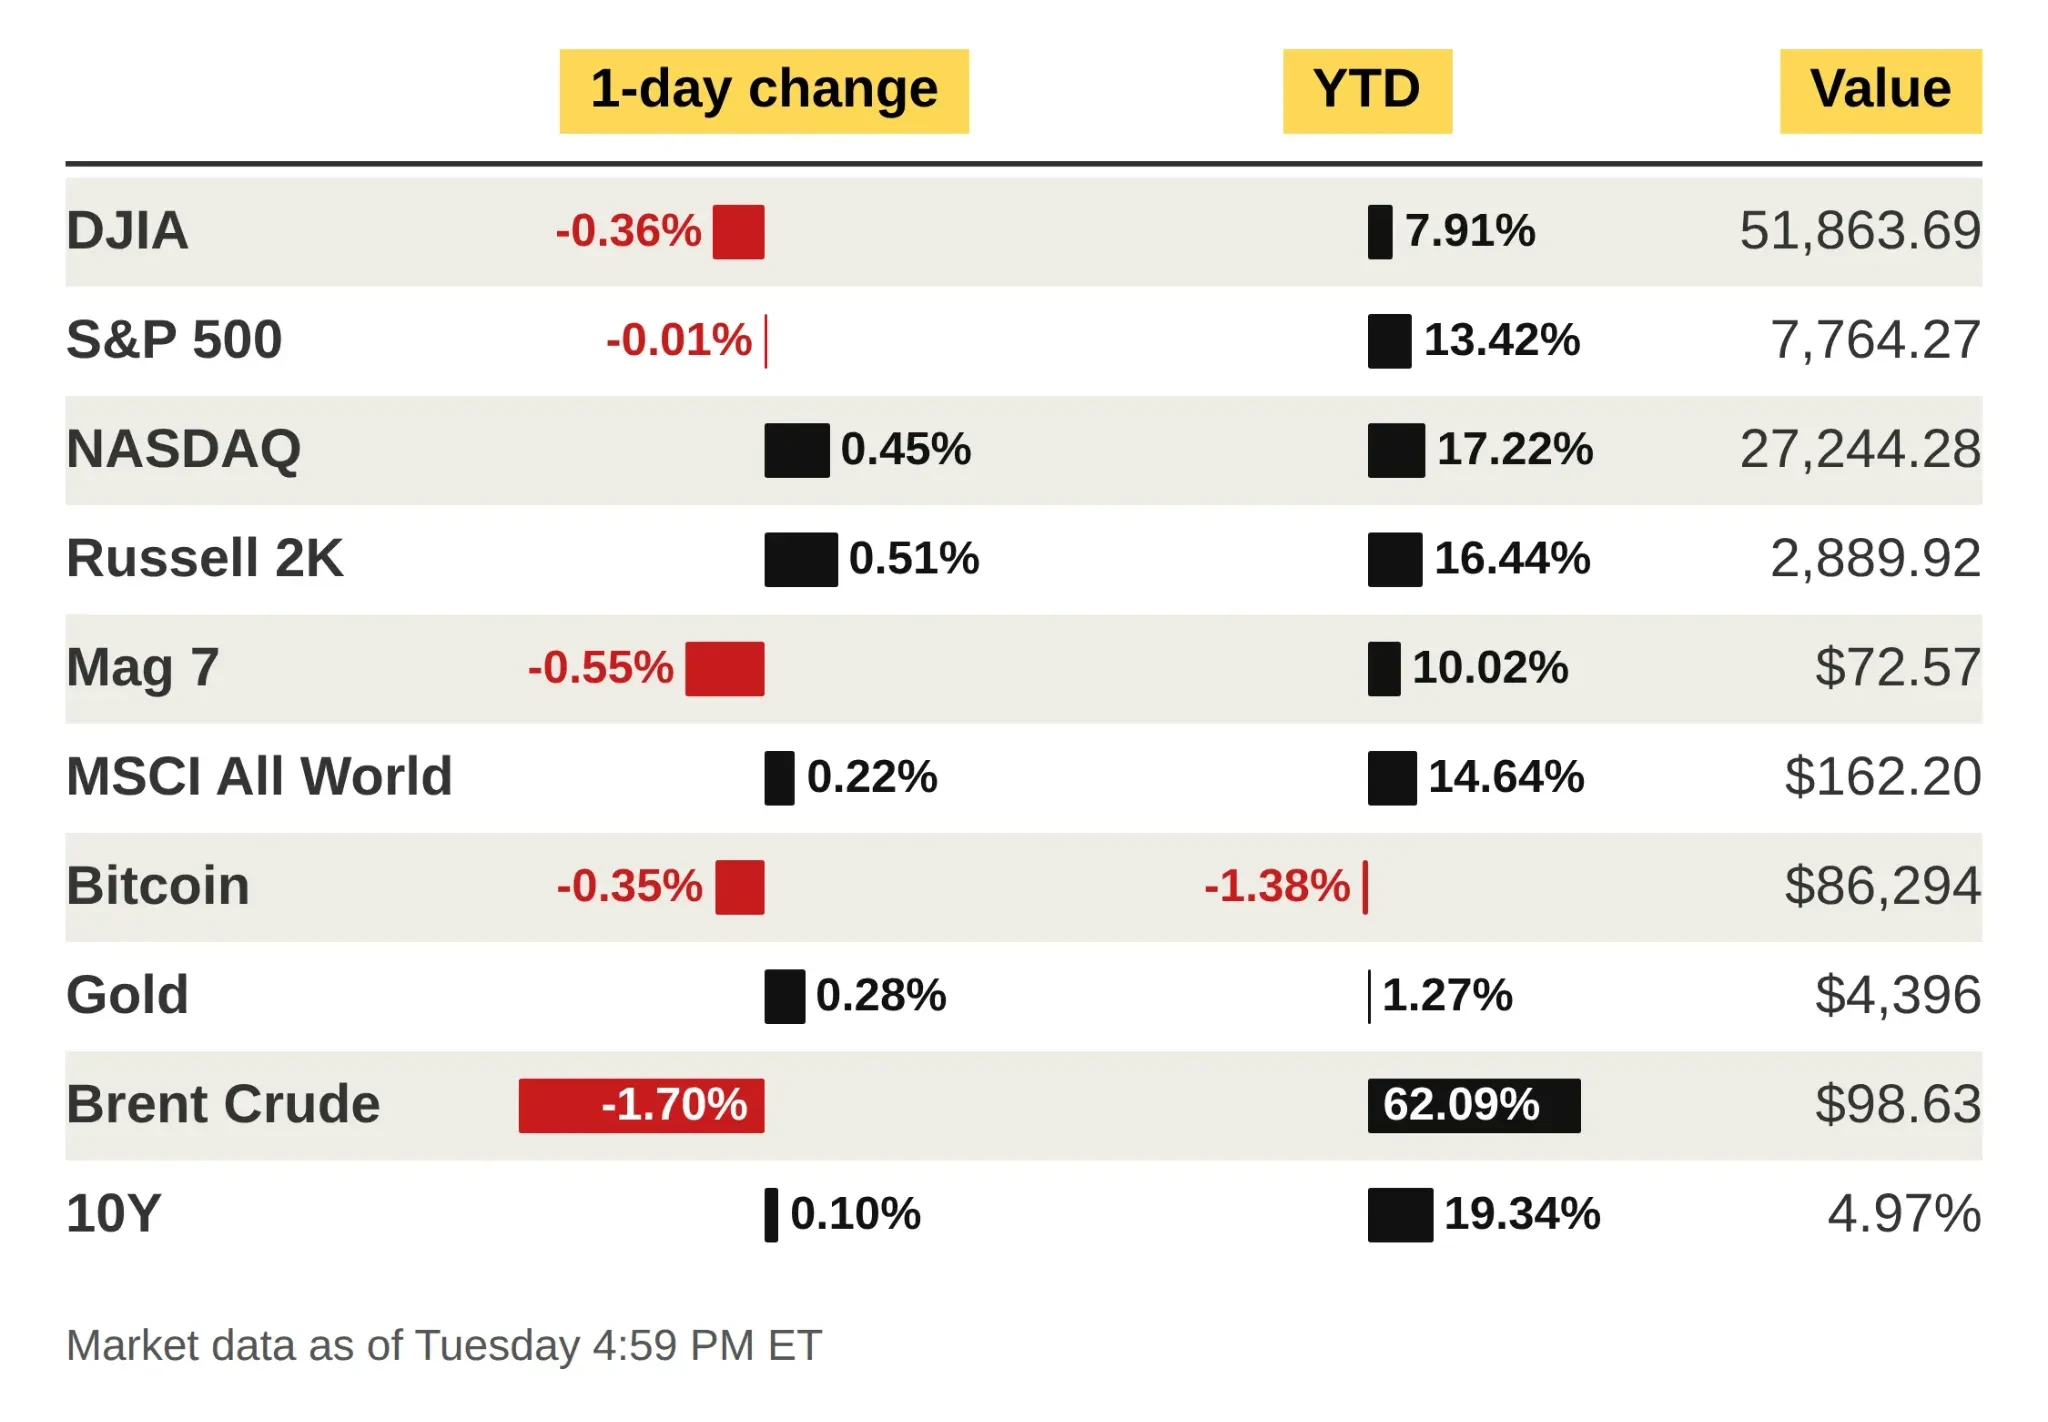
Performance of major asset markets on September 22. The Nasdaq rose 0.45% that day, bringing its year-to-date gain to 17.22%. Source: Opening Bell Daily
On the surface, "rate hike + record high" appears to be two warning signals: higher rates may compress stock valuations, while an index already at record levels makes investors prone to worrying that it has "risen too much."
But historical data does not support such a simple conclusion.
Rate hikes are not a "bearish button": average returns a year later are actually higher
Citing data compiled by Charlie Bilello, chief market strategist at Creative Planning, Opening Bell notes that since 1982, the S&P 500 has risen an average of 14.9% in the 12 months following Fed rate hikes; in the 12 months following rate cuts, the average gain was 11.2%.
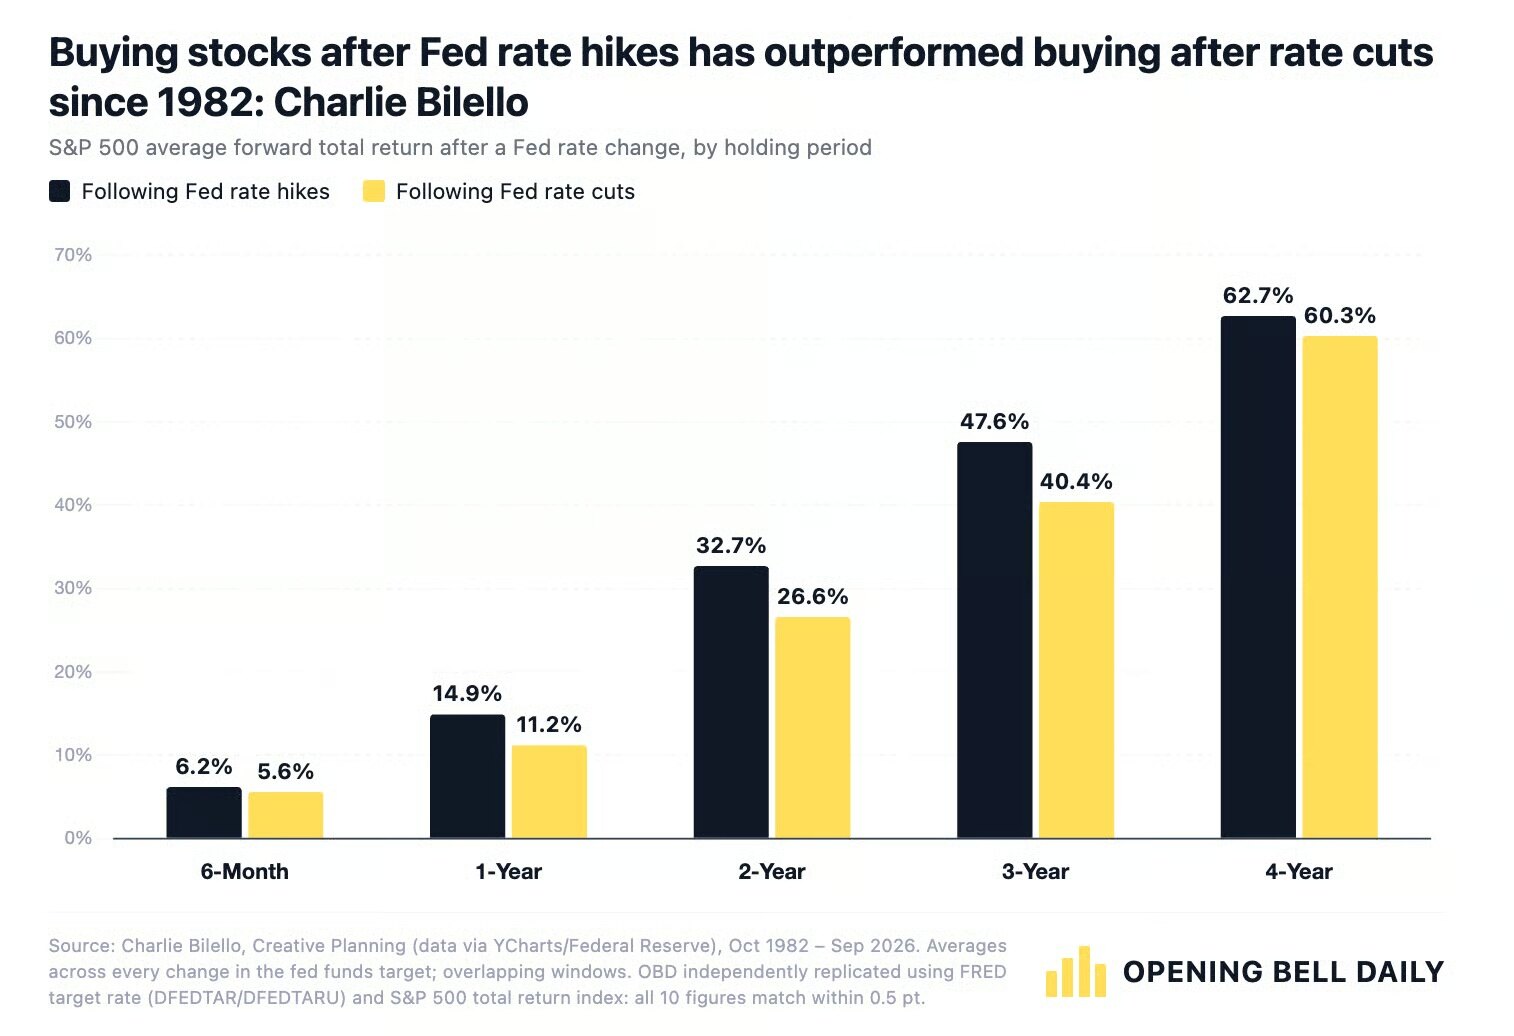
Since 1982, the S&P 500's average forward returns after Fed rate hikes have generally been higher than after rate cuts, with one-year average returns of 14.9% and 11.2%, respectively
This result runs counter to the most common market intuition.
According to simple asset pricing logic, lower rates mean lower financing costs and a lower discount rate for future cash flows, which in theory should be more favorable for stocks; rate hikes are the opposite. But Rosen argues that looking only at the policy action itself ignores a more important question: why is the Fed hiking or cutting at this particular point in time?
Generally speaking, if the Fed is able to raise rates, it often means the economy still has at least some capacity to bear it. Corporate earnings, employment, and consumption may still be resilient, giving the Fed room to suppress inflation through higher rates.
Rate cuts, by contrast, often occur in a different macroeconomic environment: slowing growth, a deteriorating job market, stress in the financial system, or rising recession risk.
Therefore, Rosen's core judgment is not that "rate hikes drove the stock market higher," but rather: monetary policy itself is endogenous. Interest rate decisions not only affect the future economy, but also reflect the state the economy is already in.
In other words, if you ignore the economic cycle and simply equate "rate hikes" with "bearish for stocks," it is easy to get the causal relationship backwards.
What really matters is not the direction of rates, but the economic conditions behind the hike
This logic is especially important in the current environment.
The economic description the Fed gave when raising rates this time was not weak. The official statement said the US economy was still expanding steadily, domestic spending remained resilient, productivity growth was strong, capital investment was solid, and employment growth was broadly in line with labor supply; at the same time, inflation remained above the policy target.
This means that, at least judging from the Fed's current policy assessment, this hike is not further tightening in an economy that has already clearly fallen into recession, but rather continuing to address inflation against a backdrop of still-resilient growth.
This is also why merely seeing the words "Fed rate hike" is not enough to directly deduce the stock market's direction in the next stage.
The truly important question is: as rates remain high, can corporate earnings, household consumption, and employment continue to absorb tighter financial conditions?
If they can, then the rate hike itself may not be enough to end the upward trend; if high rates eventually significantly drag on demand and earnings, then the explanatory power of historical average returns for the current market will also decline.
Record highs are not a sell signal either; historical data is even slightly favorable
Similar logic applies to another common concern: "It's already at a record high, can I still buy?"
Citing FactSet data, Opening Bell notes that since 1950, buying when the S&P 500 hit a record high produced an average return of about 9.5% over the following 12 months; by comparison, buying on other trading days produced an average one-year return of about 9.3%.
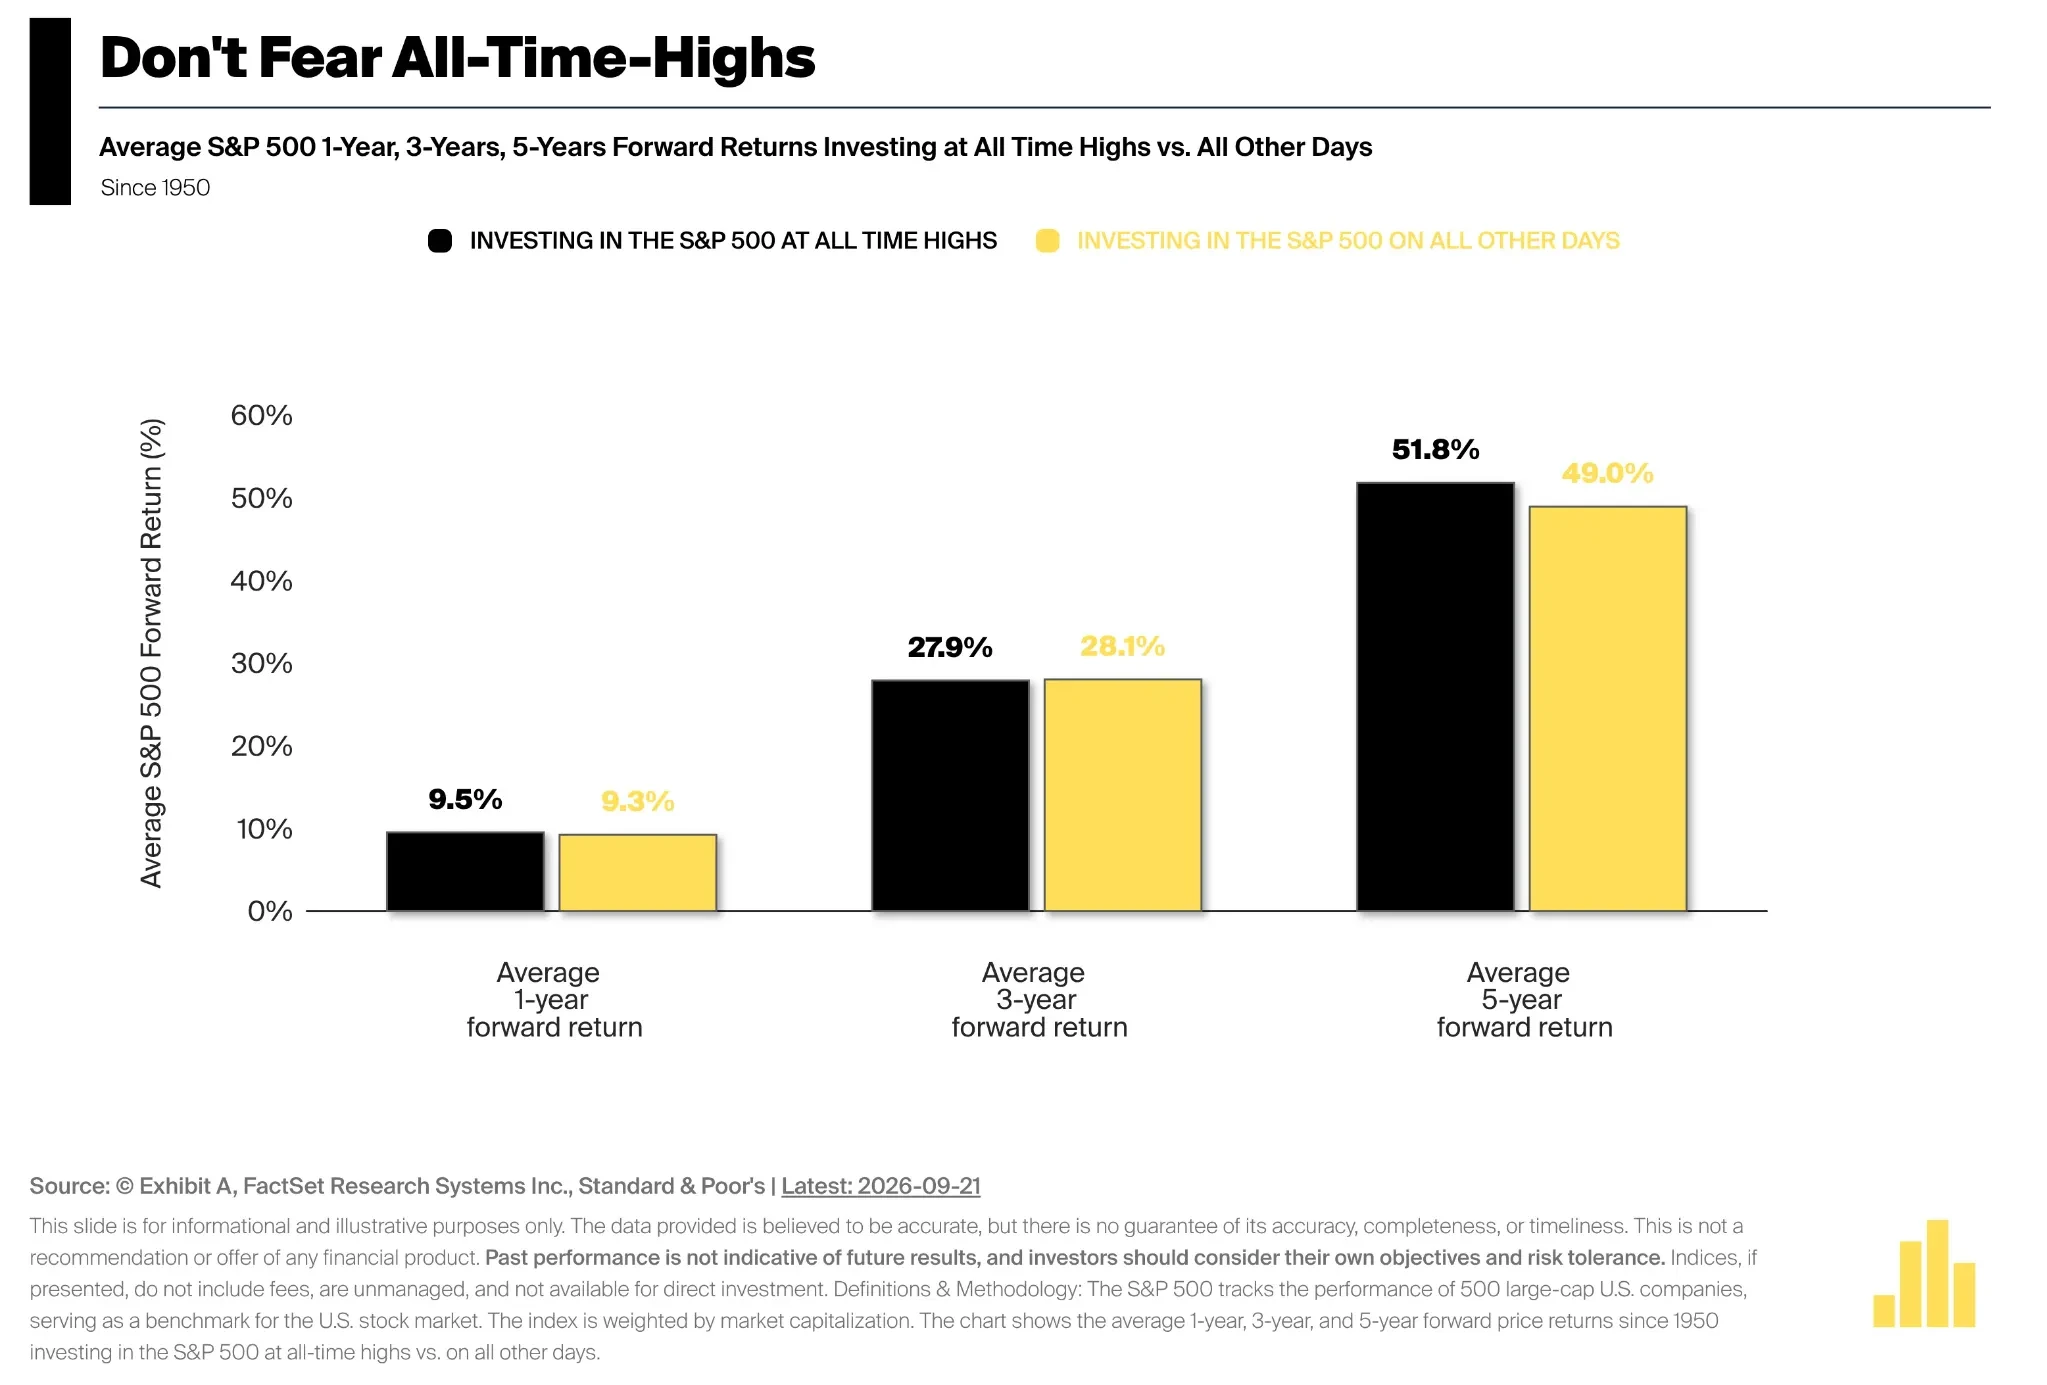
Since 1950, subsequent average returns from buying at S&P 500 record highs versus buying on other trading days. One-year returns were 9.5% and 9.3%, respectively; five-year returns were 51.8% and 49.0%
Independent data shows similar conclusions. Statistics from Vanguard based on FactSet and Morningstar Direct data show that as of September 2025, buying the S&P index at a record high produced an average one-year return of also 9.5%, versus about 9.2% on other trading days; over three- and five-year horizons, the average cumulative returns after buying at record highs were not notably behind either. The two sets of data differ by 0.1 percentage point in the specific figures for "other trading days," which may be related to sample cutoff dates and data processing methods, but the overall direction is consistent.
What is truly noteworthy here is not that record highs delivered a few tenths of a percentage point more in returns than ordinary trading days, but rather that: record highs themselves have not shown a stable negative predictive power.
Rosen's explanation is that market records tend to occur in succession. A sustained bull market may repeatedly set new highs, and the first, fifth, or even tenth record high cannot by itself tell investors when the bull market will end.
Therefore, "prices are already high" and "prices are about to fall" are not the same judgment. More precisely, historical data can only show that an index being at a record high is not, by itself, sufficient evidence that future returns will deteriorate.
Rate hikes plus record highs: what really matters next?
Starting from this framework, what is most worth watching in the current US stock market is not the two static facts that "the Fed has already raised rates" or "the Nasdaq has already hit a record high," but whether the macroeconomic conditions supporting them will change.
On one hand, it is necessary to continue watching whether US corporate earnings, consumption, and employment can remain resilient. If the real economy can still withstand higher rates, then the historical explanation that "rate hikes occur during a relatively strong economic phase" still holds.
On the other hand, it is necessary to watch whether tightening policy is beginning to produce more obvious lag effects. If rate-sensitive sectors such as housing and autos weaken further and gradually transmit to consumption, employment, and corporate profits, then the meaning of this rate hike will change.
Historical average data also needs to be used cautiously. The different rate-hike cycles since 1982 differed in inflation levels, valuations, earnings environments, and financial conditions; past average returns after buying at record highs cannot directly imply that similar returns will necessarily be achieved over the next 12 months.
Therefore, this set of data is better suited to ruling out an overly simplistic judgment rather than providing a new certain trading signal: rate hikes do not naturally mean US stocks should fall, and record highs do not naturally mean the rally is over.
What determines the market's direction in the next stage is still that more fundamental question -- whether the economy and earnings can continue to support current prices.