

September 28 U.S. Stock Pre-Market Report: Qualcomm Up 3.97%, Apple Patent License Renewed; Tonight's Two Fed Speeches in Focus

Last Friday (09/25), all three major indices closed higher in unison: the Dow +0.93%, the S&P 500 closed at 7,743.41, up 0.51%, and the Nasdaq closed at 27,068.72, up 0.48%, while the Philadelphia Semiconductor Index rose 1.4%. What rose was the group with new orders—Microsoft +3.66%, Qualcomm +3.97%, Dell +5%, while Nvidia (NVDA) gained only +0.22%. Today's focus is Qualcomm (QCOM), which closed at $201.97, up 3.97% on the day, with two things landing on the same day: the top-end Snapdragon 8 Elite can run a 30-billion-parameter large model locally on a phone, with 9 manufacturers adopting it; and the patent licensing renewal with Apple. Neither the renewal amount nor the expiration date was disclosed, and the detailed terms will have to wait for follow-up filings. Today (09/28), two Fed speeches plus a manufacturing index all fall after the 21:30 market open, making them intraday rather than pre-market events. The data in this article is based on the 09/25 U.S. stock close, and all times are UTC+8.
1. Today's Market: Indices Up Less Than 1%, Stocks With New Orders Up 3.66% to 5%
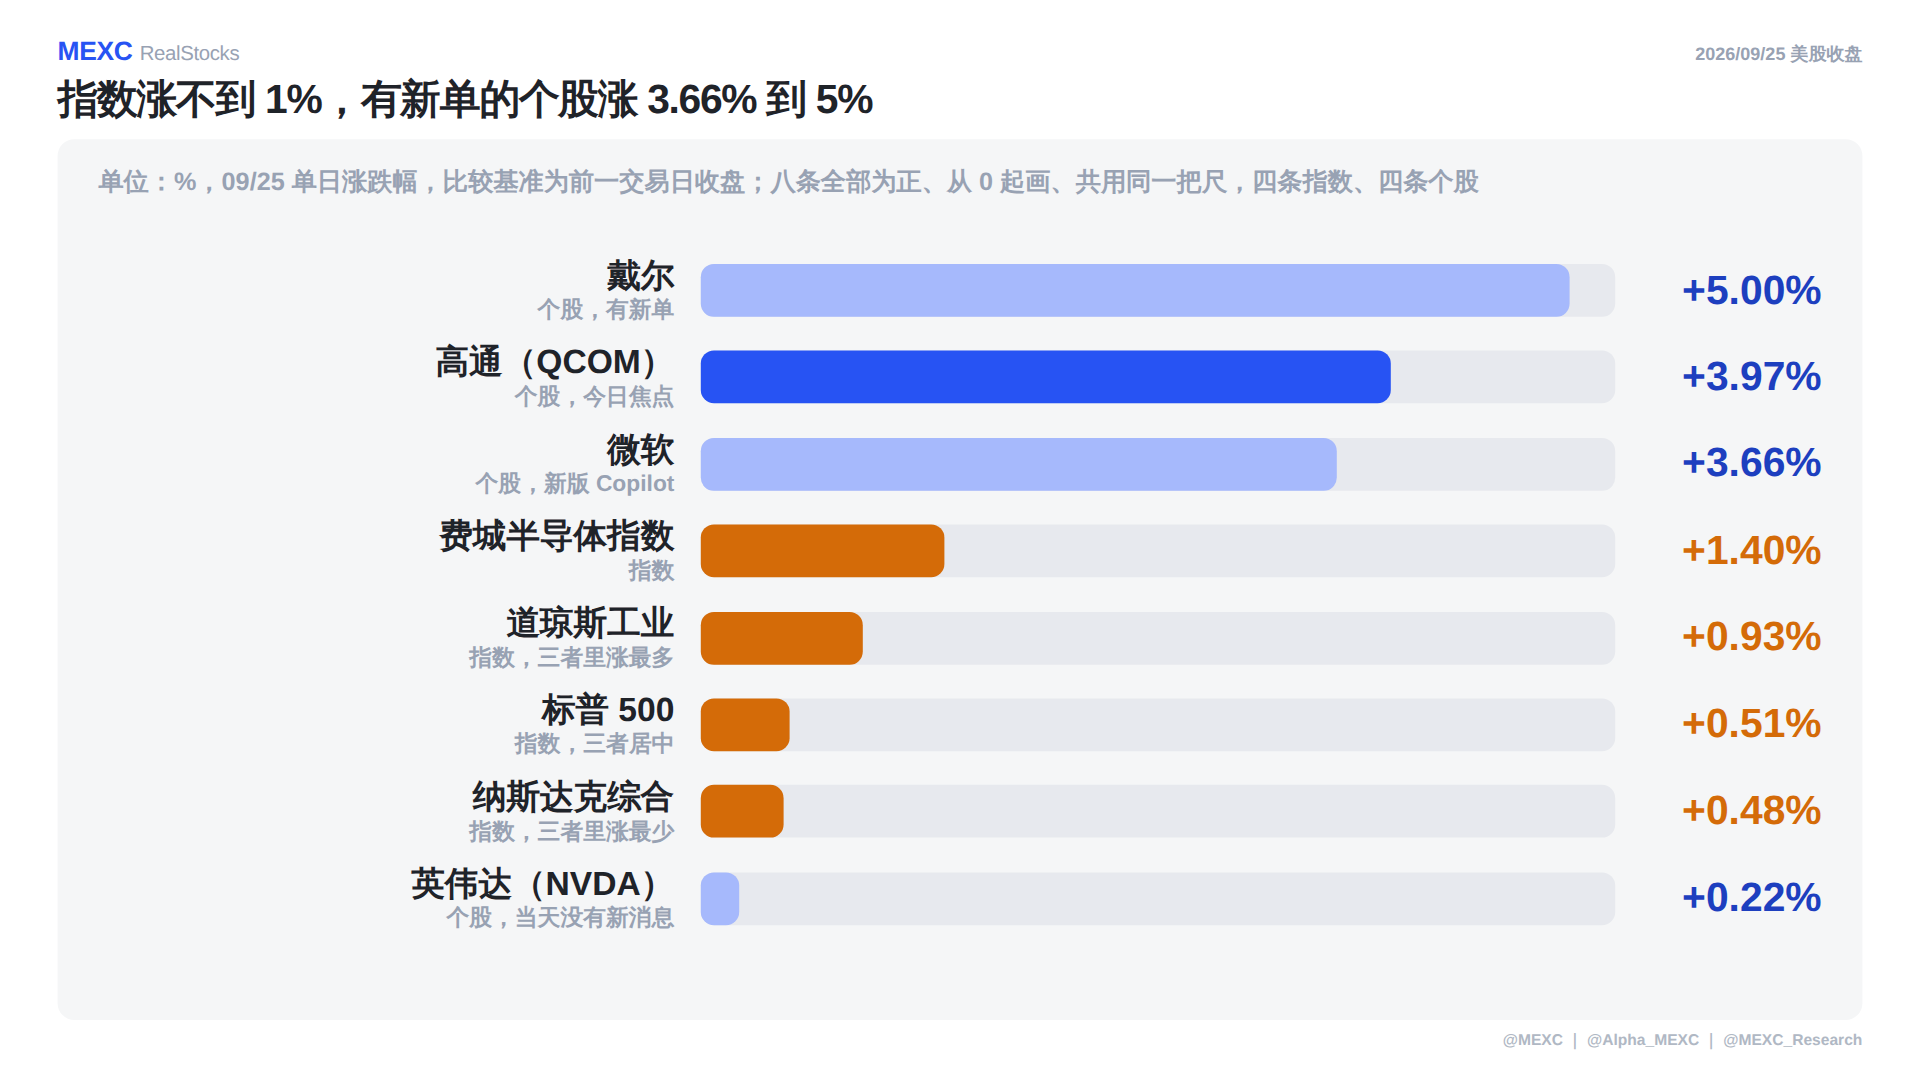
Units are %, representing single-day gains/losses on 09/25, with the prior trading day's close as the comparison base; all eight are positive, drawn from 0 on a shared scale, with four being indices and four being individual stocks. On the index side, all are below 1%, with the Dow +0.93% the highest among the three major indices; on the individual stock side, Dell +5%, Qualcomm +3.97%, and Microsoft +3.66%, running at more than four times the indices. The Philadelphia Semiconductor Index +1.4% sits in between, showing semiconductors overall are relatively strong, but not enough to explain Qualcomm's 3.97%.
The dividing line is not the sector label, but whether there are new orders. Microsoft's 3.66% corresponds to the new version of Copilot being added to code generation and AI agents; Nvidia (NVDA) gained only +0.22%, not because it got worse, but because there was no new news that day. Interest rates are another main thread: the 10-year U.S. Treasury closed at 5.16% and touched 5.23% intraday, the highest since 2007. A higher discount rate would normally pressure valuations, but that day it was pushed back by AI orders. Last week's U.S.-China summit produced an eight-point consensus, with reciprocal tariff cuts of $30 billion each, exchanged for agricultural products against small home appliances. None of it involved tech products, chip controls remained unchanged, and the tariff easing is sentiment-driven rather than fundamental.
2. Today's Focus: Qualcomm Up 3.97%, Two Things Landing on the Same Day

Units are %, representing single-day gains/losses on 09/25, with the prior trading day's close as the comparison base; the six are hand-picked large semiconductor stocks, grouped by the industry field, with both positives and negatives so a zero line was drawn, and all six share the same scale. Qualcomm (QCOM) +3.97% is the highest in the group, with second-place Lam Research (LRCX) +2.62%, a gap of 1.35 percentage points; the lowest, Intel (INTC) −3.45%, reflects profit-taking, with a top-to-bottom spread of 7.42 percentage points.
The methodology needs to be clear: on the same day, the semiconductor industry average was −0.10%, so Qualcomm's excess gain was 4.07 percentage points. But −0.10% is only a slight negative close to flat, not a broad sector decline: the same group also had Lam Research, Applied Materials (AMAT), Arm (ARM), and Nvidia (NVDA) all closing higher, so it cannot be written as "only Qualcomm was rising." The accurate statement is that semiconductors were overall close to flat, and the divergence was opened up by a single stock's news—this is a single-stock move, not a sector move. Qualcomm's market cap that day was $212.1 billion, up $8.1 billion in one day; but volume was only 1.10 times its average, not amplified, contrary to the usual "big multiple = something happened." The stock price sits at 58% of its 52-week range.
Five-Dimension Positioning: Full Marks in Peer Ranking, Weakest in Volatility Control
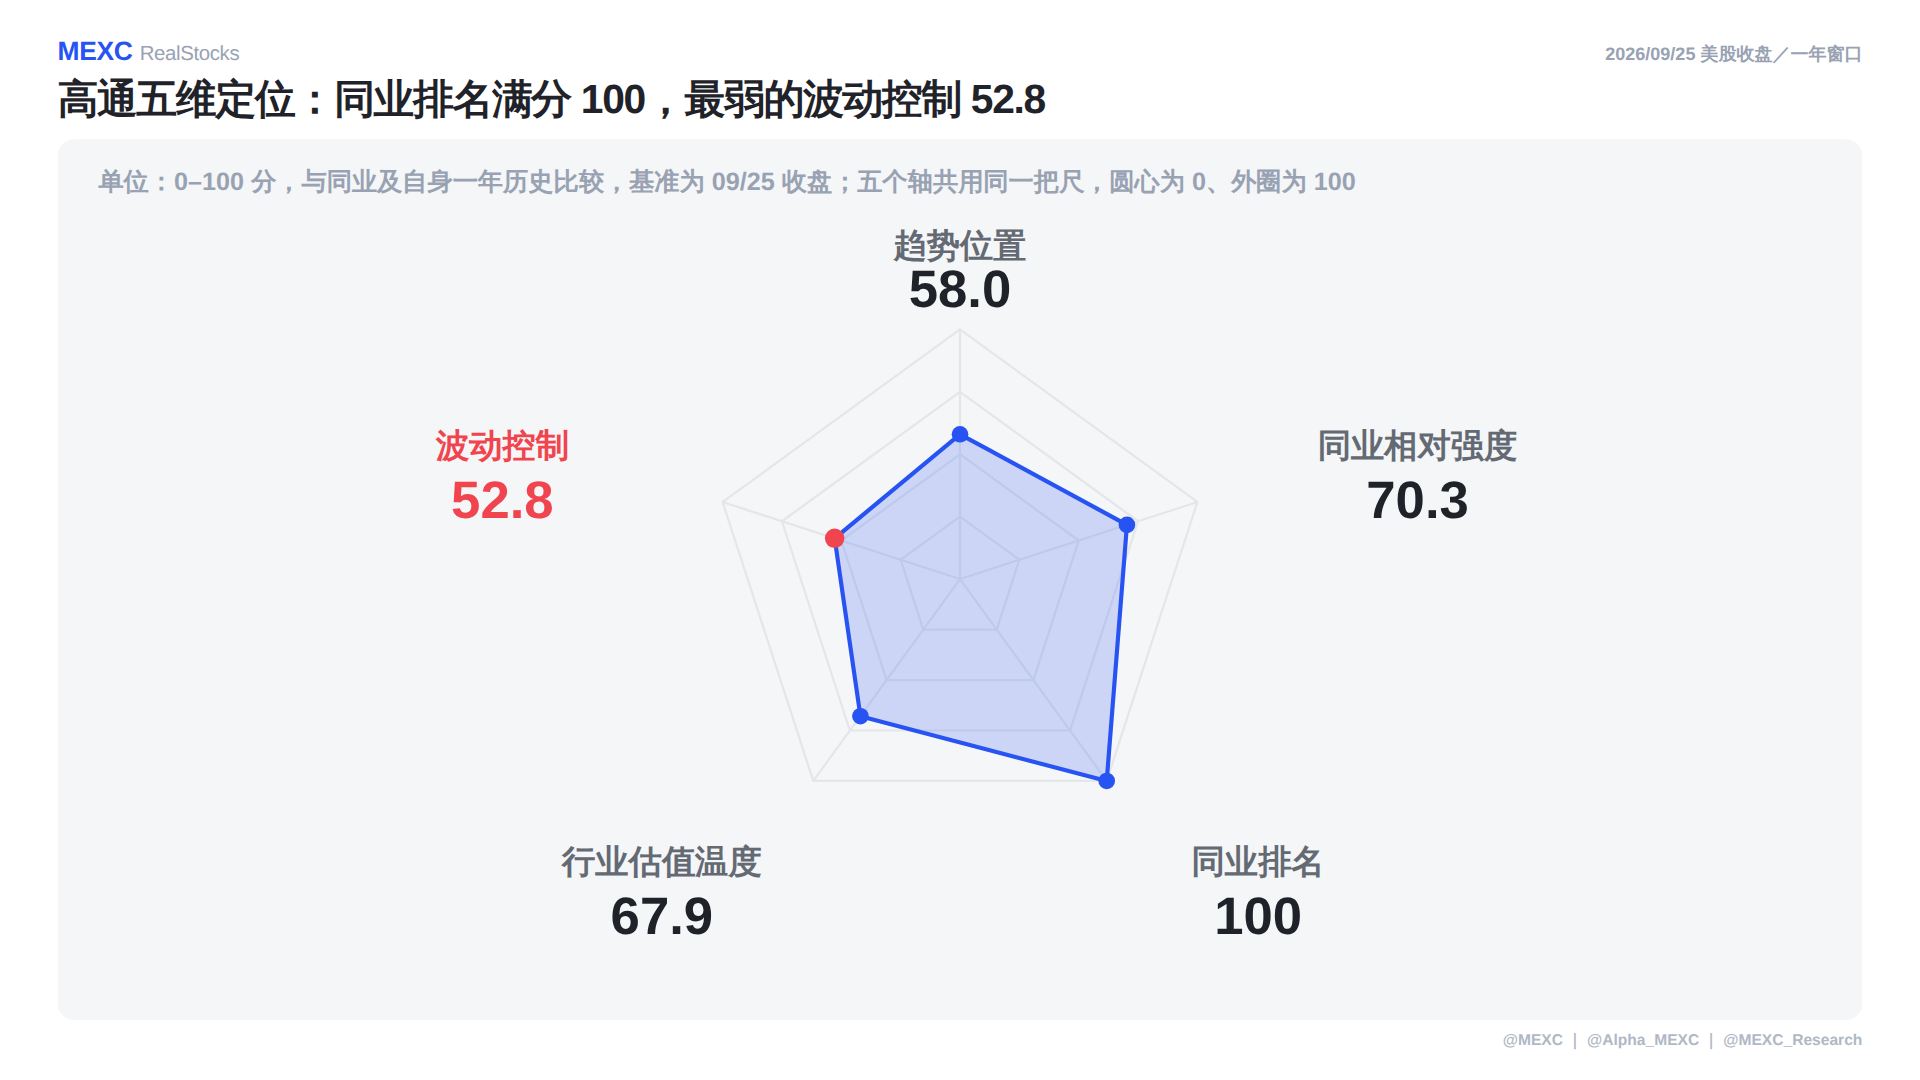
Units are 0–100 points, compared with peers and its own one-year history, based on the 09/25 close, with the center at 0 and the outer ring at 100, and all five axes sharing the same scale. This is a relative position over a one-year window, not same-day performance. A peer ranking of 100 means it was the strongest among the six semiconductor stocks in the group that day; relative peer strength 70.3, industry valuation temperature 67.9, and trend position 58.0 are all mid-to-upper, while the weakest dimension is volatility control at 52.8, indicating its price swings are relatively large within this group.
3. One-Minute Concept: Licensing Fees Take a Cut of the Other Party's Phone Selling Price

Units are %, with the denominator being Qualcomm's total revenue in the June quarter; both are drawn from 0 on a shared scale, and one of them is the denominator itself. Chip companies have two kinds of revenue: selling chips depends on shipment volume times unit price; collecting patent licensing fees takes a cut of the other party's phone selling price, unrelated to how many chips it sells itself. Qualcomm's licensing fees account for about 15% of revenue, and the higher the proportion, the heavier the weight of a single renewal.
Licensing fees have high gross margins and stable cash flow, at the cost of being signed for several years at a time, so every renewal is a major variable beyond the financial statements: it does not change shipment volume in any one quarter, but determines whether that 15% will still be there for several years to come. In this renewal with Apple, neither the amount nor the expiration date was disclosed, and the detailed terms will have to wait for follow-up filings.
4. What to Watch Tonight: First Public Remarks After the Rate Hike

Units are %, representing the median policy rate given by the September dot plot, by year-end basis; the four lines are drawn starting from 3.0%, not from 0, because all four numbers fall between 3.2 and 4.1. End-2026 4.1%, end-2027 4.1%, end-2028 3.9%, longer-run neutral 3.2%. September just raised rates by one quarter-point to 3.75%–4.00%, so the 4.1% for end-2026 equals one more quarter-point hike this year, flat in 2027, and only easing to 3.9% by 2028. ⚠️ The dot plot is a projection, not a commitment.
This line provides the scale for the capital expenditure payback period: high rates are a three-year matter, not a one-quarter matter. Today at 22:05 is Governor Barr's speech, 22:30 the Dallas Fed manufacturing index, and 01:30 the next day Barkin's speech—all three time points are after the 21:30 market open. Barr and Barkin are two different officials, each giving one speech, so do not see them as the first and second halves of the same person. The discount rate is the foundation of AI valuations, and any shift in its path forces capital expenditure to be recalculated.
Data Drill-Down: The 1.0 Percentage Point Gap Is Almost Entirely Stuck in Energy
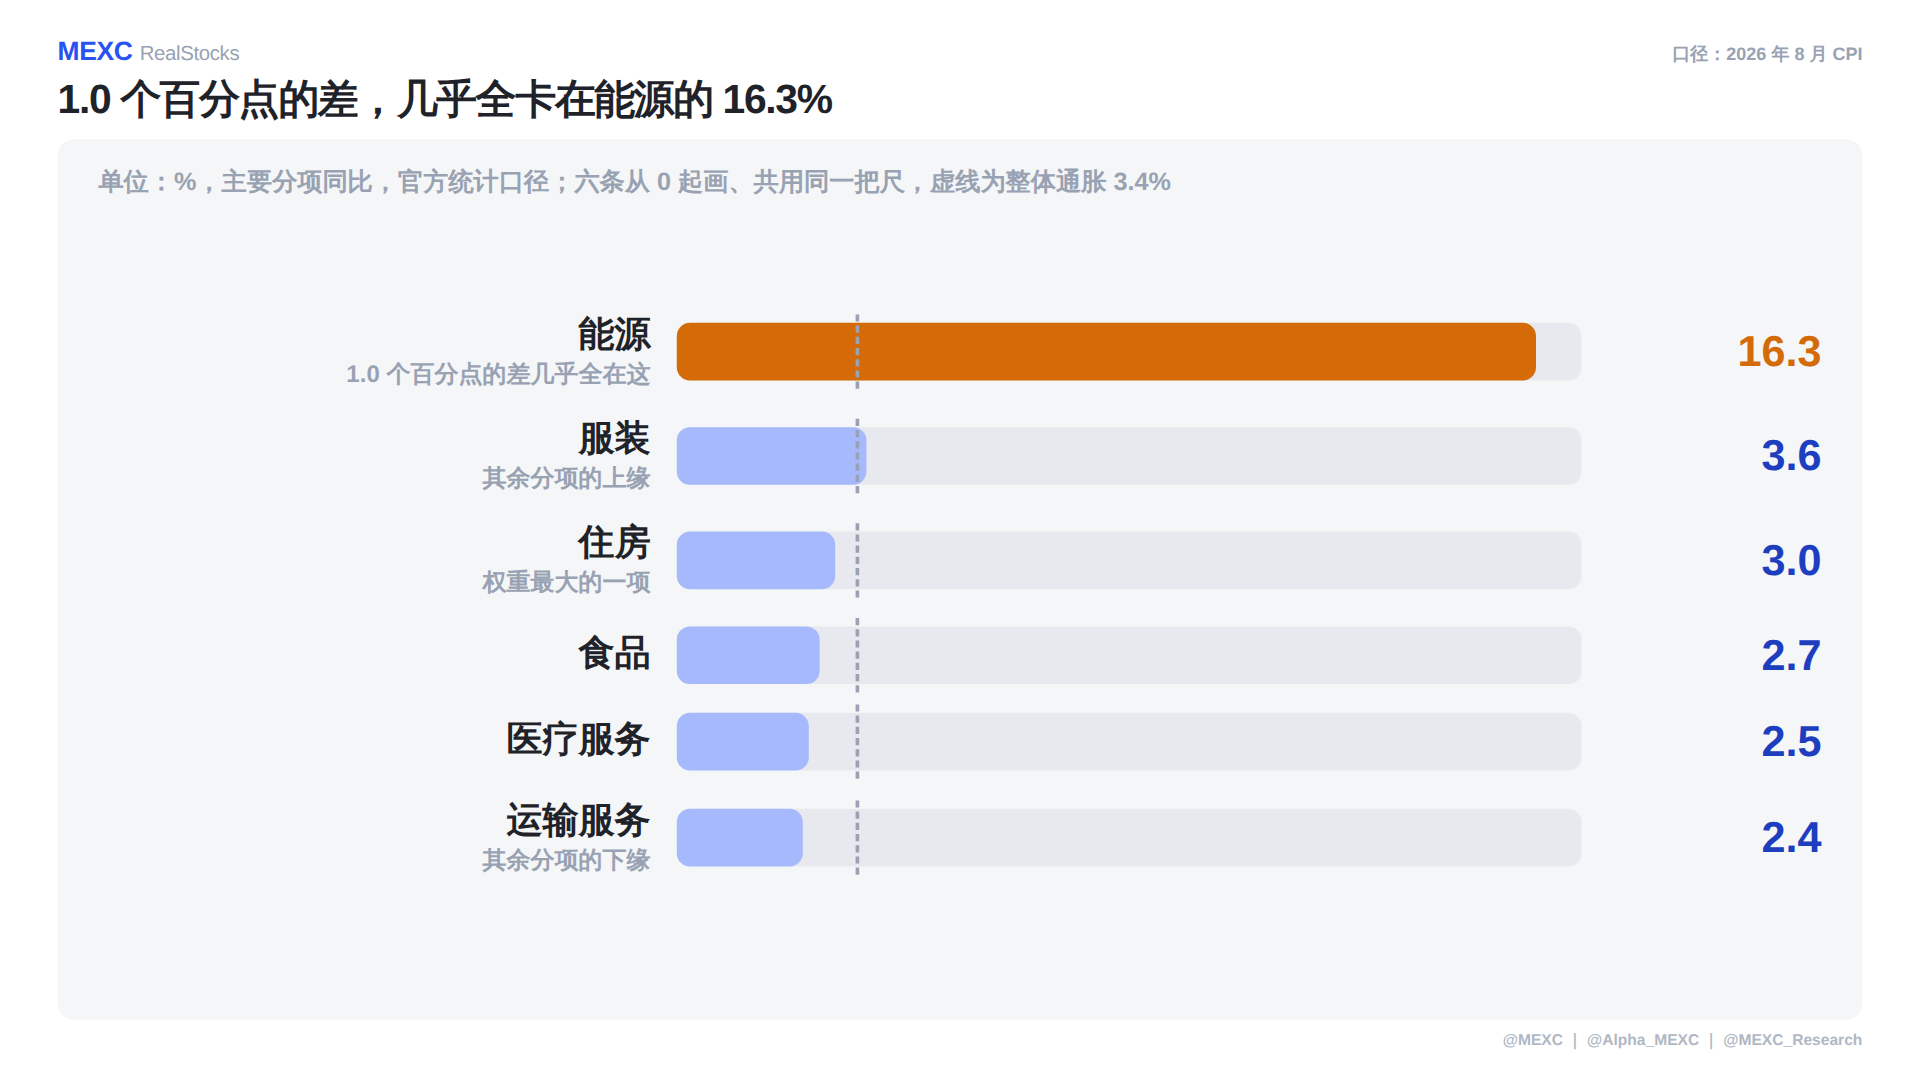
Units are %, representing the year-over-year increase in major CPI components in August, under the official statistical methodology; the six lines are drawn from 0 on a shared scale, with the dashed line being headline inflation at 3.4%. Energy at 16.3% stands out alone, while the other components fall between apparel at 3.6% and transportation services at 2.4%. Headline inflation is 3.4% and core is only 2.4%, a gap of 1.0 percentage point, and that 1.0 percentage point is almost entirely stuck in energy, with all other components squeezed into a narrow band, so core is not hot.
The first observation point is how officials characterize energy inflation: if treated as a one-off shock that can be "looked through," there is still room for a second quarter-point hike this year, and tech stocks benefit first; if it is deemed to be spilling over, the discount rate will have to rise further. The second observation point is how that eight-point consensus gets cited: it is an easing on the sentiment side, not a fundamental one.
5. U.S. Stock Classroom: Weekend Catch-Up—Chips Are Collecting Cash, Data Centers Are Borrowing Money

Drawdown from the 52-week high (%) = (52-week high − latest close) ÷ 52-week high × 100, based on the 09/25 close; the six lines are drawn from 0 on a shared scale, and the larger the value, the further from the high. ⚠️ This is ordered by drawdown magnitude, not a quality assessment or a recommendation ranking. Advanced Micro Devices (AMD) has a drawdown of only 1.3%, while at the other end Oracle (ORCL) is down 57.5%.
On the same AI主线 there are two positions: upstream collects cash, downstream borrows to build plants. Advanced Micro Devices (AMD) makes CPUs and AI accelerator cards, shipping and collecting payment with money coming in the same period, rising 9.9% last Friday and seeing its market cap break $1.03 trillion for the first time; Micron Technology (MU) makes DRAM and HBM memory, selling more with every additional AI server, closing at $1,082.28, 6.8 times its 52-week low. The more a company relies on debt to expand, the further it is from its high—SoftBank's high-yield bonds issued to invest in OpenAI carry a coupon of up to 9.75% on its longest tranche, and that is the current price of "borrowing to build AI."
Meet a Company Today: CoreWeave Sells Compute Time

Units are $100 million, using figures from the same second quarter for CoreWeave (CRWV); the two lines are drawn from 0 on a shared scale, with the denominator being the same quarter's revenue of $2.6 billion. This denominator differs from the previous chart, and the two charts cannot be compared across charts. CoreWeave sells compute time, not chips: GPUs are installed in its own data centers and rented by the hour to customers building large models. Second-quarter revenue was $2.6 billion, up 112% year over year, with a backlog of $104.2 billion.
But expansion is borrowed: interest expense in the same quarter was $640 million, meaning about $1 of every $4 of revenue goes to interest, and its costs move with U.S. Treasury yields. There are three steps to looking at this kind of company: first calculate interest expense divided by revenue; then look at the price of new debt, with SoftBank's longest tranche at 9.75%; finally check whether the backlog and the debt maturities line up—the backlog is spread over several years, while interest must be paid every quarter.
6. Frequently Asked Questions
Q: The industry average was only −0.10%, so why say this was a single-stock move?
A: Because −0.10% is a slight negative close to flat, not a broad sector decline. Four other stocks in the same group closed higher, and the divergence came from individual news rather than sector direction.
Q: It rose 3.97% but volume was only 1.10 times, is that contradictory?
A: Not contradictory, but worth noting. 1.10 times means volume was not amplified, price moved but turnover did not follow, contrary to the usual "big multiple = something happened."
Q: Which number should be watched in a patent licensing renewal?
A: First look at licensing fees as a share of revenue, about 15% for Qualcomm (June quarter); the higher the share, the heavier the weight. Neither the amount nor the expiration date of this renewal was disclosed, and the terms will have to wait for follow-up filings.
Q: Can the 4.1% median in the dot plot be treated as a commitment?
A: No. The dot plot is a projection, not a commitment. It provides the scale for the capital expenditure payback period: 4.1% at end-2026, only easing to 3.9% by end-2028, so high rates are a three-year matter.
Q: How should interest expense divided by revenue be used?
A: It measures whether the money for expansion is earned or borrowed. CoreWeave had second-quarter revenue of $2.6 billion and interest expense of $640 million, about $1 of interest for every $4 of revenue.
Disclaimer: This article was compiled and written by the MEXC U.S. Stock Spot Team (MEXC RealStocks). The data in this article is based on the U.S. stock close on September 25, 2026. The content is a compilation of publicly available market information, and the individual stocks are publicly discussed targets. They do not represent recommendations or opinions of MEXC and do not constitute any investment advice.