

Samsung's most profitable quarter ever, yet its stock is 30% below its June high

A company delivered the most profitable single-quarter results in the nation's corporate history, yet its stock price fell that same day and has pulled back about 30% from its high six months earlier. Put these two facts together, and the question shifts from whether the results were good to what the market is pricing in. This article first verifies the results themselves, then examines where the profits come from and where they go, then explains how to read the stock price, and finally places Samsung's books back into the broader AI hardware supply chain.
1. The Results Themselves: Single-Quarter Profit Roughly 2.5x Full-Year 2025
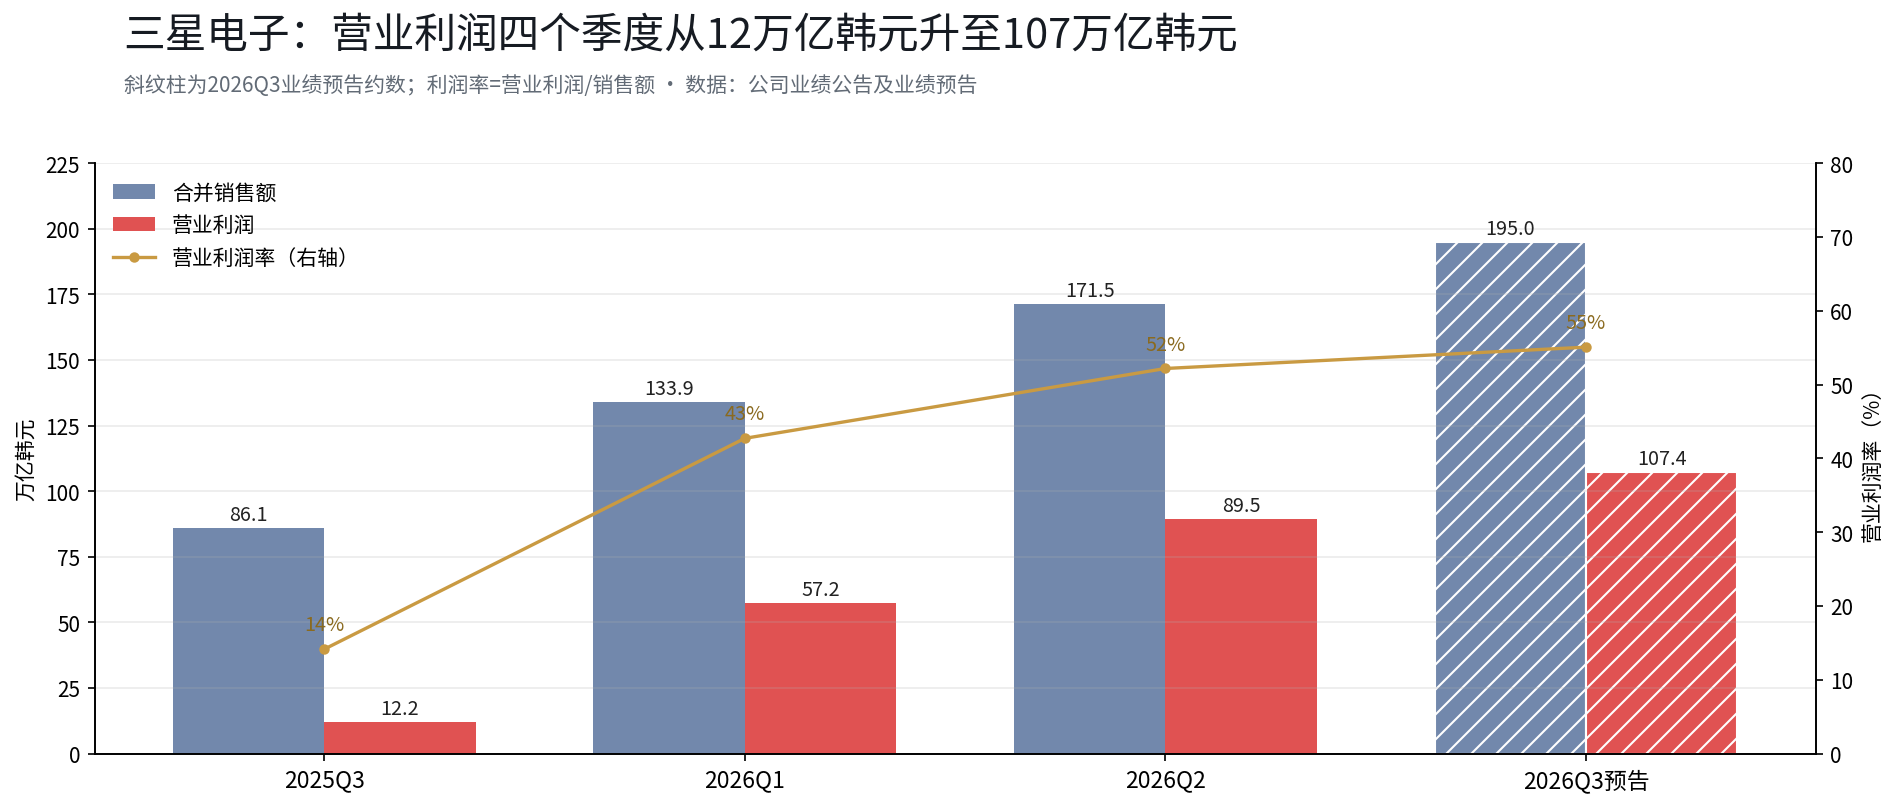
First, let's verify the numbers. Q3 2026 earnings guidance: consolidated revenue of approximately KRW 195 trillion, up 126.6% year-over-year; consolidated operating profit of approximately KRW 107.4 trillion, up 782.5% year-over-year. This marks the first time a Korean company has exceeded KRW 100 trillion in single-quarter operating profit; for reference, Samsung's full-year 2025 operating profit was KRW 43.6 trillion—a single quarter delivered roughly a year and a half's worth of profit.
Lining up the past four quarters, the slope itself tells a story: Q3 2025 operating profit was KRW 12.17 trillion, Q1 2026 was KRW 57.2 trillion, Q2 was KRW 89.5 trillion, and Q3 guidance is KRW 107.4 trillion. Operating margin climbed from 14% all the way to approximately 55%.
But the same number can be read two ways. The first reading is the level: KRW 107.4 trillion is a record. The second reading is the slope: Q2's year-over-year growth rate was 1,813.8%, which slowed to 782.5% in Q3. Both readings are true, but the stock price chose the second. One technical fact bears noting here: such a large year-over-year growth rate largely stems from the low base in the same period of 2025. Looking at two years combined, the memory industry is in the middle of a historic upcycle, and past performance does not guarantee future results.
2. Where the Money Comes From, Where the Losses Go
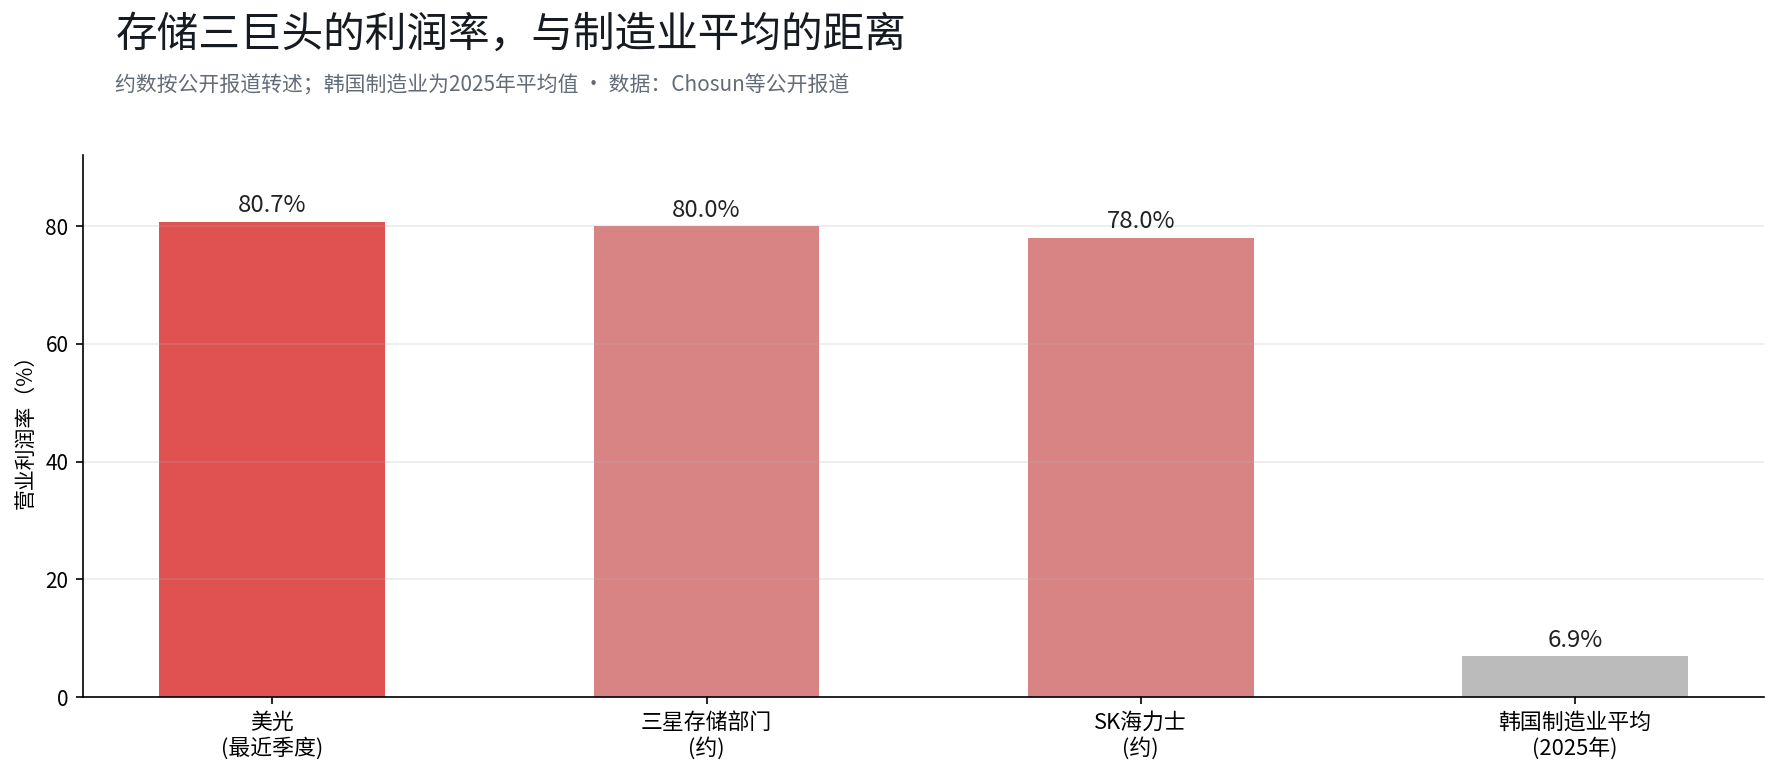
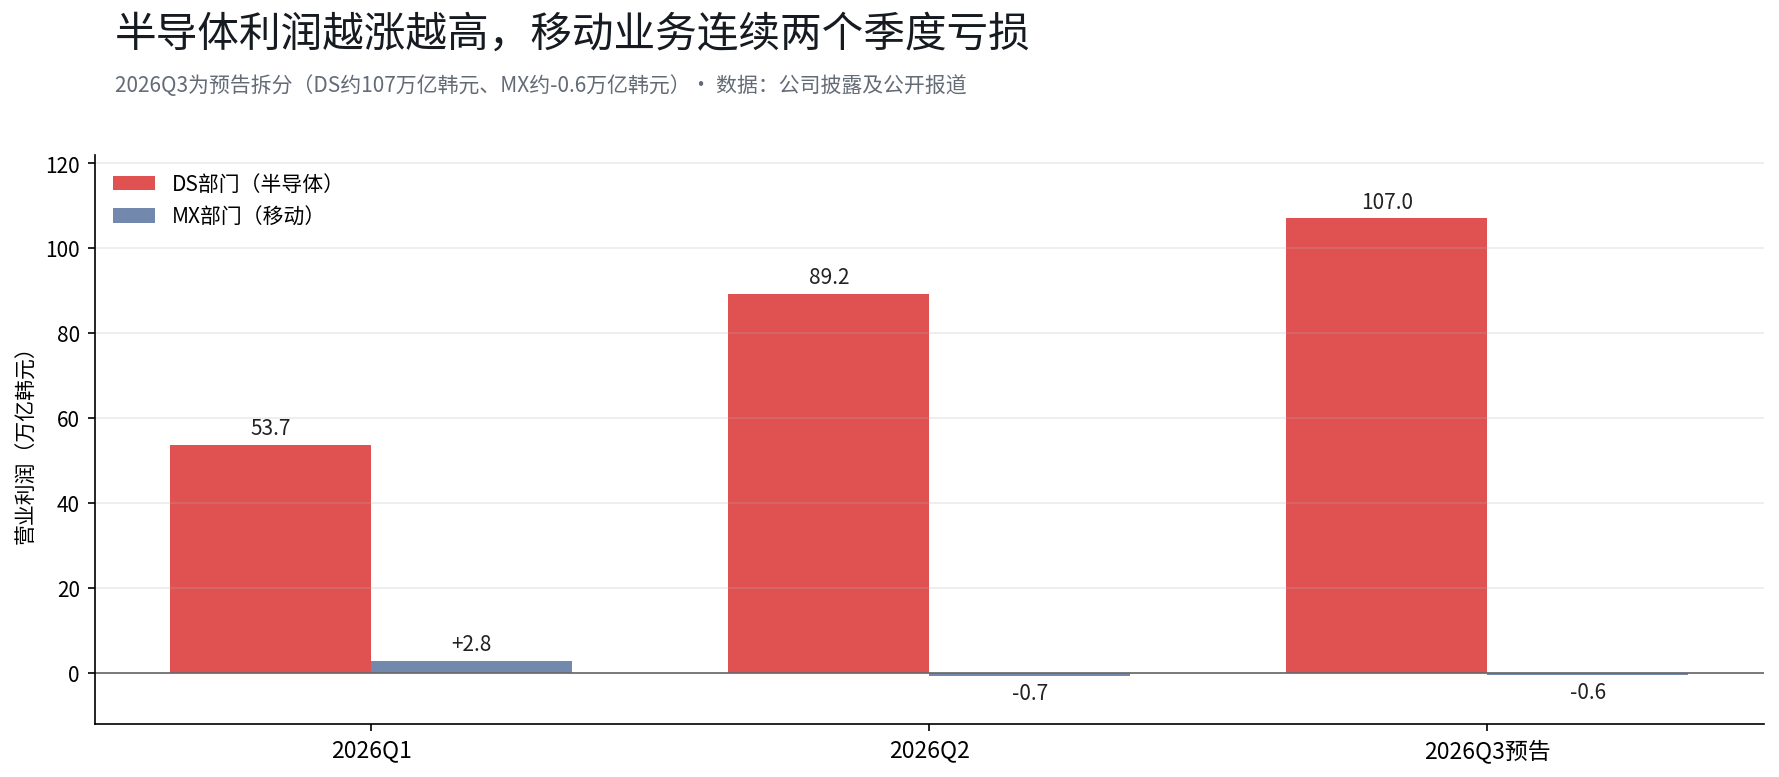 According to Citi's breakdown, Samsung's semiconductor division posted approximately KRW 107 trillion in Q3 operating profit, up further from KRW 89.2 trillion in Q2. The profitability of the memory trio is rewriting what we consider normal in manufacturing: according to public reports including Chosun, Micron's most recent quarterly operating margin was 80.7%, Samsung's memory division was approximately 80%, and SK Hynix was approximately 78%. For reference, the average operating margin for Korean manufacturing in 2025 was just 6.9%.
 On the other side of the same income statement, money is flowing in the opposite direction. The mobile business and consumer electronics division is expected to post a Q3 loss of approximately KRW 0.6 trillion—its second consecutive quarterly loss; smartphone shipments fell 9% quarter-over-quarter to 58 million units. A more direct move is on the supply side: according to Korean media reports, Samsung's Mobile eXperience division has notified suppliers of plans to cut smartphone production by 20% to 30% in Q4. The company also raised prices for the Galaxy S26 series, with reports indicating the S26 starting price was raised by RMB 800 to RMB 7,799, while the S26+ and S26 Ultra each increased by RMB 1,000.
These two divisions are two sets of books within the same company, and they are mutually causal. Rising memory chip prices have pushed the semiconductor division's profit margin to around 80%; those same price increases are the direct cause of the mobile division's runaway costs. Morgan Stanley estimates that Samsung's mobile division could accumulate operating losses of up to $16 billion from 2026 to 2028 (as cited from its industry report dated July 21). A portion of the money the semiconductor business earns is being lost by the company's own device business.
3. Why the Stock Price Isn't Buying It
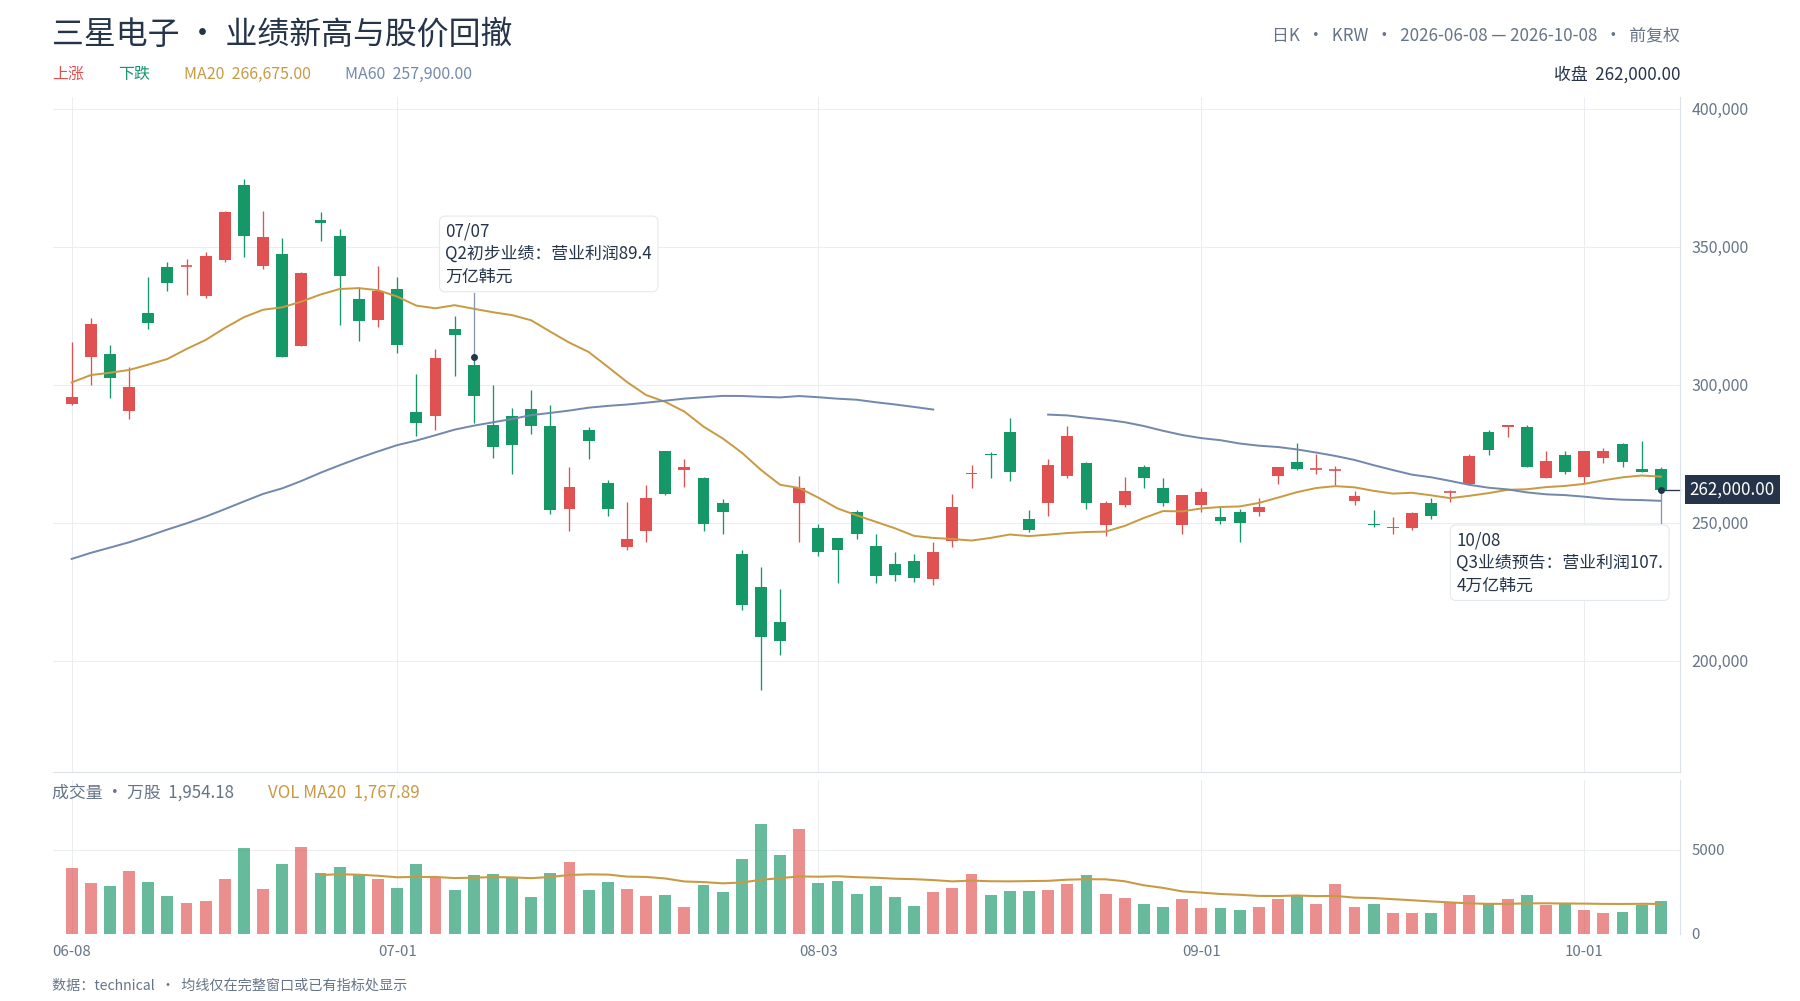
At the close on October 8, Samsung Electronics traded at KRW 262,000, down 2.42% on the day; over the three trading days in October, it fell 5.07% cumulatively; from its intraday high of KRW 374,500 on June 18, it has pulled back approximately 30%. The stock fell on the very day the earnings guidance was released, indicating that the market had already priced in these record results before the guidance—the disclosure itself provided no new upward momentum.
Three issues were placed on the table simultaneously. The first is the shortfall: Q3 revenue of KRW 195 trillion came in below the brokerage estimate of approximately KRW 201.9 trillion; operating profit of KRW 107.4 trillion fell short of the estimated KRW 108.67 trillion. The shortfall is only around 1%, which normally wouldn't move the stock, but at a point of highly consensus expectations, the signaling effect of a slight miss is amplified. The second is the slope: year-over-year growth slowed from 1,813.8% in Q2 to 782.5% in Q3, and on a quarter-over-quarter basis, operating profit growth also decelerated from Q2's 56%. The third is inventory and upward revision momentum: according to Morgan Stanley's July report, upward earnings revision momentum for memory manufacturers is weakening, with the net earnings upgrade ratio having fallen from a peak of 92% to 77%. DRAM contract price year-over-year growth has retreated from cyclical highs, and both DRAM and NAND inventories rose in Q2.
Capital expenditure is another layer of pressure, hidden downstream of the income statement. Q2 capital expenditure was KRW 16.8 trillion, of which KRW 15.4 trillion went to the semiconductor division; to fill the capacity gap, the company has already launched and plans to continue investing tens of trillions of won over the next two years to expand memory fabs. If the company continues to increase fab construction and depreciation spending in the second half to ramp up HBM4, these costs could show up in the next one or two quarters' financials. The market's concern is: will this spending consume most of the incremental profit in some quarter?
4. Citi's Logic and a More Fundamental Question
According to public reports, Citi maintains a Buy rating on Samsung with a 12-month target price of KRW 430,000, implying approximately 60% upside from the October 7 close of KRW 268,500; this view represents only the relevant institution's judgment. Citi's core thesis rests on HBM4 pricing elasticity: it estimates that the average price per GB for HBM4 12hi could rise from approximately $2 in 2026 to a range of $4 to $5 in 2027, with HBM4 8hi commanding a 20% to 30% premium on top of that. Samsung management also stated during its Q2 earnings call that it expects HBM4 sales to more than triple in Q3 and account for over 60% of total HBM revenue in the second half (as cited from the earnings call).
The bull case is about price elasticity; the bears' question is about demand's ability to absorb it. According to Morgan Stanley estimates, global cloud service providers' capital expenditure could reach $1.2 trillion in 2027, with more than half flowing to memory; meanwhile, the ratio of capital expenditure to EBITDA for Google, Amazon, Microsoft, and Meta has already exceeded 70% in 2026, and for some companies, capital expenditure could exceed EBITDA in 2027. Pricing power for memory lies on the supply side, but supply-side profits ultimately come from demand-side spending. Once buyers' spending approaches or exceeds their profitability, how far the price curve can extend depends on a balance sheet that Samsung itself cannot control.
5. Samsung's Books Are Also the Entire AI Hardware Chain's Books
There are two opposing facts in Samsung's earnings report. One is that AI data center demand for HBM and DRAM is still exploding, memory supply-demand tightness may persist, and industry profit margins are at historic highs; the other is that the same company's consumer electronics business is cutting production, raising prices, and losing money—rising memory prices are squeezing terminal profit margins. These two facts are not coincidental parallels; the latter is partly caused by the former: the more expensive the computing power, the harder it is to make devices. Similar pressures are propagating through the entire AI hardware supply chain, though different segments bear them in different ways.
In our view, the way to read Samsung's stock price is essentially that the market is pricing growth rates, not profit levels: the level has already been delivered; the slope is what's part of the valuation. This reading comes with one premise and one counterexample. The premise is that cloud providers' spending slope holds; if 2027 capital expenditure guidance sees systematic downward revisions, both memory volumes and prices will come under pressure. The counterexample is that if the October 29 earnings call provides tighter guidance on long-term supply agreements and 2027 supply-demand outlook, slope concerns could ease in the near term. Whether profits have peaked for this cycle cannot be confirmed in advance; what can be verified are the three answers from October 29: 2027 supply-demand, long-term agreement progress, and details on capital expenditure and shareholder returns. How much of this quarter's profit is already priced in remains to be seen.
Data Notes
- Samsung results and divisional breakdown: company announcements (2026/10/8, 7/30, 5/6).
- Q3 2025 comparison and full-year operating profit: company disclosures, Yonhap (2026/4/7, 7/7).
- Samsung stock price and drawdown: public market data, as of 2026/10/8 close; June 18 high is intraday price.
- Citi view: Citi research report, as cited by media.
- Morgan Stanley view: Morgan Stanley industry report dated 2026/7/21, as cited by media.
- Mobile production cuts, shipments, S26 pricing: Korean media, TrendForce.
- Memory trio profit margins: public reports including Chosun.
Disclaimer:
This content is for general informational and market commentary purposes only, based on publicly available information as of the time stated herein. Relevant market data, expectations, and probabilities may change with market conditions. The views and investment strategies of third-party institutions, analysts, or other persons cited herein represent only the views of the relevant third parties at specific times and do not represent the views or recommendations of BIT. This article does not constitute investment advice, investment research, an offer, solicitation, or recommendation of any securities, investment products, or trading strategies, and should not be relied upon as the basis for any investment decision. Financial markets involve risk; securities prices and market performance may fluctuate, and historical performance and past market trends do not represent or guarantee future results. Investors should independently assess relevant risks based on their own circumstances and seek professional advice when needed.