


October 2026 US ISM Manufacturing PMI Preview: Release Time, New Orders Indicator, and Economic Growth Trends

Overview
The Institute for Supply Management will release the October Manufacturing PMI at 23:00 Singapore time on November 2. This is one hour later than in recent months because US daylight saving time ended on November 1, shifting the release from 22:00 SGT (corresponding to 10:00 EDT) to 23:00 SGT (corresponding to 10:00 EST). This offset will apply to US data releases over the coming months.
No market consensus was published for this release, and the forecast columns of major financial calendars are currently blank, so any assessment must rest on the September sub-index baselines and other contemporaneous surveys. The September headline index came in at 54.5, marking the ninth consecutive month above the 50 expansion threshold; the real focus is not the headline itself but the fact that new orders, employment, and prices paid all rose simultaneously in September, with prices paid jumping 6.8 points in a single month to 77.9, the highest since May. Whether these three signals continue to move in the same direction or begin to diverge will determine what this report signals for the December rate path.

Key Takeaways
The September headline index was 54.5, down marginally 0.1 point from August, but the sub-index structure shifted: new orders rose 1.6 points to 55.3; employment rose 1.5 points to 52.7, marking a third consecutive month of expansion after 33 months of contraction; production fell 1.6 points to 56.7; and inventories fell 2.0 points to 48.6, the first contraction since May. Prices paid at 77.9 is the core variable in this report; in September, 58.6% of respondents reported paying higher prices while only 2.8% reported paying less. S&P Global's preliminary October Manufacturing PMI came in at 56.0, above the expected 55.5 and September's 55.9, with its accompanying commentary also noting further increases in inflationary pressure—two surveys with different methodologies pointing to the same problem.
Release Timing and What Makes This One Different
The release is scheduled for 10:00 Eastern Time on November 2, corresponding to 15:00 UTC and 23:00 Singapore time. Previous releases were at 14:00 UTC; the difference stems from the end of US daylight saving time on November 1, not from any change in the release schedule.
No published consensus is available for comparison this time, which is unusual. The next-best reference is the direction of recent deviations between actual and expected readings: September actual 54.5 versus expected 54.8; August actual 54.6 versus expected 55.2; July actual 55.6 versus expected 54.0; June actual 53.3 versus expected 53.8; May actual 54.0 versus expected 53.3. Three of the last five came in below expectations, with deviations mostly in the 0.3 to 1.6 point range. The absence of a consensus means the immediate price reaction is more likely to be driven by the sub-index structure than by the headline level.
September Sub-Index Baselines
To judge whether October shows divergence, we first need to establish the September starting point. The table below shows September sub-index values and month-over-month changes, with 50 as the expansion threshold; supplier deliveries and customer inventories read in the opposite direction from other sub-indices.
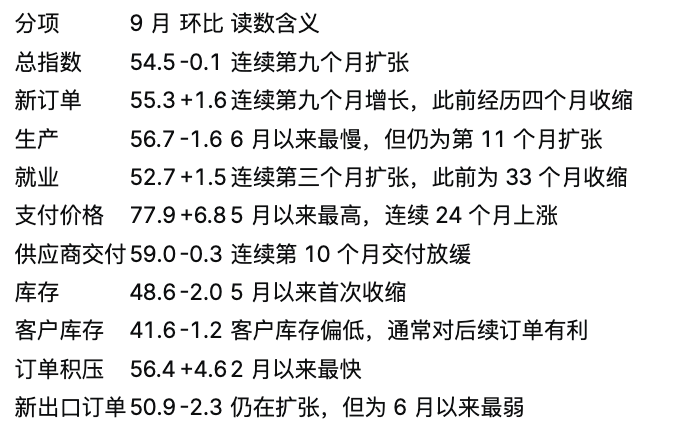
According to historical ranges compiled by Haver Analytics, the September employment sub-index at 52.7 remains below its March 2022 peak of 56.5 but has clearly recovered from its November 2025 low of 44.1; prices paid at 77.9 is below the March 2022 reading of 87.1 and the June 2021 reading of 92.1, elevated but not extreme. The headline index at 54.5 is above September 2025's 48.9 and October 2024's 47.0, but below the March 2021 cycle peak of 63.8.
What Each of the Three Signals Means
New Orders and Order Backlogs
New orders is the most leading of the sub-indices. In September it rose to 55.3 while order backlogs jumped 4.6 points to 56.4, the fastest since February. The two rising together indicates that demand is not only being generated but is outpacing the capacity to fulfill it in the current period. Customer inventories at a low 41.6 further support this view; when customers hold lean stock, restocking demand typically converts into orders in subsequent months. If new orders hold above 55 in October while order backlogs continue to rise, the demand side of manufacturing can be considered solid.
Employment
The employment sub-index carries amplified significance in this cycle. It contracted for 33 months before September, and the rise to 52.7 marks a third consecutive month of expansion. However, the September unadjusted detail shows that 15.3% of respondents reported hiring increases while 14.5% reported decreases—a gap of less than one percentage point, suggesting the expansion's foundation is not solid. If this sub-index falls below 50 in October, it would suggest the three-month improvement may have been catch-up hiring rather than a trend reversal.
Prices Paid
This is the item in the report most directly linked to the rate path. Prices paid rose 6.8 points to 77.9 in September, the highest since May and the 24th consecutive month in expansion territory. The distribution data is more telling: 58.6% of respondents reported higher input prices while only 2.8% reported lower—a ratio exceeding twenty to one. Such input cost pressures typically pass through to consumer prices within a few months.
S&P Global's preliminary October Manufacturing PMI at 56.0 exceeded the expected 55.5, and its accompanying commentary also noted further increases in inflationary pressure. Both surveys point in the same direction for October, raising the likelihood that ISM prices paid remains elevated.
Why the Two PMIs Cannot Be Compared Directly
ISM and S&P Global Manufacturing PMIs are two independent surveys with different sample compositions, sub-index weights, and seasonal adjustment methods; the gap between September's ISM reading of 54.5 and S&P Global's 55.9 reflects methodological differences rather than contradiction. The practical approach is to look at each series' position and direction relative to its own history, rather than comparing the two numbers directly.
Their relevance for October also differs. S&P Global's preliminary reading was released on October 23, covering survey responses from the first three weeks of the month; ISM's survey covers the full month, and its prices paid sub-index has long carried greater weight in market pricing than the S&P Global equivalent. Thus S&P Global's preliminary provides directional guidance, while ISM's sub-index structure is what will actually be traded tonight.
Transmission Path
The Manufacturing PMI does not directly determine asset prices; transmission runs through rate expectations. At its October 28 meeting, the Federal Reserve kept the federal funds rate target range at 3.75% to 4.00% in a 10-2 vote, with both dissenters favoring further hikes; afterward, CME Group's FedWatch tool showed an 85.0% probability of a December hike, up from 78.3% the prior day. September CPI was 3.7% year-over-year with core at 2.6%. Against this backdrop, the direction of the prices paid sub-index will feed directly into December pricing.
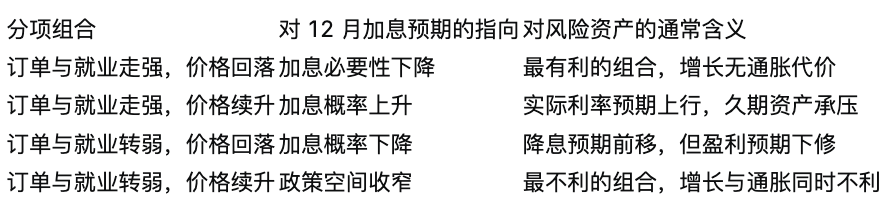
For US Treasuries, prices paid above September's level typically pushes short-end yields higher; industrial stocks are more sensitive to new orders and order backlogs than to the headline index; and the dollar's direction often depends on how the data shifts rate differential expectations between the US and other major economies.
Bitcoin's reaction mechanism to macro data of this kind is similar to that for employment data—transmission runs mainly through rate expectations rather than the data itself—and moves are amplified during thinner liquidity periods. At 23:00 Beijing and Singapore time, the European and US sessions overlap, so depth is relatively sufficient, but price action in the first few minutes after release typically does not represent the day's conclusion. The immediate market reaction can be tracked on the Bitcoin price page.
James Mitchell's Exclusive View
The absence of a consensus for this release changes the trading structure itself. When there is a consensus, the first price reaction is driven by the gap between the headline and expectations—direction is clear and rapid; without one, participants can only anchor to their own reference points, the first reaction is more prone to back-and-forth, and true pricing often waits until the sub-index data has been digested. What is more worth watching tonight is the direction ten to twenty minutes after the release, not the first thirty seconds.
The core variable I am watching is prices paid. A reading of 77.9 is not in itself rare; what is rare is the 6.8-point single-month jump and the 58.6% versus 2.8% distribution. With the Fed having just held rates in a 10-2 vote, two dissenters favoring hikes, and December hike probability already priced at 85%, a further rise in input costs would add ammunition to the hawkish side. Conversely, if prices paid retreats toward 70 while new orders holds above 55, that would be a rare benign combination in this cycle—more meaningful for duration-sensitive assets than any interpretation of the headline.
As for the employment sub-index, I tend to view it as a confirming indicator rather than a leading one. Three months of expansion after 33 months of contraction, with the share of respondents reporting hiring increases and decreases differing by only 0.8 percentage points, does not yet constitute a trend. Its role is to validate the durability of new orders: if orders strengthen while hiring does not follow, companies see the improvement as temporary; only when both move together can we say manufacturing is truly expanding.
FAQ
When is the October ISM Manufacturing PMI released?
23:00 Singapore time on November 2, corresponding to 10:00 Eastern Time and 15:00 UTC. This is one hour later than recent releases because US daylight saving time ended on November 1.
What is the market expectation?
As of the release, major financial calendars had not published a consensus, and forecast columns were blank. The reference point is the direction of recent deviations: three of the last five releases came in below expectations, with September actual at 54.5 versus expected 54.8.
What did the September data show?
The headline index was 54.5, down 0.1 point month-over-month and the ninth consecutive month of expansion. New orders rose 1.6 points to 55.3, employment rose 1.5 points to 52.7, prices paid rose 6.8 points to 77.9, production fell 1.6 points to 56.7, and inventories fell 2.0 points to 48.6. Twelve of 18 manufacturing industries reported growth.
Why is the prices paid sub-index the most closely watched?
Because it is most directly linked to the rate path. In September it was the highest since May, the 24th consecutive month in expansion territory, with 58.6% of respondents reporting higher input prices versus only 2.8% reporting lower. With December hike probability priced at 85%, further increases in input costs would reinforce hike expectations.
What is the difference between ISM and S&P Global PMIs?
They are independent surveys with different sample compositions, sub-index weights, and seasonal adjustment methods; the figures are not directly comparable. S&P Global's preliminary October Manufacturing PMI was 56.0, covering the first three weeks of the month; ISM's survey covers the full month, and its prices paid sub-index has long carried greater weight in market pricing.
What does the 50 line mean?
A headline index above 50 indicates overall manufacturing expansion; below 50 indicates contraction. In addition, a reading above 47.5 generally corresponds to the broader economy still expanding. Supplier deliveries and customer inventories read in the opposite direction from other sub-indices, with higher readings indicating slower deliveries and higher inventories, respectively.
How will this data affect Bitcoin?
Transmission runs mainly through rate expectations rather than the data itself. Higher prices paid typically pushes hike expectations higher, weighing on duration-sensitive and risk assets; stronger orders and employment alongside falling prices is a relatively favorable combination. Moves in the first few minutes after release typically do not indicate the day's direction.
Will this article be updated after the data is released?
Yes—actual figures, deviations from expectations, and sub-index structure analysis will be added on the same page.
Disclaimer
This article is for general informational purposes only and does not constitute investment, financial, legal, or tax advice. Data cited is as of before the November 2, 2026 release; judgments may change after the October actuals are published, and all indicators should be based on the original report published by the Institute for Supply Management. Crypto assets and leveraged products are highly volatile and may cause losses exceeding principal. Readers should independently verify the original disclosures, form their own judgments, and consult appropriately qualified professionals where necessary.