


CPI came in above expectations, and high volatility in US stocks is not over yet: How should tech stocks be defended, and how should pullback opportunities be seized?

US October CPI rose 0.4% month-over-month and core CPI rose 0.3%, both above expectations; market pricing for a 25 basis point rate hike in December climbed to nearly 90%, and the 10-year US Treasury yield once again approached 5% intraday. High interest rate pressure has not yet been lifted, but tech stocks have already shown clear divergence: on one side are high-volatility names pressured by valuations and financing costs, on the other are leaders supported by earnings and cash flow. Next, keep your eyes on the 10-year US Treasury yield to judge which positions need defending and which pullback opportunities are worth preparing for in advance.
1. After CPI, Focus on the 10-Year US Treasury
On the evening of November 10 Beijing time, US October CPI was released. Headline CPI rose 0.4% month-over-month, lower than September's 0.6% but above the expected 0.3%. Core CPI rose 0.3% month-over-month, basically flat versus the prior two months and still above the 0.2% expectation. Due to the October 2025 government shutdown, the Bureau of Labor Statistics did not collect complete data that month, and this report has no comparable year-over-year figure, so the market can only use month-over-month data to judge whether inflation is stuck again.
By component, shelter remained the biggest contributor, while food and energy also rose. What really matters for trading is that this report did not provide confirmation that "inflation is falling quickly and the Fed can ease off." It points to a picture of sticky inflation and high rates staying in place for a while longer.
The market immediately repriced. Pricing for a 25 basis point hike in December rose from 78.8% on November 9 to about 89.8% after the CPI release, while pricing for 50 basis points rose to about 12%. The direction is basically set; what remains is the magnitude.
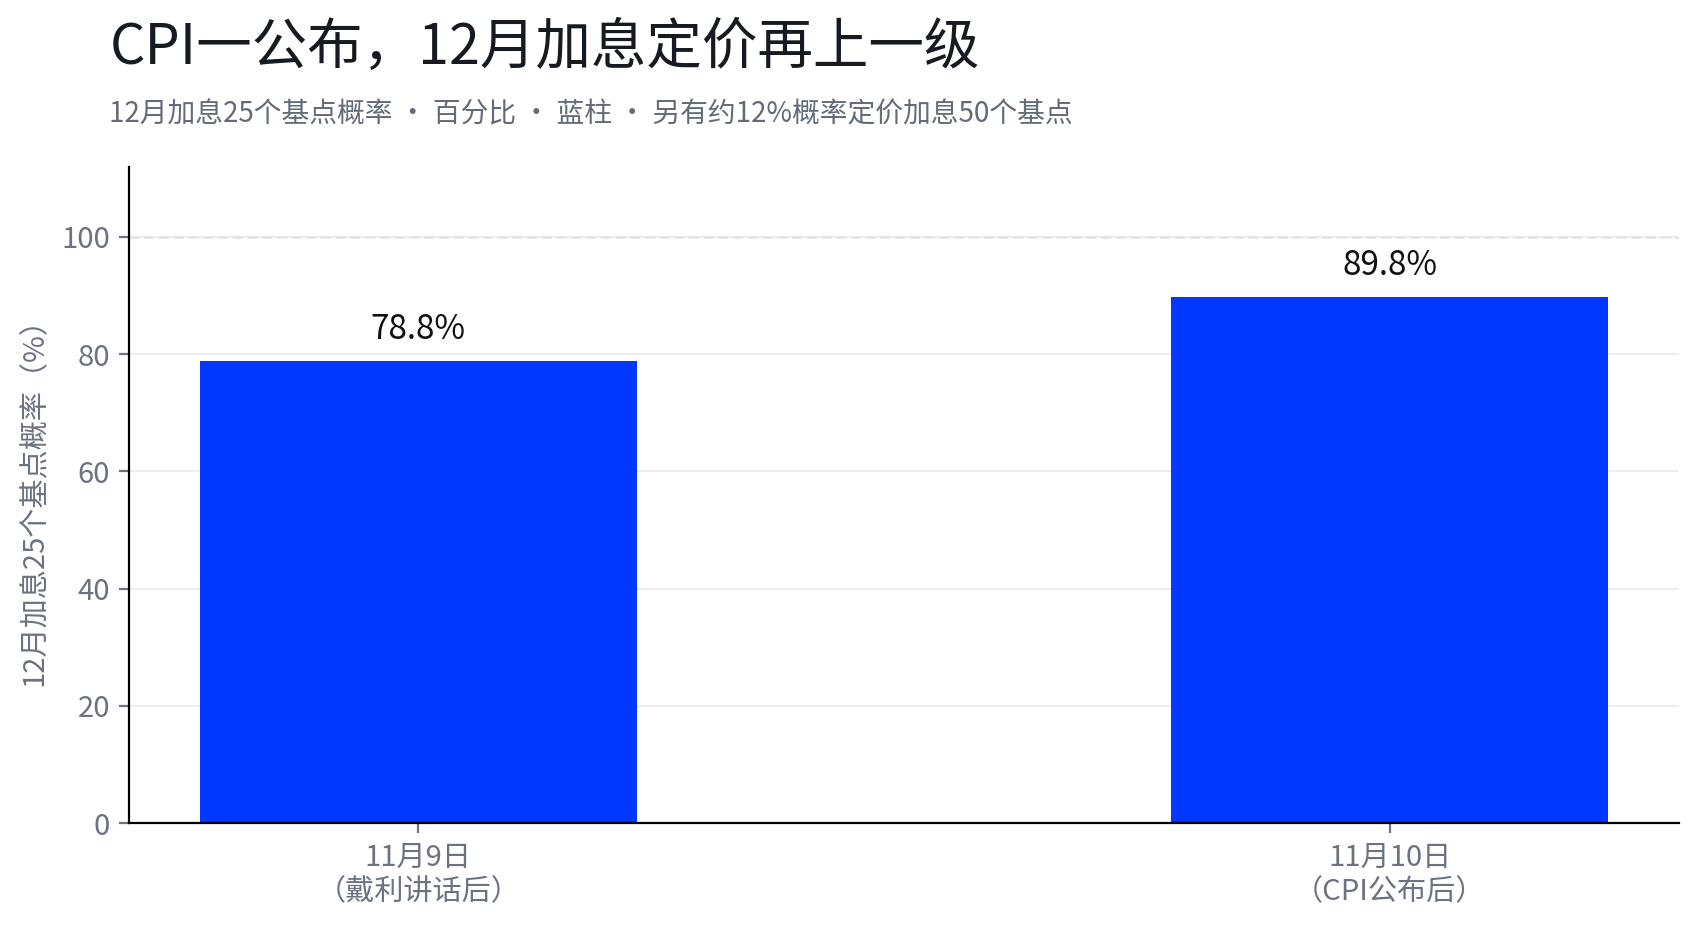
Chart note: Market pricing for a 25 basis point hike in December was 78.8% on November 9 and rose to 89.8% on November 10 after the CPI release. Another roughly 12% was priced for a 50 basis point hike. Blue bars represent probability in percent.
The size of the hike itself is increasingly converging toward the market's baseline scenario, and the room for directional bets on 25bp versus 50bp is shrinking. What equities are really trading is the level of rates. After the CPI release, the market repriced the rate path, first pushing the 10-year US Treasury yield back to the 5% threshold, which then transmitted from yields into growth stock valuations. So going forward, don't fixate on whether December brings 25 or 50; focus on US10Y. How high it goes and how long it refuses to turn back determines where the valuation floor for growth stocks lies. Every subsequent inflation print and every Fed speech ultimately lands on stock prices through this number.
2. US10Y Above 5%: Who Gets Hit by Valuation Compression First
The market turmoil on November 5 was valuation compression, and it may well happen again before the hike lands. That day the Nasdaq fell 5.52%, the S&P 500 fell 4.36%, and the Philadelphia Semiconductor Index fell 12.25%. Among individual names, SanDisk fell 22.26%, Micron fell 17.46%, Western Digital fell 17.35%, AMD fell 17.26%, and Nvidia fell 9.26%. On November 10 there was another smaller repeat: the Philadelphia Semiconductor Index closed at 9,998.33 points, Nvidia fell about 5.5% for a second consecutive trading day, and its market cap shrank by about $430 billion over two days.
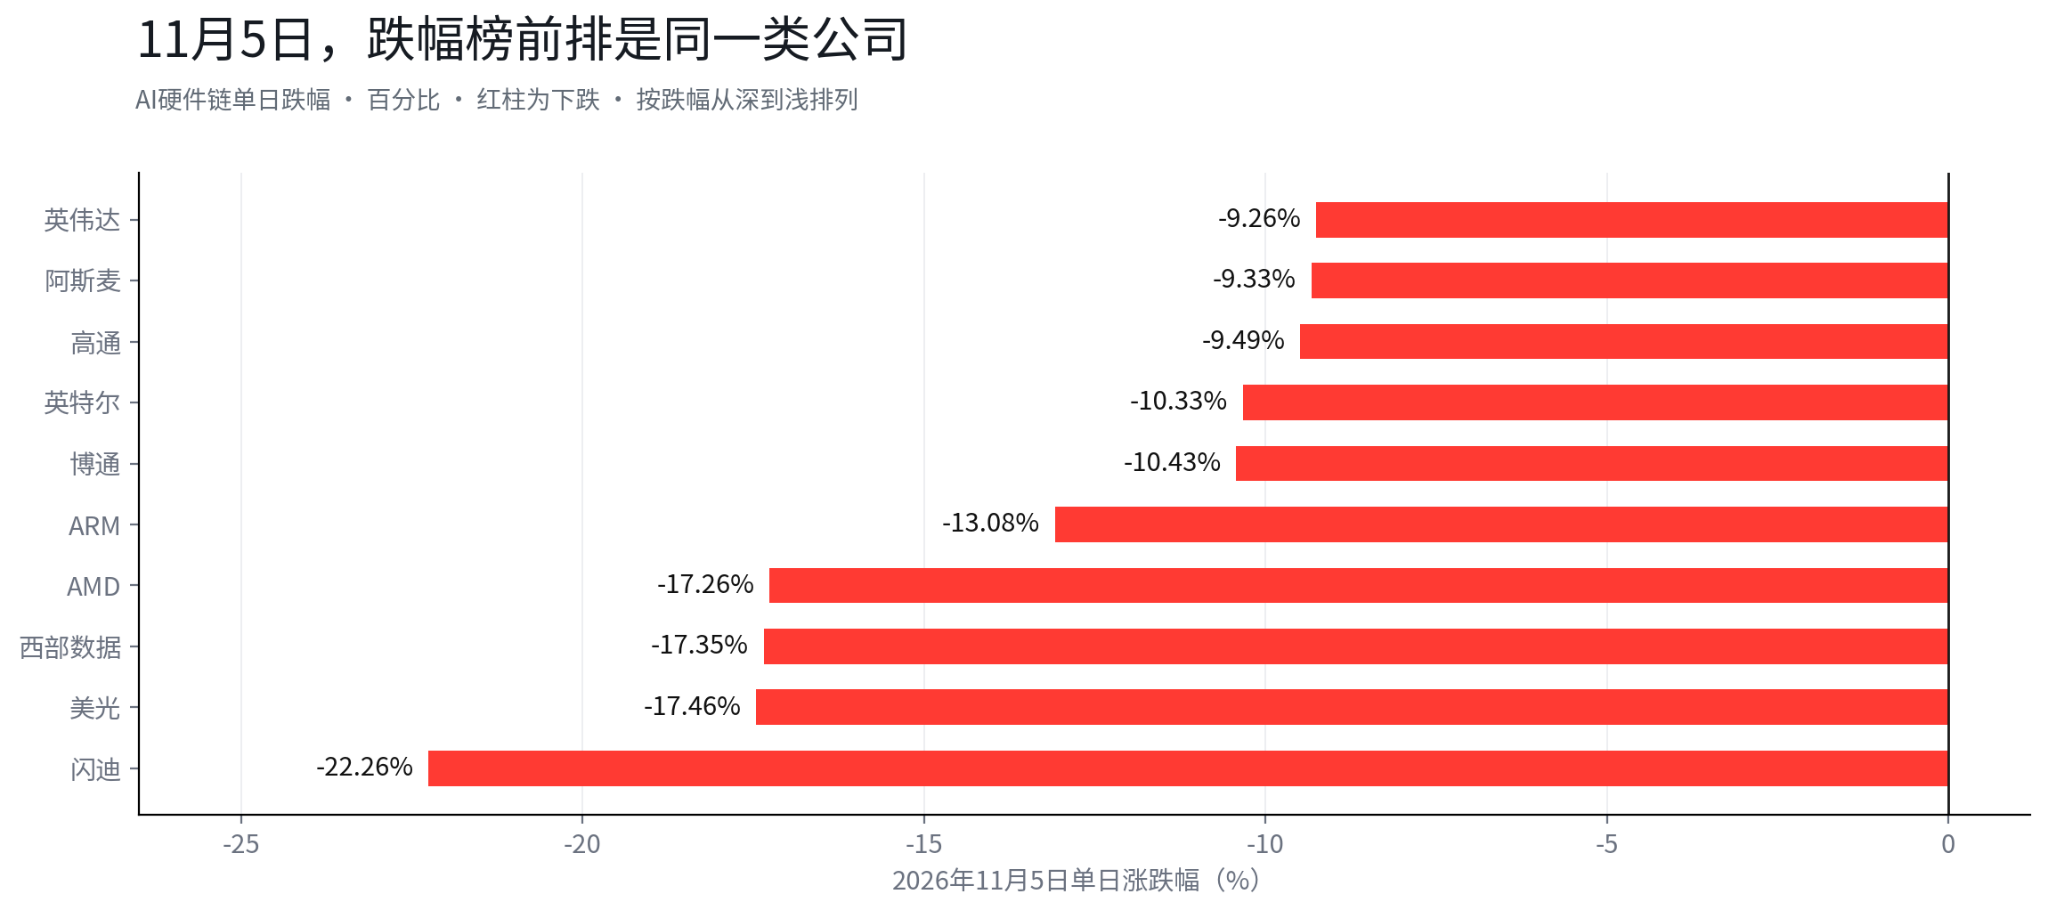
Chart note: Single-day declines of major AI hardware chain stocks on November 5. SanDisk, Micron, Western Digital, AMD, and Nvidia all posted declines of more than 9%. Red bars represent declines in percent.
In the three days after the selloff, the market showed the other side. On November 6, the S&P 500 ETF edged up 0.31%; on November 9, the rebound was pronounced, with the S&P 500 ETF up 2.36% and the Nasdaq ETF up 3.54%. On November 10, as soon as CPI was released, part of those gains were given back, with the Nasdaq ETF down 0.68% that day. A sharp drop, a rebound, and another pullback within one week: this is the typical rhythm of a phase with unstable rates, when both one-sided bearishness and one-sided chasing of rallies are prone to getting whipsawed.
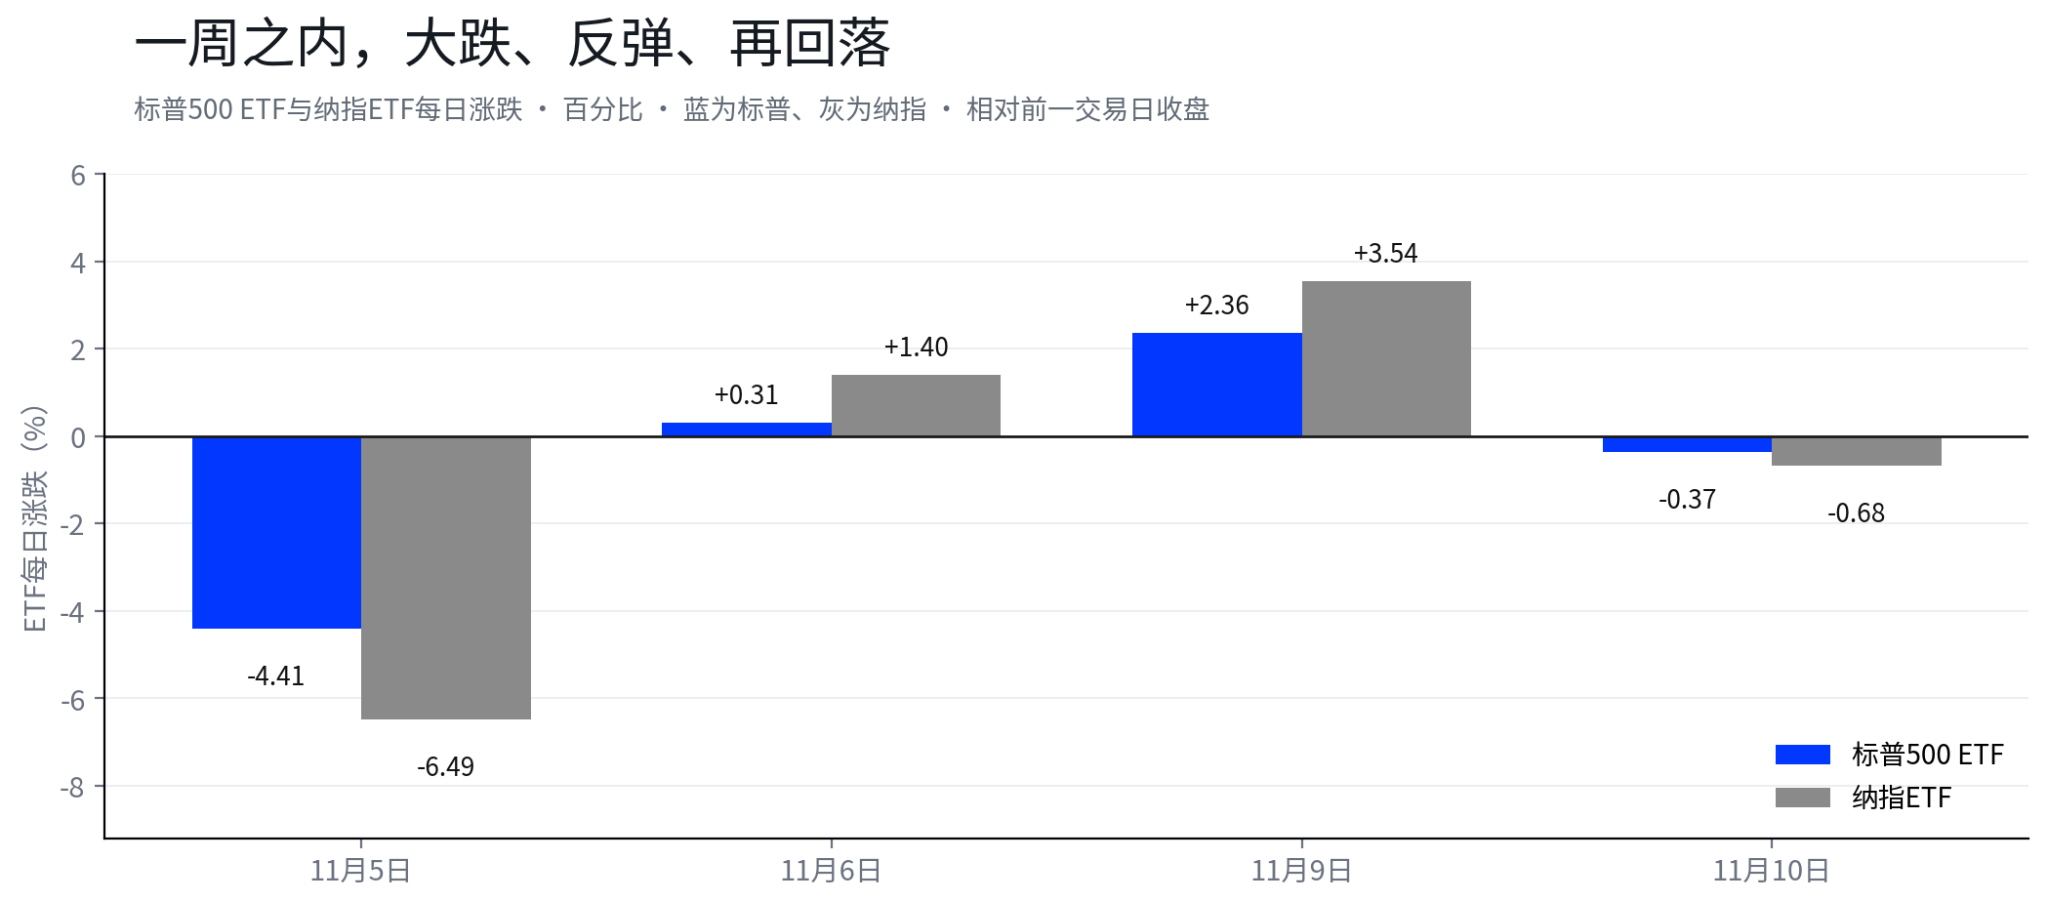
Chart note: Daily moves of the S&P 500 ETF and Nasdaq ETF from November 5 to 10. Both rose on November 6 and 9, then fell again on November 10. Blue bars represent the S&P 500 ETF, gray bars represent the Nasdaq ETF, in percent.
Put Nvidia, AMD, Micron, Western Digital, and CoreWeave together and the common thread is clear. Their valuations either rest on cash flows several years out or their expansion is sustained by round after round of financing. When the discount rate rises, the present value of far-future cash flows falls fastest, and financing costs climb with rates, so they get hit on both ends. This is the pool with the highest rate sensitivity; whenever US10Y is above 5%, these names are always at the front of the decliners' list.
CoreWeave illustrates this logic most completely. From $63.93 at the October 28 close to $43.66 on November 5, it fell about 32% in six trading days and was down about 65% from its 52-week high of $138.25. On November 10, after earnings showed revenue up 168% year-over-year and guidance was raised, the after-hours price immediately jumped about 7.4%. The revenue is real, and the financing dependence is real too; good revenue gives it a lift, and rate news pushes it back down. The conclusion is simple: CoreWeave is better tracked in the high financing-sensitivity pool and should not be put in the same oversold tech basket as Microsoft, Broadcom, and TSMC.
The point here is not that "none of these stocks can be touched," but to make clear where volatility mainly comes from during a phase of rising rates. How much of your portfolio is in such names determines how much your account swings along with US10Y.
3. Don't Lump All AI Stocks Together: Split the List into Four Baskets
Rate sensitivity is one thing; whether a pullback is worth waiting for is another. Separate AI-related holdings by cash flow strength and valuation level, and in practice that gives you four baskets, each requiring different next steps.
Core watch basket: names with relatively stable cash flow. Earnings and free cash flow are both backed by the latest reports: Microsoft's latest quarter net income was $36.629 billion; Broadcom's prior quarter net income was $13.088 billion with free cash flow of $13.665 billion; TSMC's third-quarter net profit was NT$762.6 billion with free cash flow of NT$510.1 billion. The logic is to first see whether US10Y has stopped rising, then wait for valuations to mean-revert. When broad market de-risking drags them down, they fall less than the sector and stabilize earlier.
Pullback watch basket: names like Google. Earnings are fine, with third-quarter net income of $26.468 billion; what needs verification is whether the chain of AI capex, cloud and AI revenue, and free cash flow actually works. Free cash flow for the quarter was negative $9.065 billion because single-quarter capex reached $51.355 billion. The question to watch with Google is very specific: when does such high capex turn back into cash flow? If capex growth starts to slow in subsequent quarters while cloud and AI revenue continue to rise, the market will reprice this investment.
High-volatility trading basket: examples include Nvidia, AMD, Micron, and Western Digital. This basket requires watching not only US10Y but also the AI capex cycle and the next earnings guidance. Falling rates alone are not a reason to buy; continued upward revisions to downstream capex guidance are. In both the November 5 and November 10 selloffs, the front of the decliners' list was occupied by this basket.
High financing-sensitivity basket: CoreWeave as an example. Unless rates and the financing environment improve, "it has already fallen a lot" is not a reason to buy. Track these companies as range-bound markets: trim part of the position on rebounds, do not add leverage to catch sharp drops, and treat each earnings report as a checkpoint to re-examine the position.
After splitting into four baskets, one point needs to be made first. This is an observation framework based on cash flow and valuation, not a recommendation list. Companies within the same basket can differ greatly; the names mentioned are only examples screened by the latest earnings reports. The actual screening criteria matter more than the list itself, and each company must be rechecked against its latest report before acting. The question readers should ask also shifts from "should I buy AI stocks" to "which basket do the stocks I hold belong to," which determines how they should be treated in this rate environment.
4. Three Paths for US10Y, Three Corresponding Actions
The next round of US equity trading can perhaps be broken into three layers: US10Y affects valuation pressure, earnings affect profit expectations, and cash flow affects whether AI spending is actually converting into results.
First, US10Y stays above 5% and keeps rising. At that point, watch not only US10Y itself but also the spread between 2-year and 10-year yields, the relative performance of the Nasdaq and the Philadelphia Semiconductor Index versus the broad market, and the relative strength of high-valuation growth versus profitable tech. In terms of action, continue reducing positions with high valuations, negative cash flow, and financing dependence; money that still wants to stay in equities might first move toward defensive areas, with two options detailed in Section 5; names like CoreWeave that oscillate repeatedly should be handled via swing trading, without chasing declines or adding leverage to catch them. Rushing to buy back may be the most expensive mistake in this phase.
Second, US10Y remains elevated but stops making new highs for several consecutive trading days, and equities also stop making new lows in sync with rising yields. This phase is the easiest to miss and also where the real opportunity lies. The index may still look ugly, but some stocks have already stabilized first. At this point, watch for two things happening simultaneously: yields no longer making new highs, and stocks no longer making new lows. If US10Y is still high but Nvidia, AMD, and the Philadelphia Semiconductor Index are no longer making new lows alongside yields, it means the market is beginning to trade a peak in rates ahead of time, which is usually earlier than waiting for the Fed to formally pivot. This is not a stage for adding positions; what should be done is to narrow the watchlist from the AI sector to specific stocks and pick the first batch of names to prepare to buy back. If you wait until US10Y clearly falls before acting, the good prices will mostly have been scooped up by the market first.
Third, US10Y genuinely turns downward and inflation data is also cooling. Under that scenario, the relative outlook for the four types of names may improve in stages, and among them, names supported by cash flow may be more resilient than those that are more cyclical or dependent on external financing. These three tiers of action are not a one-way street. If US10Y climbs back above 5% at some point, you go from the third back to the first.
In the waiting period, the money may first move toward defensive areas, with two options detailed in Section 5; names like CoreWeave that oscillate repeatedly should be handled via swing trading, without chasing declines or adding leverage to catch them. Rushing to buy back may be the most expensive mistake in this phase.
Second, US10Y remains elevated but stops making new highs for several consecutive trading days, and equities also stop making new lows in sync with rising yields. This phase is the easiest to miss and also where the real opportunity lies. The index may still look ugly, but some stocks have already stabilized first. At this point, watch for two things happening simultaneously: yields no longer making new highs, and stocks no longer making new lows. If US10Y is still high but Nvidia, AMD, and the Philadelphia Semiconductor Index are no longer making new lows alongside yields, it means the market is beginning to trade a peak in rates ahead of time, which is usually earlier than waiting for the Fed to formally pivot. This is not a stage for adding positions; what should be done is to narrow the watchlist from the AI sector to specific stocks and pick the first batch of names to prepare to buy back. If you wait until US10Y clearly falls before acting, the good prices will mostly have been scooped up by the market first.
Third, US10Y genuinely turns downward and inflation data is also cooling. Under that scenario, the relative outlook for the four types of names may improve in stages, and among them, names supported by cash flow may be more resilient than those that are more cyclical or dependent on external financing. These three tiers of action are not a one-way street. If US10Y climbs back above 5% at some point, you go from the third back to the first.
5. Directions to Watch During the Waiting Period: Defensive Sectors and Short-Duration Treasuries
Once the de-risking is done, the immediate question is what to watch. Sitting idle in cash costs interest; buying stocks back right away is equivalent to not having reduced at all. There are two directions: those who want to stay in equities should watch defensive sectors, while those temporarily stepping away from equities should watch short-duration Treasuries.
First, defensive sectors. On the day of the big selloff on November 5, the healthcare ETF fell 2.50%, the consumer staples ETF fell 0.75%, and the utilities ETF fell 0.71%, while the Nasdaq fell 5.52% over the same period. From the November 4 close to November 10, the S&P 500 ETF was still down 2.2% and the Nasdaq ETF down 2.5%, while utilities had turned positive and healthcare had basically recovered. The role of defensive sectors during this period is to give money that has cut high-valuation positions but still wants to stay in equities a lower-volatility parking place. It won't capture AI's upside, nor will it bear AI's drawdown; once rate signals become clearer and the growth basket gives buy conditions, you can rotate over from there.
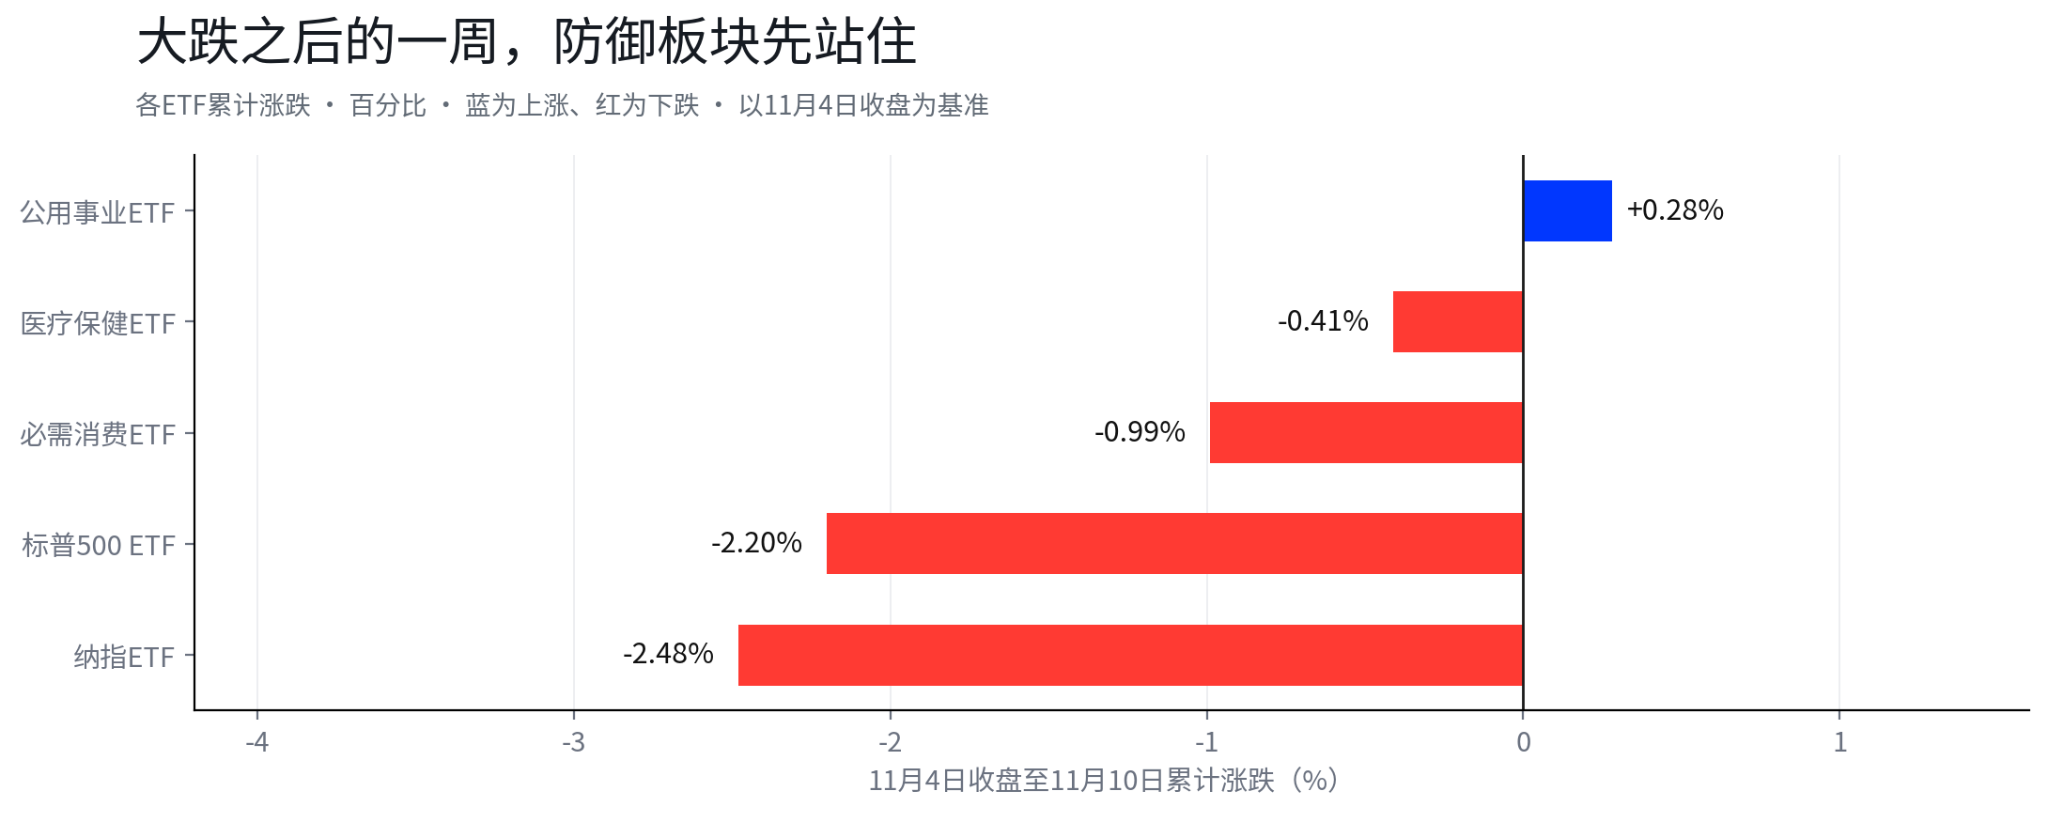
Chart note: Cumulative moves of various ETFs from the November 4 close to November 10. The utilities ETF turned positive, while healthcare and consumer staples fell significantly less than the S&P 500 and Nasdaq. Blue bars represent gains, red bars represent declines, in percent.
The other destination is short-term US Treasury ETFs, suitable for the portion of money that wants to temporarily leave the stock market. SGOV, BIL, and SHV are backed by short-term US Treasury bills, with returns coming from interest and extremely short duration. Take SGOV: its effective duration is about 0.09 years, so its price barely moves regardless of rate changes. The underlying T-bills keep maturing and rolling into new bills, so the higher short-end rates are, the higher the yield on newly invested money. Its 30-day SEC yield read 3.79% at the end of October, a chunk above the idle cash interest in most brokerage accounts.
The rapid rate hikes of 2022 offer a ready comparison. SGOV, BIL, and SHV posted total returns of about 1.58%, 1.38%, and 0.94% for the full year, respectively, while TLT, with duration of more than 20 years, fell 31.41% for the year.
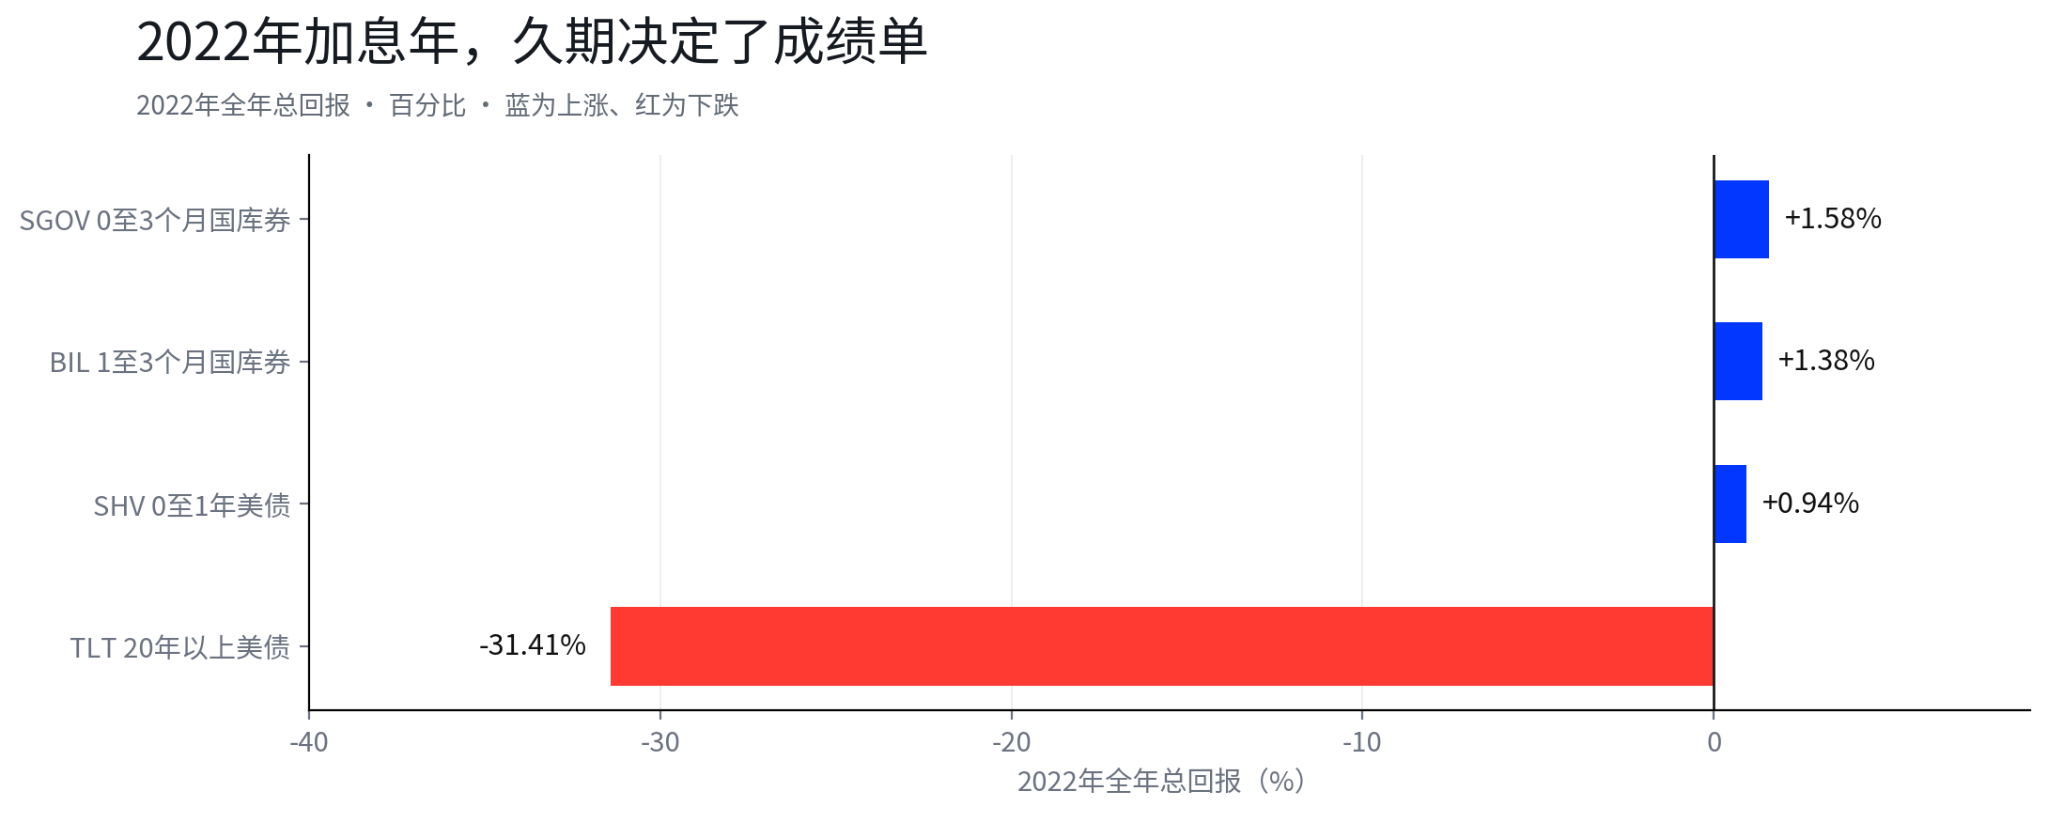
Chart note: Comparison of full-year 2022 total returns. SGOV, BIL, and SHV all posted positive returns, while long-duration TLT fell 31.41%. Blue bars represent gains, red bars represent declines, in percent.
Here is a specific allocation example. An investor with 100 units of capital, 20 of which are earmarked for waiting on an AI tech pullback, could split those 20 in two: put the portion that wants to stay in equities into defensive sectors, and the portion that wants to temporarily step aside into short-duration Treasury instruments, with the short-duration portion accumulating at an annualized rate of more than 3% a day. Once US10Y peaks and companies on the watchlist show qualifying pullbacks, rotate back into stocks one tranche at a time in the basket order from Section 4. Sell stocks, park the cash, earn yield, return on signals: with these four steps connected, the waiting itself generates returns and preserves your ability to act.
This arrangement has nothing to do with being bearish. Those reducing positions may still believe AI is fine long term; short-duration Treasuries simply ensure the waiting period isn't wasted.
6. When the Next Data Comes Out, Four Items to Check
For this framework to work, it depends on coming