


Nebius takes over tonight's earnings baton, CoreWeave's Q3 report leads the way: how much cash flow can $133 billion in orders actually deliver?

CoreWeave's Q3 revenue surged 168%, adjusted operating margin rose to 10%, and the stock price soared 24.7% in a single day; but the yield on its unsecured bonds briefly approached 15%. From legacy GPU renewals and customer prepayments to project financing, let's examine how much of the $133 billion order backlog can actually translate into shareholder cash flow.
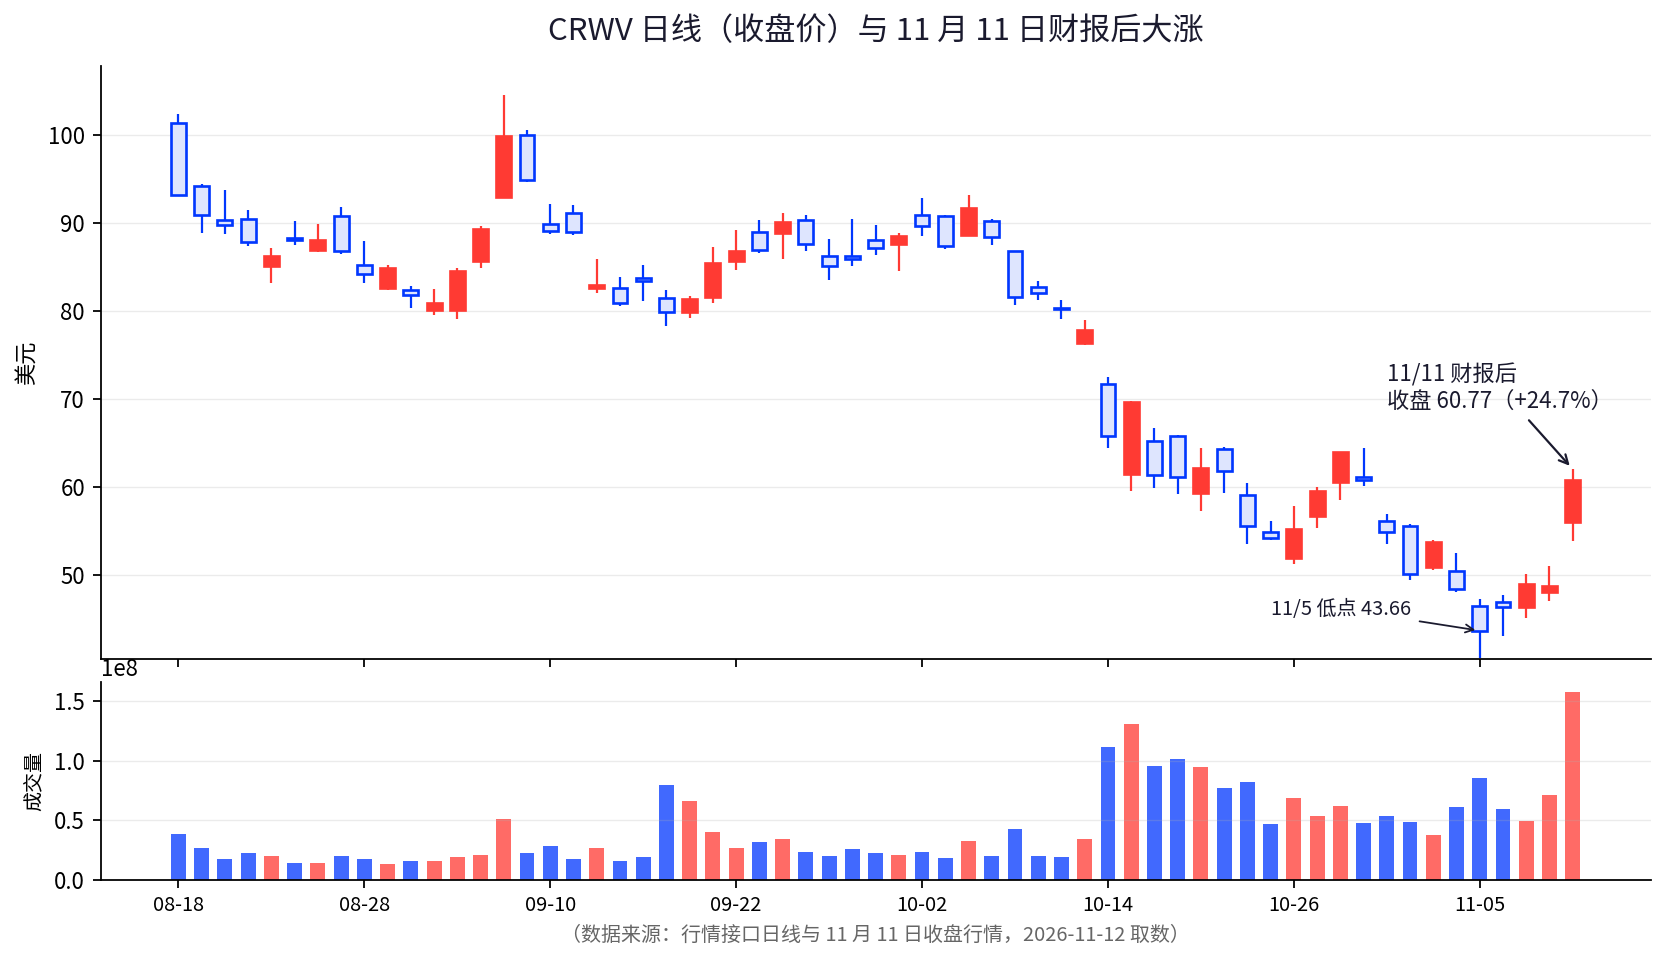
A $133 billion order backlog and a bond yield of around 15% are simultaneously attached to the same company's name. After the market close on November 10, CoreWeave delivered its strongest quarterly report since going public: Q3 revenue of $3.661 billion, up 168% year-over-year, above the upper end of guidance. On November 11, the stock closed at $60.77, up 24.7% from the previous close, with an intraday high of $62.03, and trading volume of 158 million shares, nearly four times the average daily volume of the prior three months. As of the evening of November 11 Eastern Time, it pulled back to around $57 in after-hours trading. But just one month before this earnings release, the company's unsecured bonds had fallen to 79.5 cents, with yields approaching 15.2% (according to public reports).
The past month's price action pushed this divergence to the extreme. From the October high close of $91.72 to the November 5 low of $43.66, the drawdown exceeded 50%; on October 14 it fell about 15% in a single day, and another 12% the next day, during which the unsecured bonds fell to 79.5 cents. On November 11, the first trading day after earnings, it closed at $60.77, up 24.7% in a single day, with volume expanding to nearly four times the prior three-month daily average. Stocks and bonds gave two directions at the same time; what follows is to separate these two directions and see what each is pricing in.
A 15% bond yield, plainly put, means the market is worried about three things: first, I'm not very confident you can smoothly get through the 2027 debt maturities. Second, even if you do get through, I'm worried you won't be able to borrow cheap money by then. Third, if you really go under, I'm last in line, and getting back 30–40% would be a good outcome. These three sentences combined equal 15%. Stocks rose because the results were good; bonds didn't rise because no matter how good the results are, they can't fix the money that's missing before 2027.
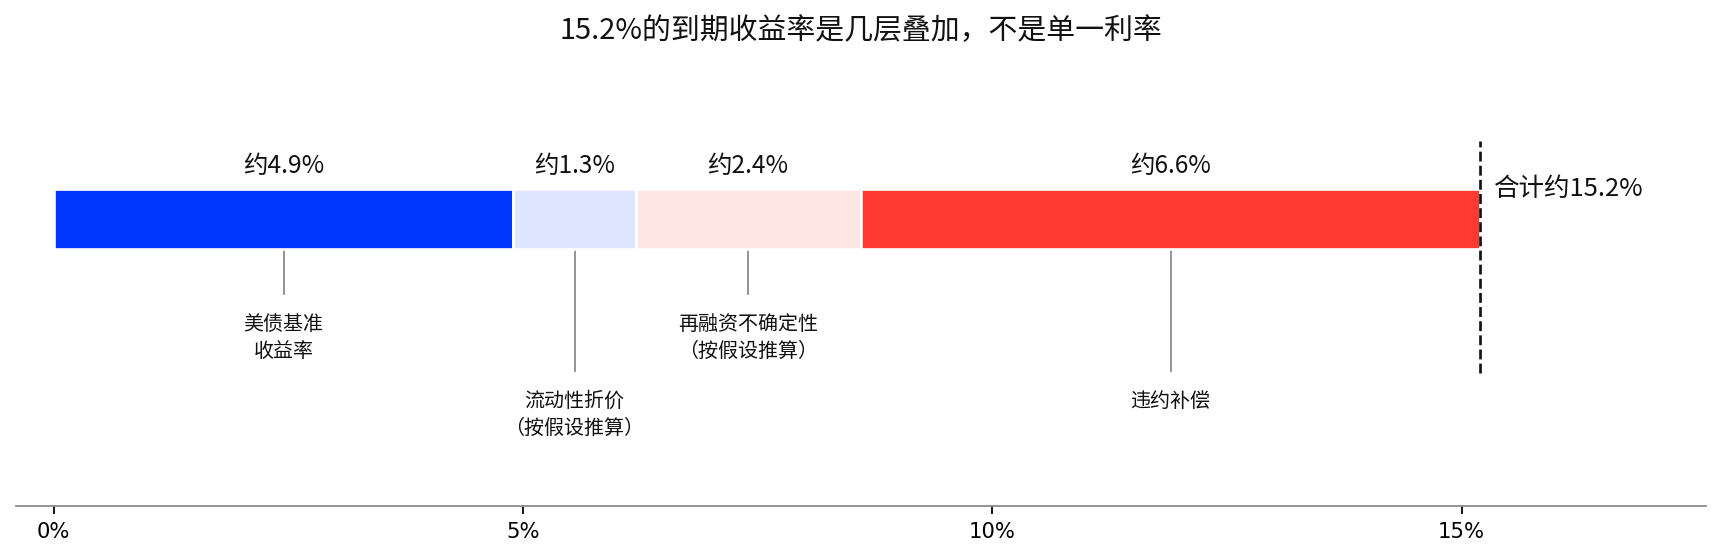
To break it down, 15.2% is not a single interest rate; it's a stack of several layers. At the very bottom is the U.S. Treasury benchmark yield—on November 10, the 10-year Treasury yield briefly touched above 5% (according to public reports). On top of that is the credit spread, totaling about 10.3 percentage points, with default compensation accounting for the bulk, and refinancing uncertainty and liquidity discount accounting for the smaller portion (the layer breakdown is an estimate based on assumptions). What the bond market is expressing with this 15% is something unrelated to profit margins: when those maturing debts around 2027 are rolled over, who holds the pricing power.
This is also why Nebius's Q3 report is worth previewing. Both companies sell AI compute, but one relies more on its own financing to buy GPUs, while the other emphasizes customer prepayments and investment-grade customer commitments. Nebius's earnings fall exactly on the day this article is published—it is a controlled experiment laid out in front of everyone.
1. CoreWeave Delivers a Strong Report Card First: Revenue Surges, Margin Tops 10%
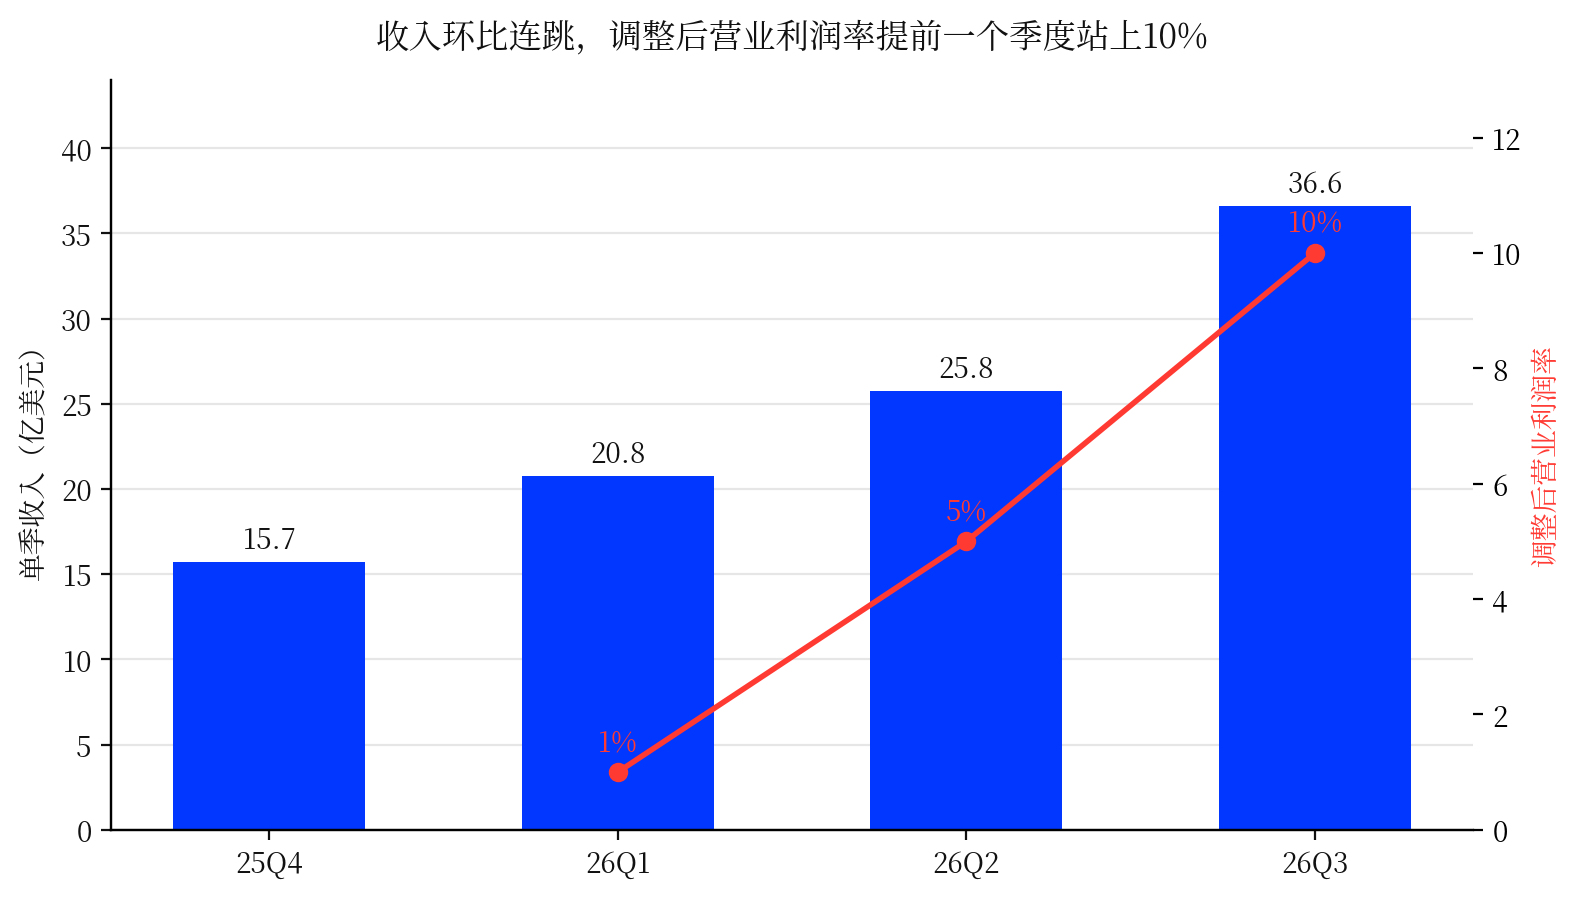
Q3 revenue was $3.661 billion, up 168% year-over-year, but what truly changed market expectations was the margin. Adjusted operating margin rose from about 1% in Q1 and 5% in Q2 to 10%, and management said the low-double-digit margin was achieved one quarter ahead of the original plan. Pricing also moved up in tandem: in July, prices across all products were raised by about 25%, and within the quarter they rose another ~10%; newly signed four-to-five-year long-term contracts rose to $20–25 million per megawatt per year, and short-term contracts can exceed $40 million.
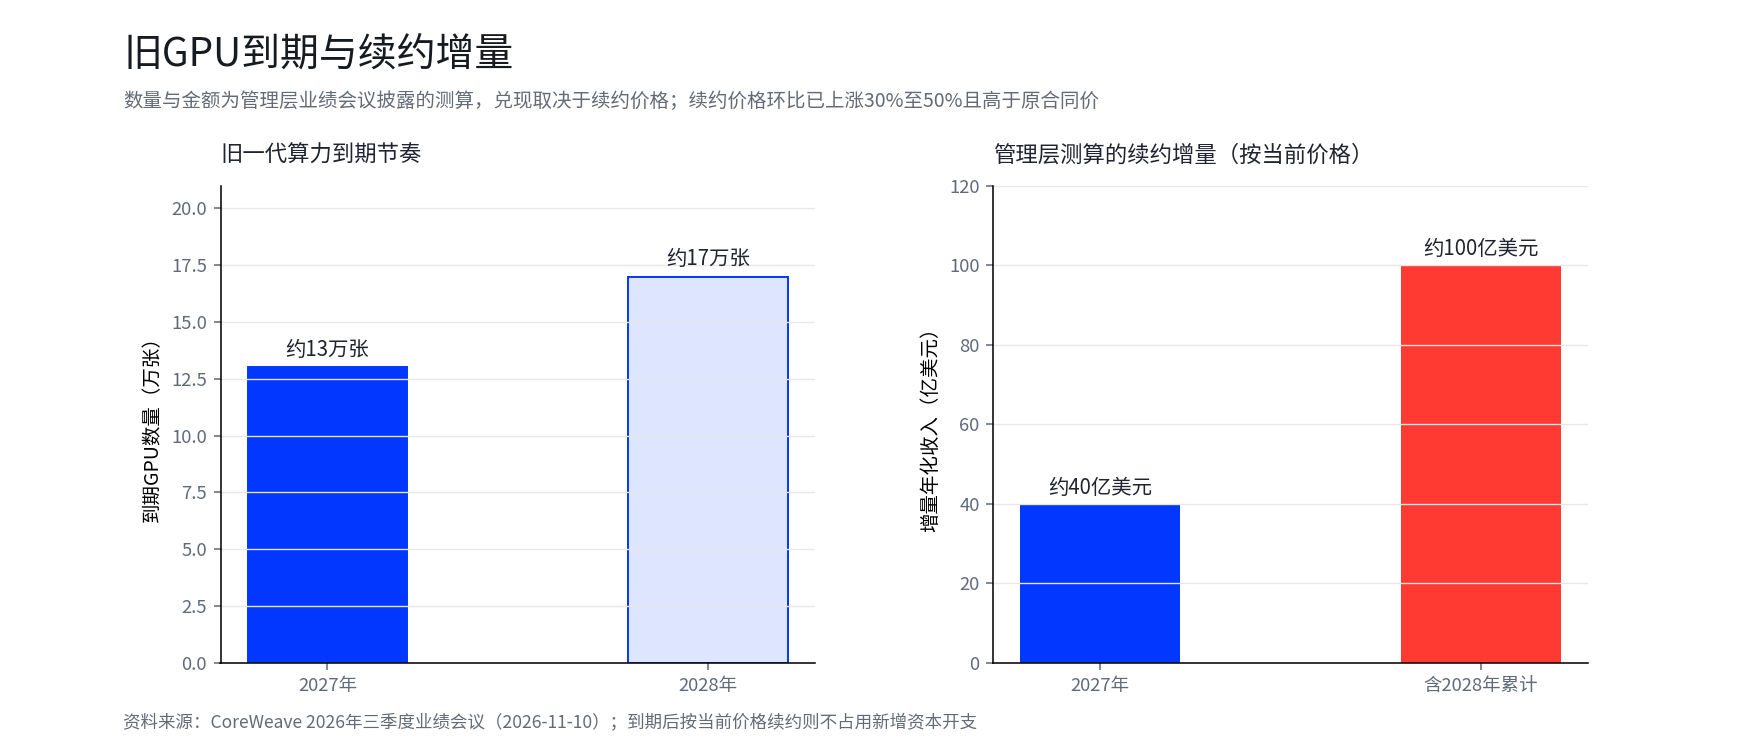
The margin expansion comes from two sources: one is higher prices on new contracts, and the other, easily overlooked, is renewals of legacy compute. Management disclosed that renewal prices for the previous-generation compute rose about 30% to 50% quarter-over-quarter and are above the original contract prices. More than 130,000 GPUs mature in 2027, with another ~170,000 in 2028; renewing at current prices, management expects nearly $4 billion in incremental annualized revenue in 2027, and close to $10 billion including 2028, without requiring additional capital expenditure. New GPUs require new money; renewing old cards is essentially monetizing already-invested assets a second time—this is the highest-quality segment of the income statement.
Old cards renting for more and more needs explaining: GPU price-performance has been improving, compute per dollar on new cards keeps falling, and old-card rents should be pushed down. There are now three explanations:
- Supply bottleneck: power, data centers, and advanced packaging limit new capacity, and customers can't find sufficiently fast substitute compute. Old-card pricing depends on "whether machines are available right now," not on how high compute per dollar is.
- Longer economic life: AI demand makes GPU residual values higher than traditional depreciation assumptions.
- Immediate-delivery premium: customers pay a premium to get compute right away. Once new capacity comes online and wait times shorten, renewal prices could fall quickly. The first two support a sustained premium; the third implies the premium gives back.
To distinguish them, watch renewal prices, the rental price gap between new and old GPUs, delivery wait times, and old-card utilization. If 2027 renewal prices come in below original contract prices, this bullish thesis will be overturned for the first time.
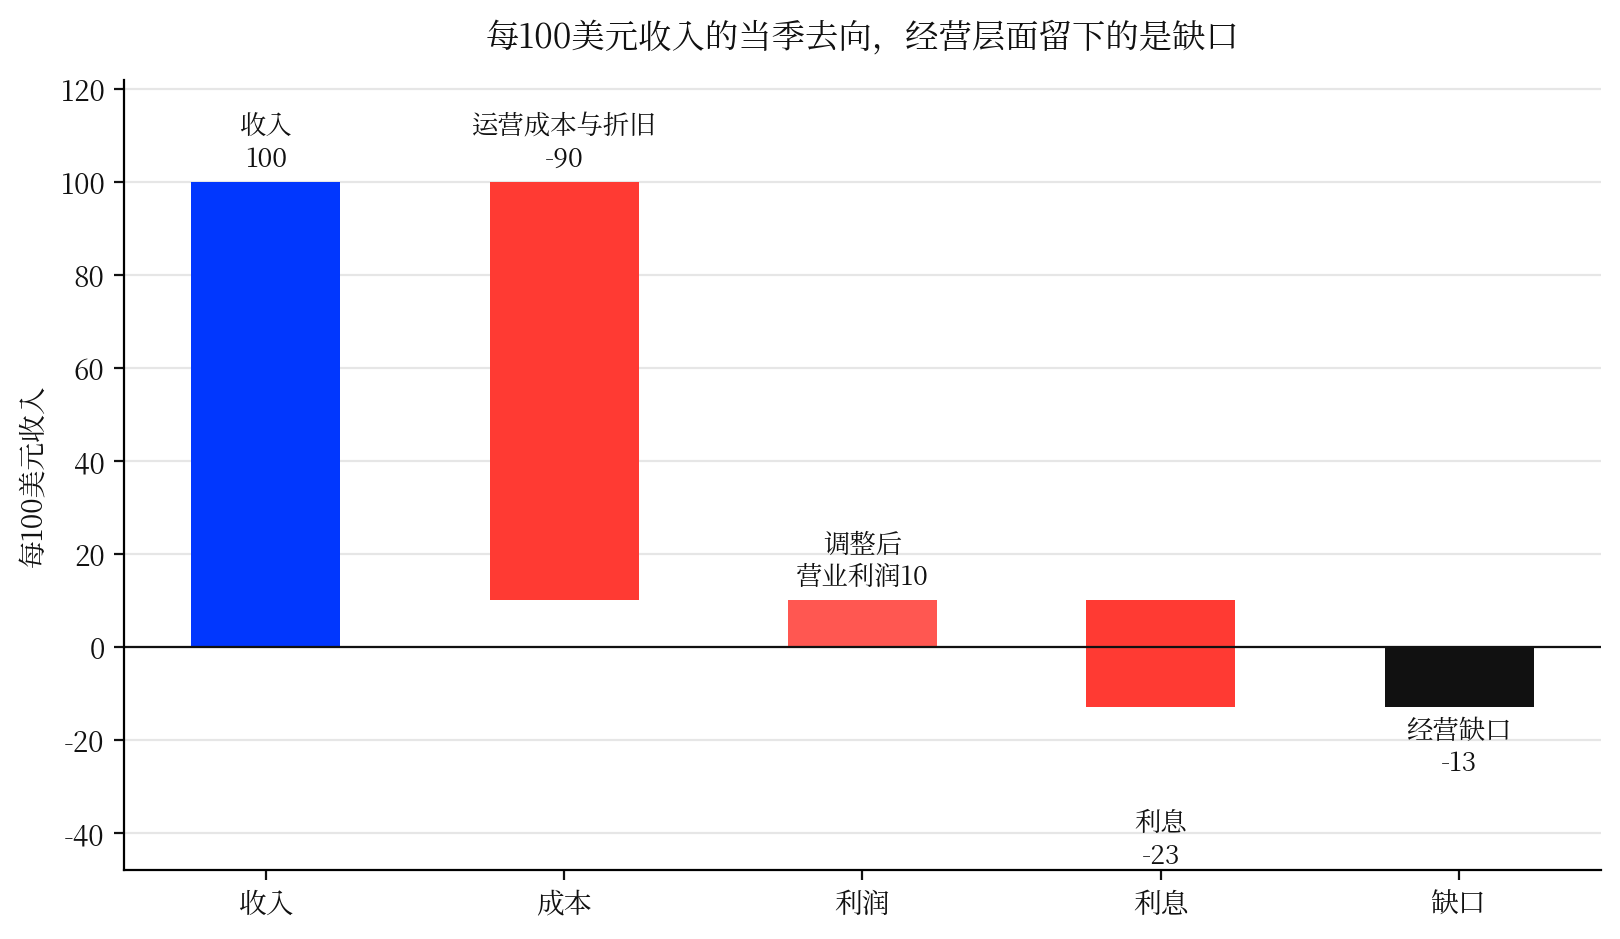
Interest always ranks ahead of shareholders. Q3 adjusted operating profit was $379 million, interest expense was $846 million, with interest at about 23% of revenue—operating profit cannot cover interest. Based on full-year guidance, interest is about $3.1 billion, or 23%–24% of $13–13.3 billion in revenue. Management expects losses to narrow significantly in 2027 and turn positive in 2028; what the market is trading is precisely "whether profit growth can outrun interest growth," otherwise the valuation logic reverses. The answer can only be found on the order and financing side; the biggest change in the Q3 report was a single-quarter increase of about $29 billion in backlog.
2. The $133 Billion Backlog Is Tempting, but Orders Are Not Cash: The Real Question Is How to Finance It
At the end of Q3, CoreWeave's backlog rose from about $104 billion at the end of Q2 to $133 billion, with more than half expected to begin delivery before year-end. Management further stated that 2027 capacity is essentially sold out, while 2028 is not yet fully sold out. Order growth solves the demand problem but does not solve the financing problem.
A long-term compute contract does not turn into cash on signing day. CoreWeave must first build data centers, procure GPUs, and pay power and infrastructure costs, then recognize revenue over the contract period. Roughly assuming a five-to-six-year delivery cycle, the $133 billion in contracts corresponds to average annual recognized revenue of about $22–27 billion, roughly connecting with the company's guidance of exiting 2026 at $20–21 billion in annualized revenue. At the same time, the company's 2026 cash capex guidance reaches $37–39 billion; the faster orders enter the delivery phase, the more money must be invested upfront.
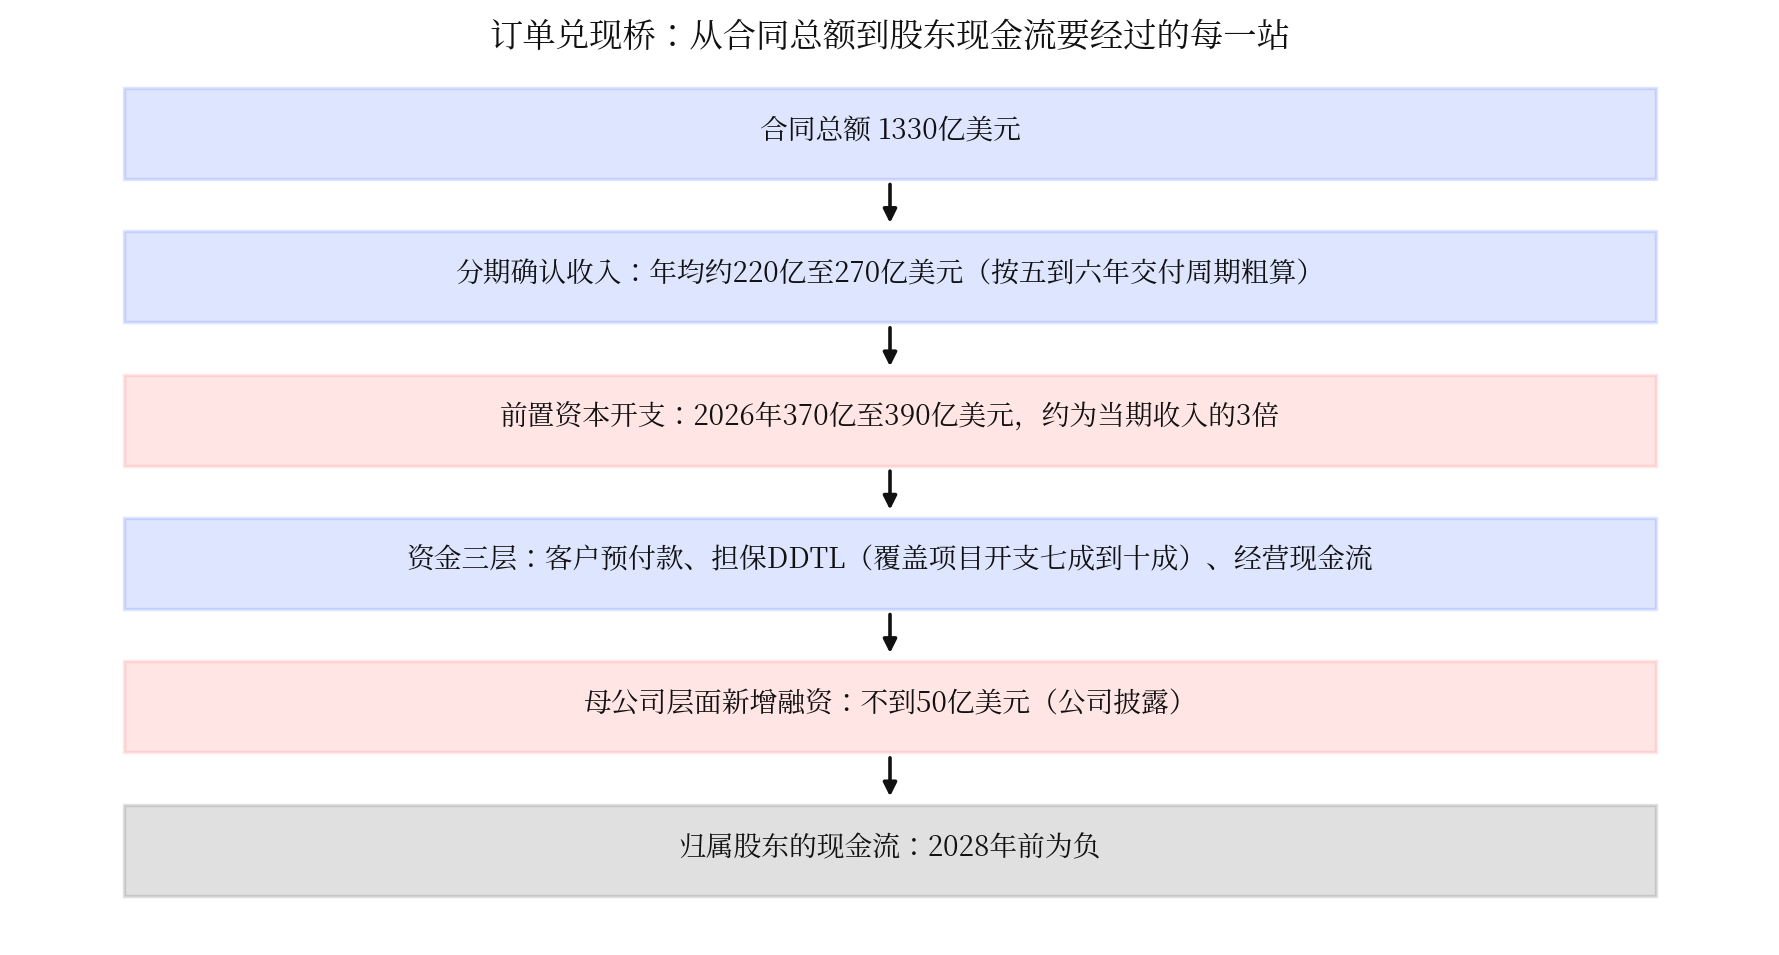
So you cannot simply value the company by dividing orders by revenue. Orders are the total consideration of cash flows over future years; revenue recognition has a time lag, capex occurs before revenue, and interest continuously drains cash throughout. What matters most for CoreWeave now is not how many more orders it signs, but how lightly it can cash in the orders already signed. For the same $10 billion order, if the customer pays first, the contract is rigid, and the customer credit is strong, the risk borne by shareholders may be very low; if the company must borrow to build first, the customer has strong renegotiation power, and financing costs are high, then the larger the contract, the greater the upfront funding pressure.
What matters most for CoreWeave now is not how many more orders it signs, but how much of its own capital it takes to cash in these signed orders and how stable the collections are. Going one level deeper, $133 billion is a range, not a single number:
Clues from the earnings call can roughly place order quality in a neutral-to-optimistic position: on the optimistic side, about 70% of new contracts this year carry prepayments, legacy compute renewal prices rose 30%–50% quarter-over-quarter and are above original contracts, 2027 capacity is essentially sold out, and WACD fell to 7.9%; on the cautious side, the 5-year secured loans correspond to underlying contracts averaging about 3 years, cancellation and renewal rates were not disclosed, and the share of AI lab contracts is unclear. Netting the two sides, the current picture is closer to neutral, with order ranking by tenor and credit discount temporarily prevailing. Going forward, watch tonight's Nebius prepayment and cash flow data, as well as the first batch of 2027 legacy GPU renewal prices. The 30–40% or 50% order discounts discussed in the market are only rough references and cannot be used as precise valuations.
3. Why Have Profits Already Recovered, Yet the Bond Market Is Still Not Reassured?
CoreWeave's financing structure is complex because it does not simply rely on the parent company issuing debt to buy GPUs. Q3 total capex was about $14.5 billion, of which about $9.441 billion was cash equipment purchases, with the remainder including equipment acquired through financing arrangements and other items. The full-year $37–39 billion is cash capex guidance; the two are calculated on different bases and you cannot simply multiply quarterly total capex by four. Checking the pace against cash purchases, the first three quarters totaled about $23.6 billion, and investing another ~$13.5–15.5 billion in Q4 would land within the full-year guidance range.
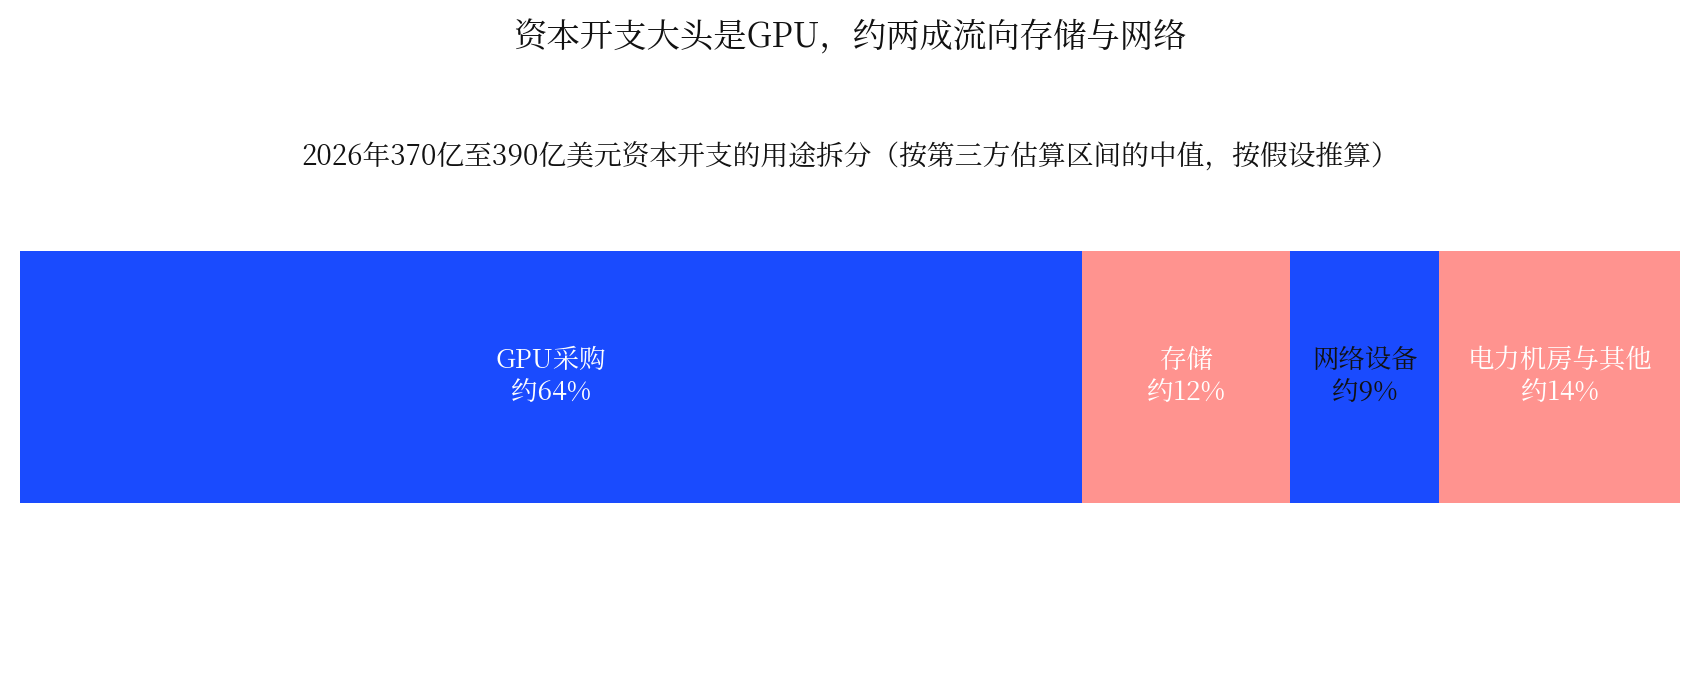
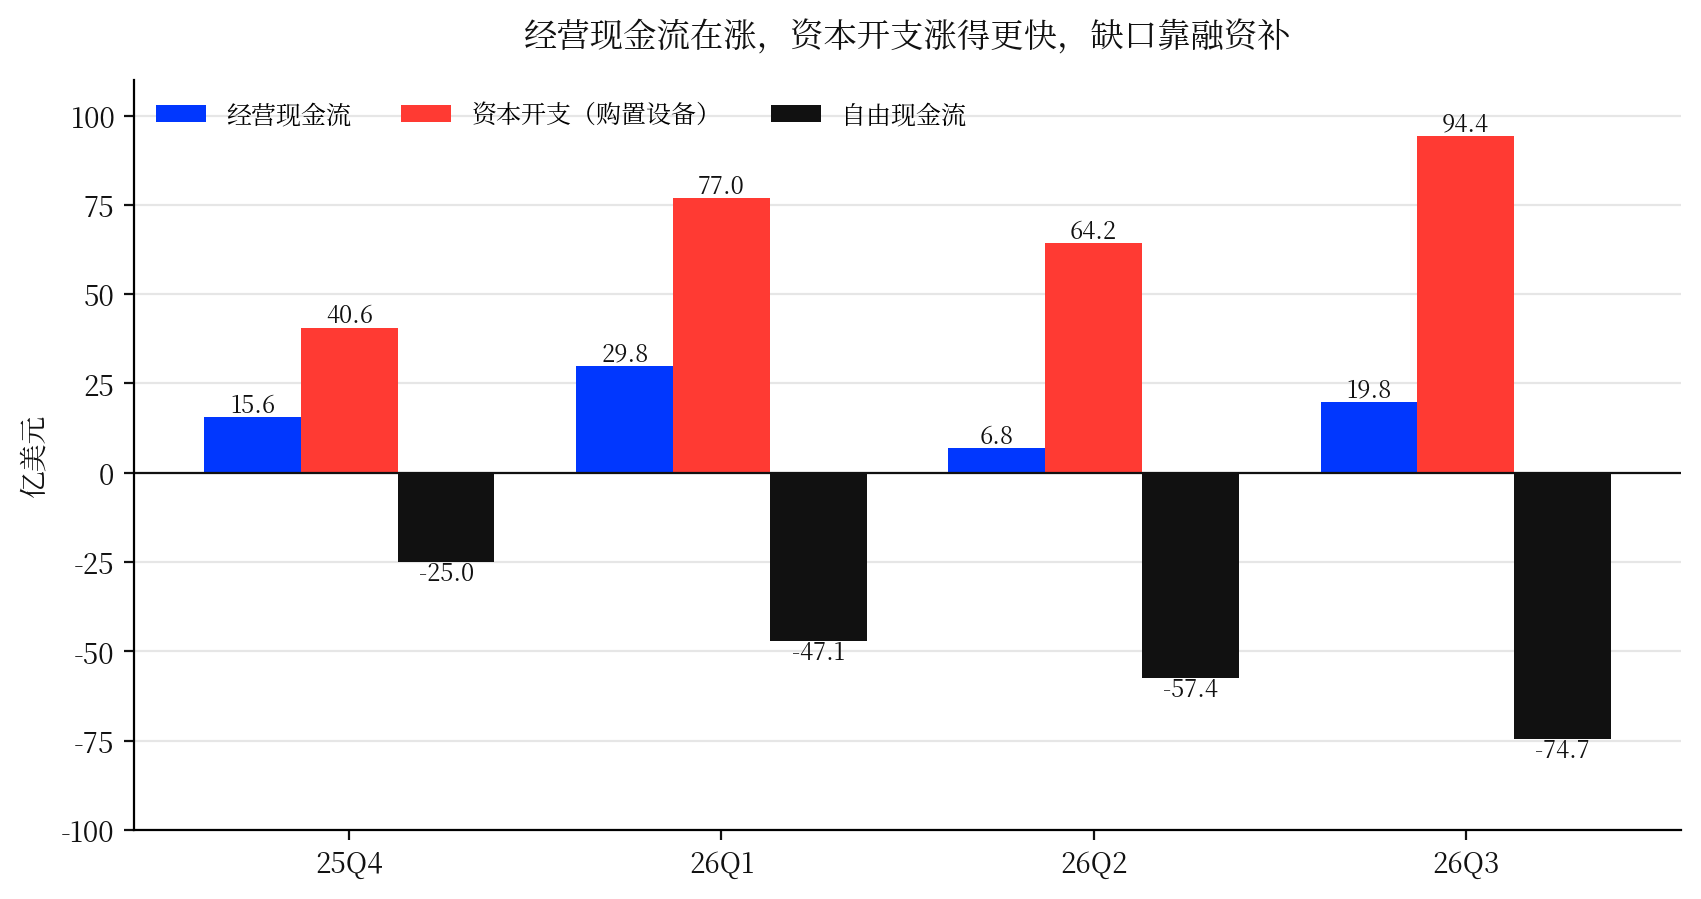
The real stress test is not asking whether the company has money, but seeing whether, if any one leg narrows, the other two can make up for it. Based on assumed calculations, if prepayments are $2 billion lower, the gap can be buffered by undrawn DDTL capacity, at near-zero cost but consuming future headroom. If DDTL available capacity is another $3 billion lower, the gap begins to transmit to the parent company level; if filled at an unsecured bond yield of around 15%, annual interest would be about $450 million, equivalent to one-third of full-year adjusted operating profit guidance. If the margin ramp is also delayed by two quarters and operating cash flow is another $1.5 billion lower, the gap widens further. If all three deteriorate simultaneously, the combined gap expands by about $6.5 billion, and only then would the company truly be pushed toward expensive unsecured debt or even equity financing.
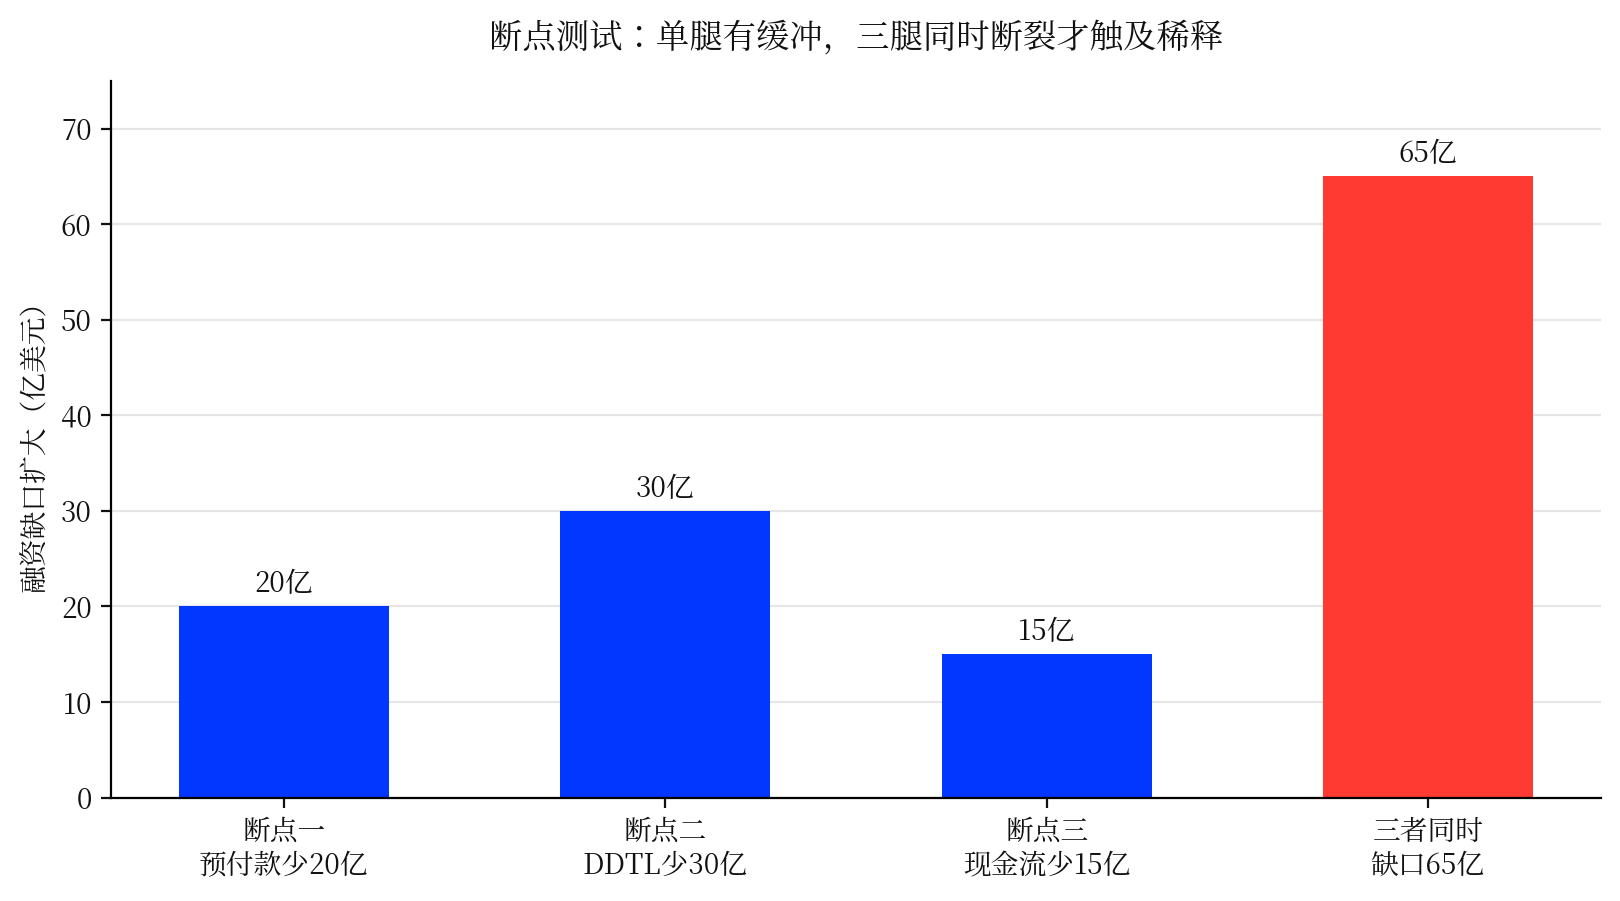
Based on the Q3 report information, let's rank these breakpoints from nearest to farthest:
- Nearest: the prepayment breakpoint. The Q4 and next February's annual report will directly reveal the full-year cash received; this is the only one that could be confirmed or disproven within the next three months.
- Intermediate: the operating cash flow breakpoint. The trigger condition is a delay in the margin ramp, which can only be checked in the Q1 2027 report.
- Farther: the DDTL breakpoint. The coverage test is around October 31, 2027.
- Farthest and heaviest: all three legs breaking at once. The trigger condition is problems with large customers' payments or an overall weakening of industry demand; there is currently no public evidence pointing to it.
What is most worth watching right now is the prepayment leg. This is precisely why the bond market reacts before the stock market. Equity investors look at future profit margins; bond investors look at where the next money comes from. And whether the next money can be borrowed cheaply depends on how the two books—parent company credit and project credit—are separated.
Q3 adjusted operating profit was $379 million against $846 million in interest expense, a coverage of about 0.45x. On a consolidated basis alone, this is not a comfortable number, and Q4 interest guidance rises further to $1.05–1.15 billion. But CoreWeave's debt structure cannot be understood solely through the parent company income statement: corporate credit looks at the entire enterprise's profit, cash flow, and capital structure, while project financing looks at a specific project's own contract cash flows, collateral, and customer credit.
A large portion of CoreWeave's secured loans correspond to specific projects, typically backed by customer contracts, equipment collateral, and cash buffers formed by prepayments; the company disclosed that such loans can cover a large proportion of the corresponding project expenses. So 0.45x does not mean it will immediately be unable to repay debt; what it really shows is that shareholder cash flow at the parent level has not yet formed sufficient debt-carrying capacity, so the company must place as much financing as possible at the project level.
This is also the most fragile link in the entire financing model: projects can borrow on their own contracts and collateral, and slightly weaker parent credit need not drag down every new expenditure; but once project financing requires parent guarantees, the financing system shifts from tiered pricing to whole-entity pricing. At that point, the ~15% unsecured bond yield will truly become a cost to shareholders.
4. CoreWeave's Most Critical Bet: Can Prepayments and Project Financing Cover Capex
CoreWeave's debt does not carry a single uniform interest rate. Taking a third-party compiled Q2 debt breakdown as an example, floating-rate secured debt was about $14.2 billion, and rates across different DDTLs can differ by hundreds of basis points; the same instrument called DDTL can have rates differing by more than 300 basis points—the difference is not in the instrument itself but in the credit of the underlying contracts. Cash flows from investment-grade customer contracts are more readily accepted by lenders, and financing costs are relatively low; AI lab-type contracts face both uncertainty about the customer's own credit and shorter contract renewal terms, so lenders demand higher risk compensation.

The company's disclosed WACD has fallen to 7.9%, down about 250 basis points year-over-year, and in Q3 it prepaid more than $4 billion, including some higher-cost DDTLs. This is a positive signal, because every reduction in financing cost adds another buffer of cash flow left for shareholders after orders are cashed. But WACD can also become a risk amplifier in reverse: credit deterioration pushes new financing into higher rate tiers, higher interest squeezes free cash flow, worse cash flow means more external financing is needed, increased financing demand pushes bond yields higher, the next financing is more expensive, and this feeds back into WACD.
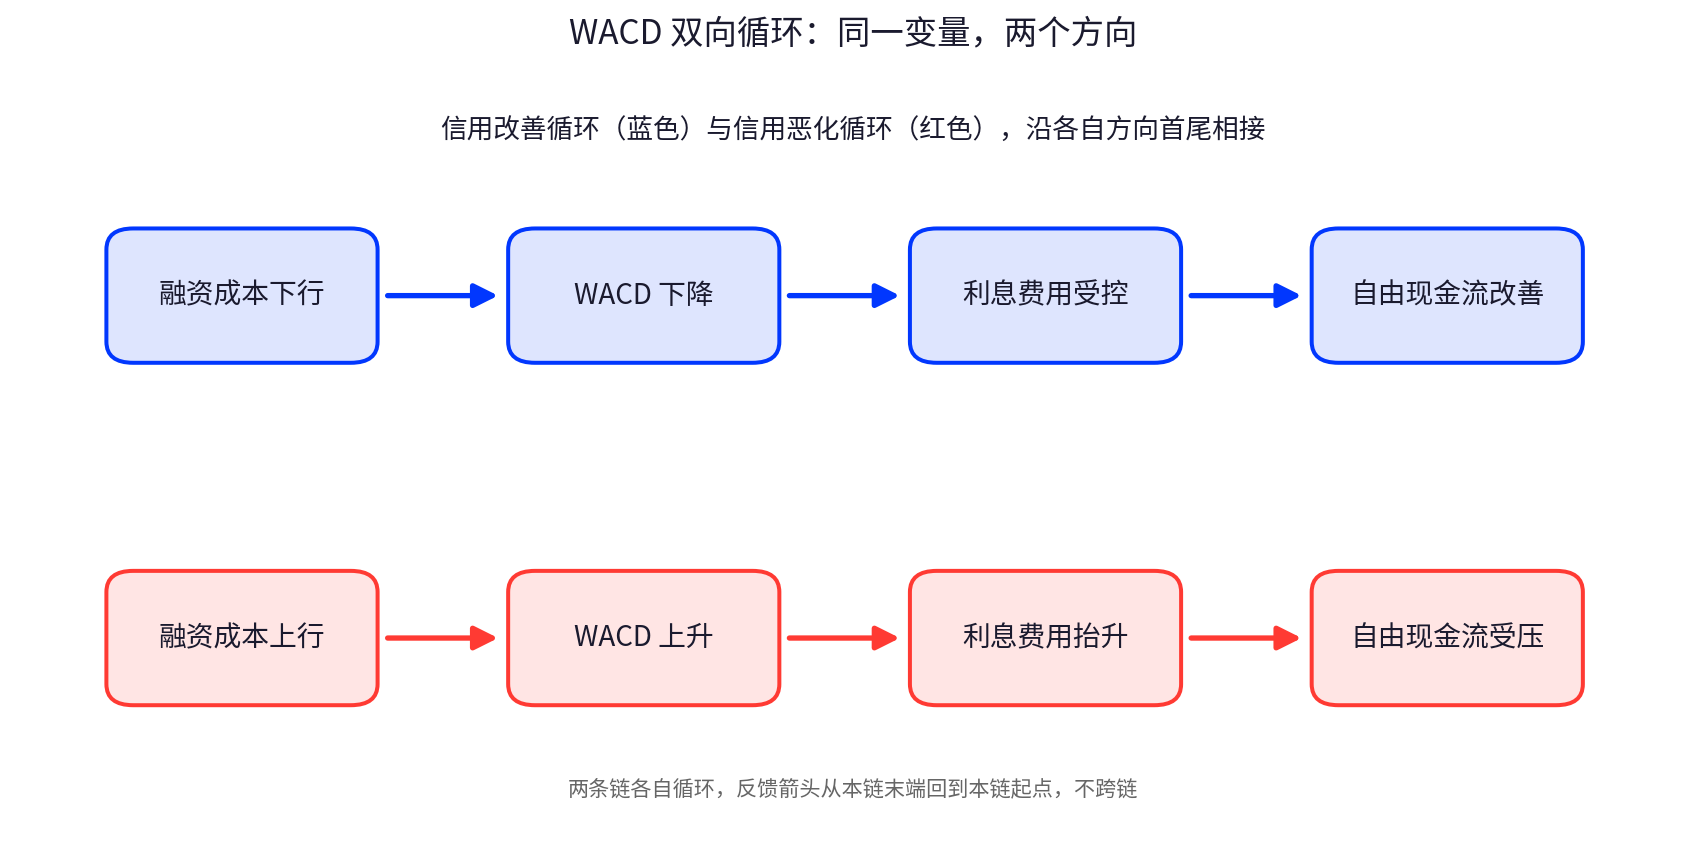
Quantitatively looking at this chain: based on roughly $14.2 billion of floating-rate secured debt, every 100 basis point rise in SOFR adds about $140 million in annual interest, and every 25 basis points about $35 million. If the gap is filled with unsecured debt at 15%, every $140 million gap generates about $20 million in additional annual interest. This calculation