

8万关口暗流涌动:两大催化剂逼近,比特币变盘倒计时

Original author: Frederik Theissen, Glassnode
Original translation: AididiaoJP, Foresight News
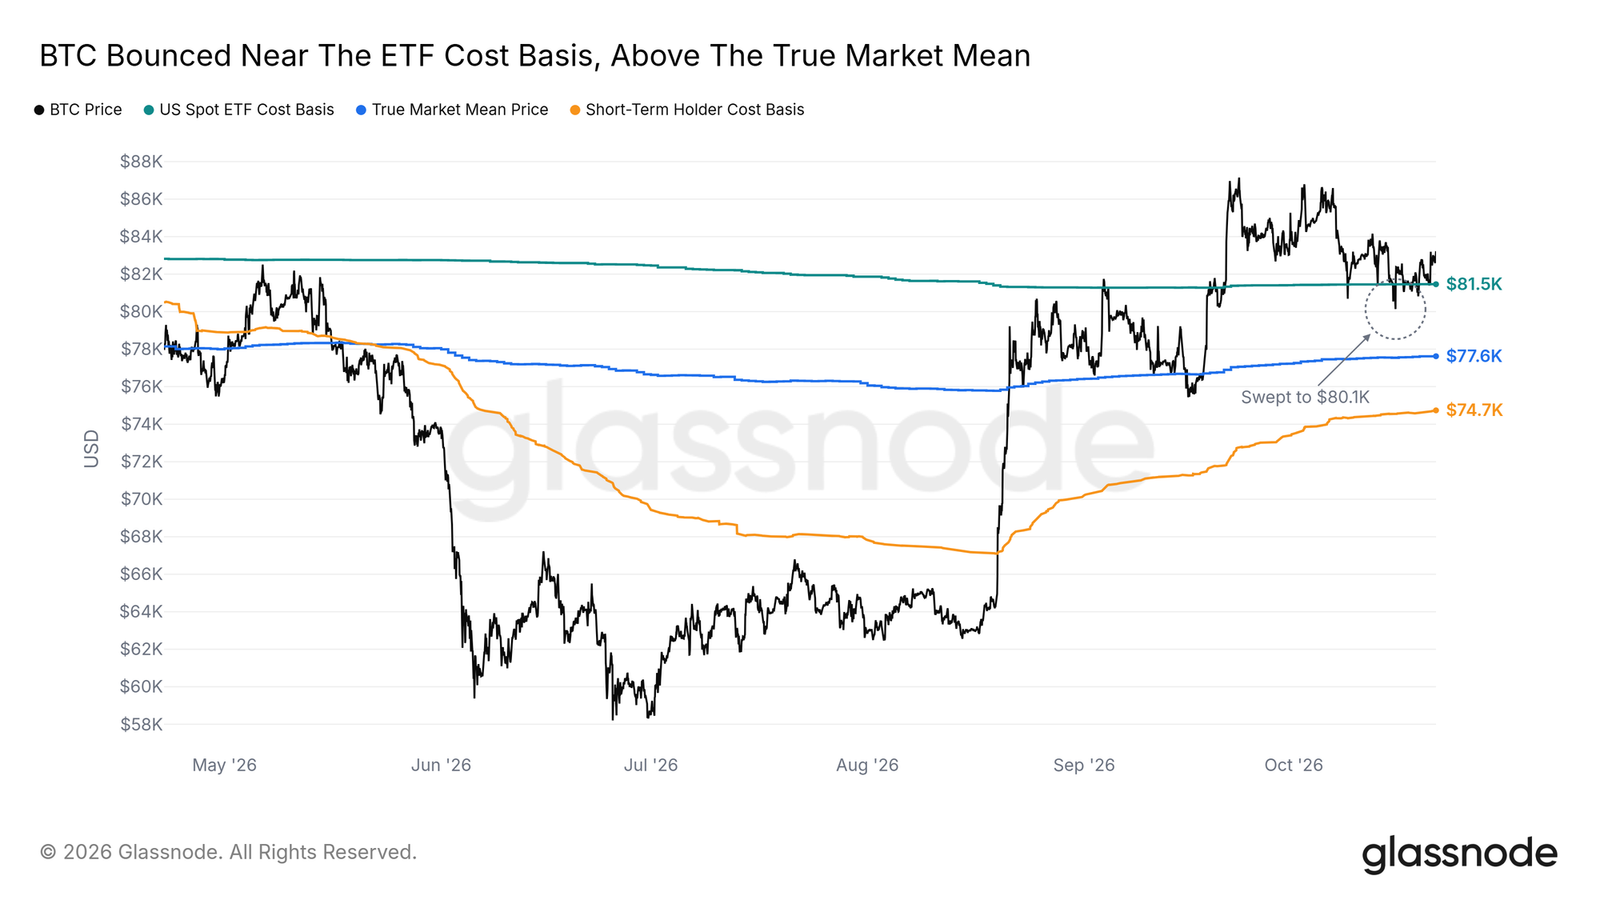
Bitcoin has once again found support near 80K, but this line is hardly a safety cushion. Glassnode's latest report shows that on October 15, the hourly close of Bitcoin briefly dipped to 80.1K, just sweeping through the average holding cost line of US spot ETFs and Bitcoin treasury companies, with buying returning within days. Above the price, 85K to 87.5K holds three layers of resistance: the cost basis of 6-to-12-month buyers, the Binance spot sell wall, and the largest cluster of futures liquidations. The market remains trapped in a range.
80K Is More Than Just a Round Number
What makes this dip significant is that it simultaneously tested two large holder groups. The cost basis of US spot ETFs sits just above 80K, and the average cost of Bitcoin treasury companies tracked by Glassnode is about 80.2K, both falling between 80K and 81.5K. After the hourly close dropped to 80.1K on October 15, it reclaimed the line the very next hour.
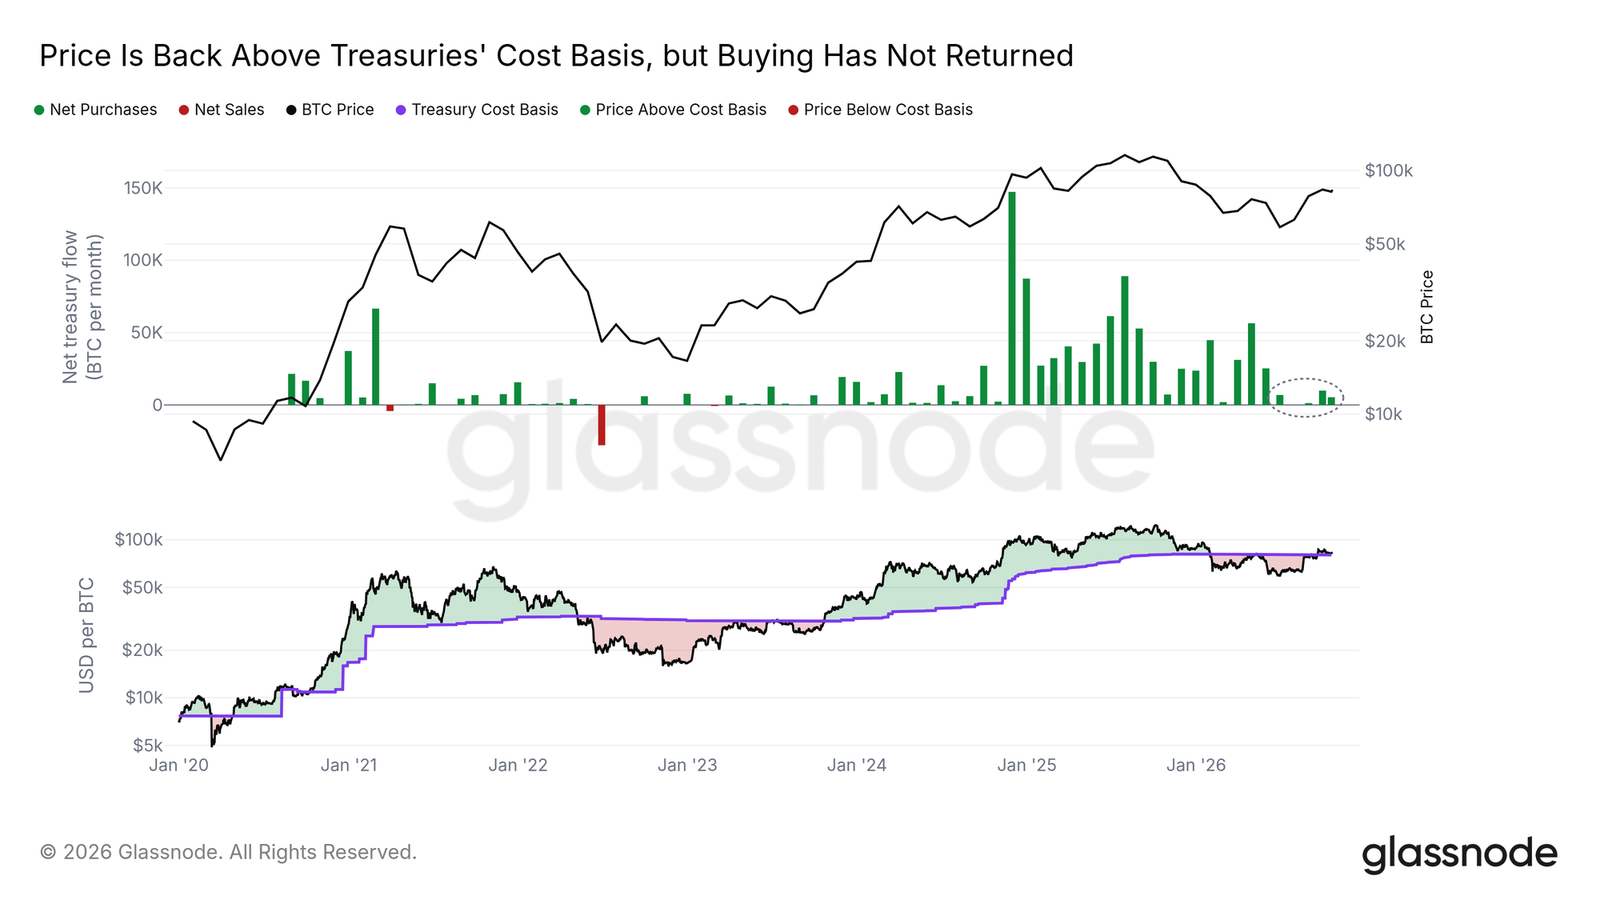
Corporate treasuries have been underwater for most of this year, at one point in late June sitting more than a quarter below their cost basis, but since September 18 they have closed above cost every single day. The problem is that price has returned, but buying has not. Since June, these treasury companies have added less than one-tenth of their November 2024 peak in monthly purchases. If a daily close ever breaks below 80K, ETF and treasury holders would on average return to a loss.
The next support below is the "true market mean," the average cost of active investors, at about 77.6K. The October 15 dip still had some distance from this line.
Three Layers of Resistance Above: 85K to 87.5K
There is buying near 80K, but moving higher is not easy. The largest bid block on the Binance spot order book was originally at 80K, was swept through on October 15 with most of it consumed, and was replenished by October 20. It is smaller than the peak, but it shows buyers are still willing to take delivery at this price.
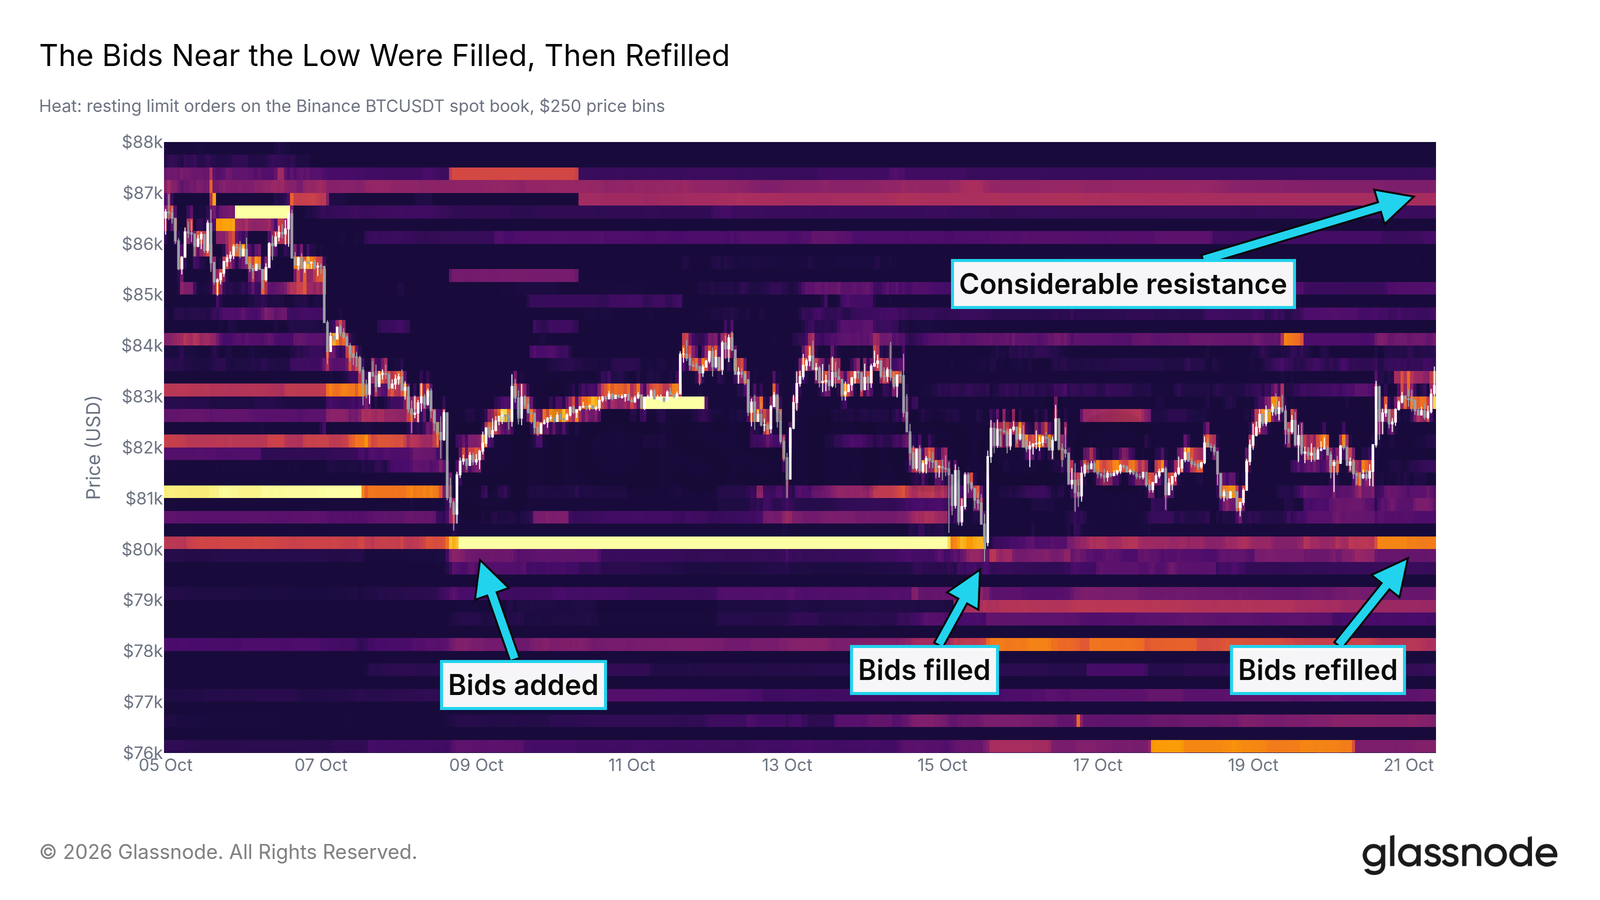
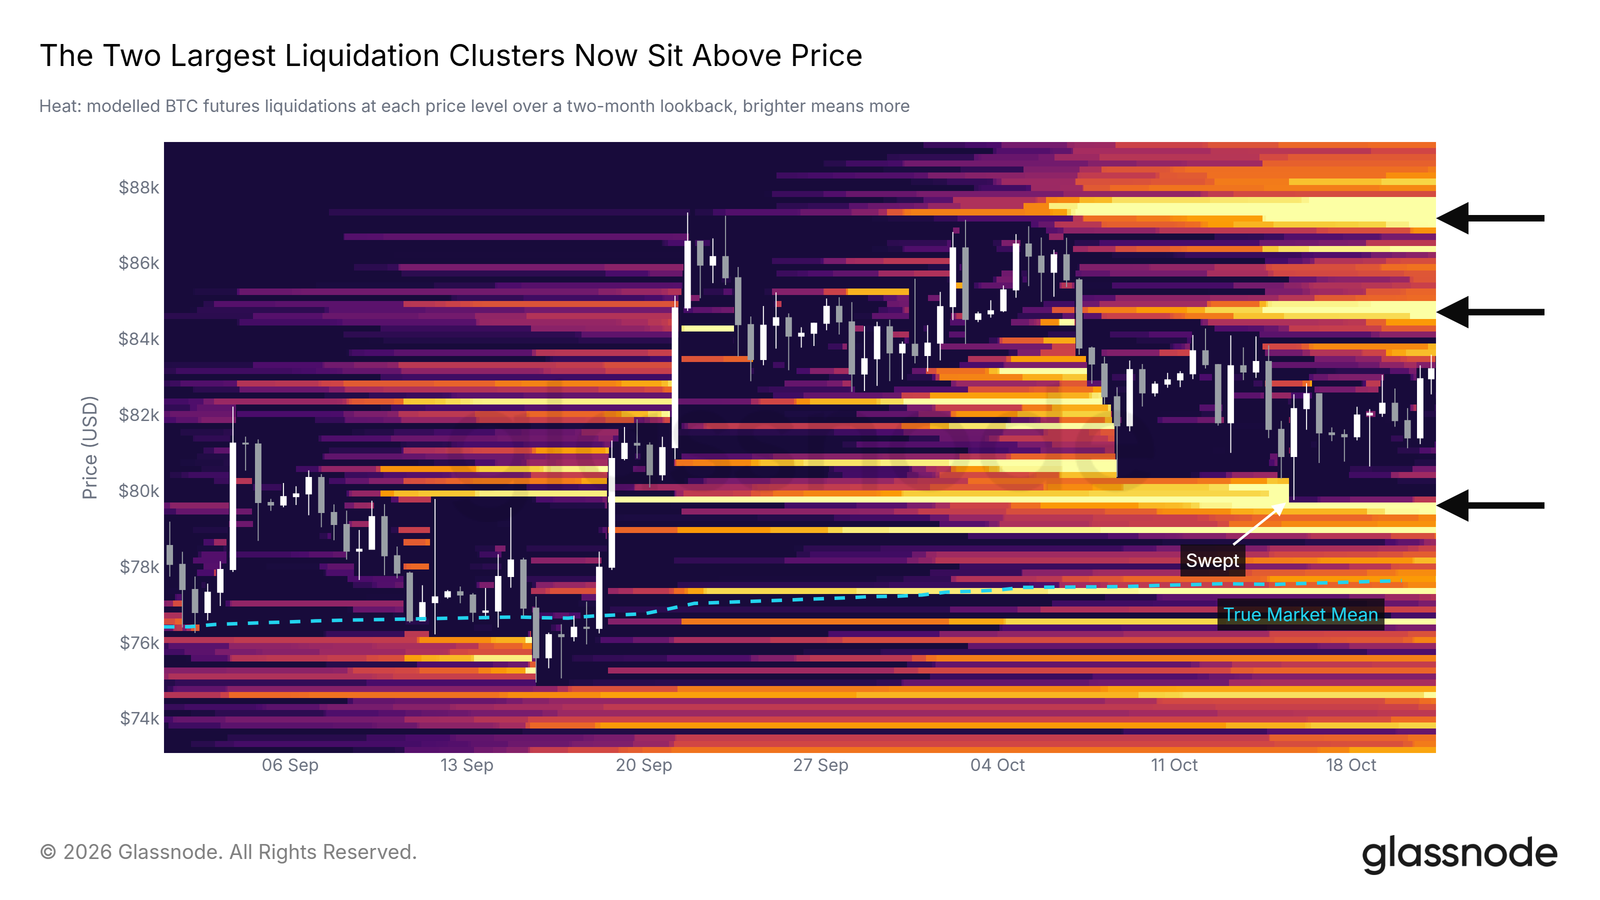
The first major resistance above is at 86.5K to 87.5K, the area with the heaviest concentration of spot sell orders. The liquidation heatmap shows that after the bright band near 80K was swept on October 15, the two largest liquidation clusters moved above the price, near 85K and 87K respectively. If price moves toward 87K, forced short covering could bring acceleration, but the same level would also run into spot sell orders. Below, there is still a bright liquidation line near 79.6K, just below the October 15 low.
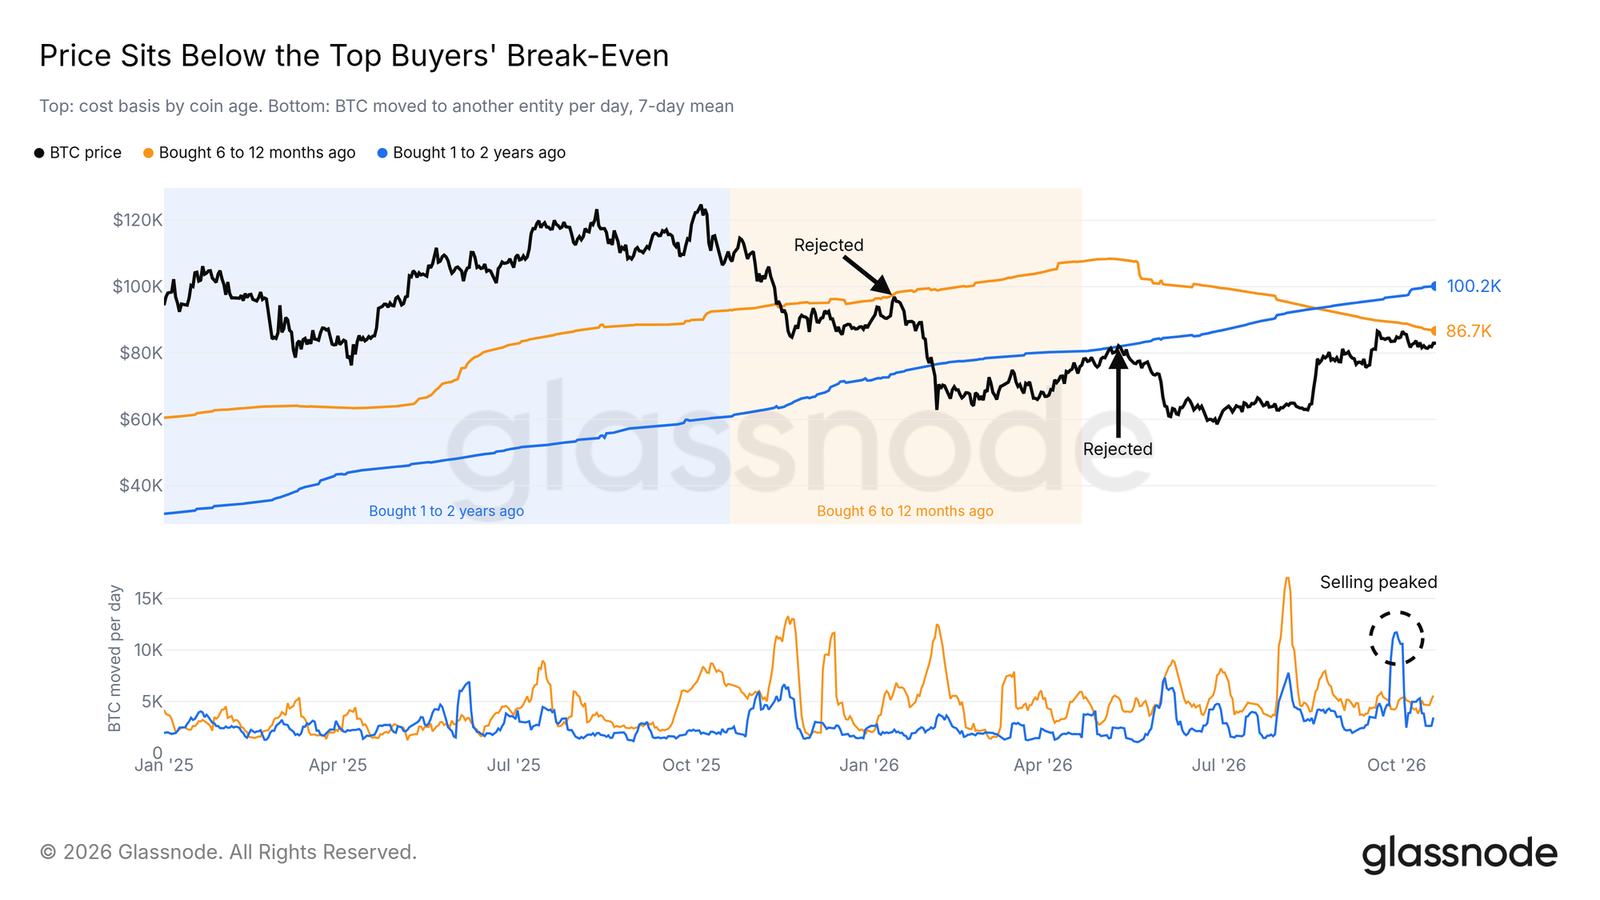
A bigger ceiling comes from buyers over the past two years. Bitcoin bought 6 to 12 months ago now has a cost basis of about 86.7K, down from the 88K mentioned in last week's report; those bought 1 to 2 years ago have a cost basis near 100K. The good news is that selling from this cohort is slowing. Selling by 1-to-2-year holders peaked in early October after the September high, and daily sell volume is now less than one-third of what it was. If the daily close reclaims 86.7K, 6-to-12-month buyers would on average break even and clear the nearest layer of supply.
ETF Inflows Are Back, Volume Is Not
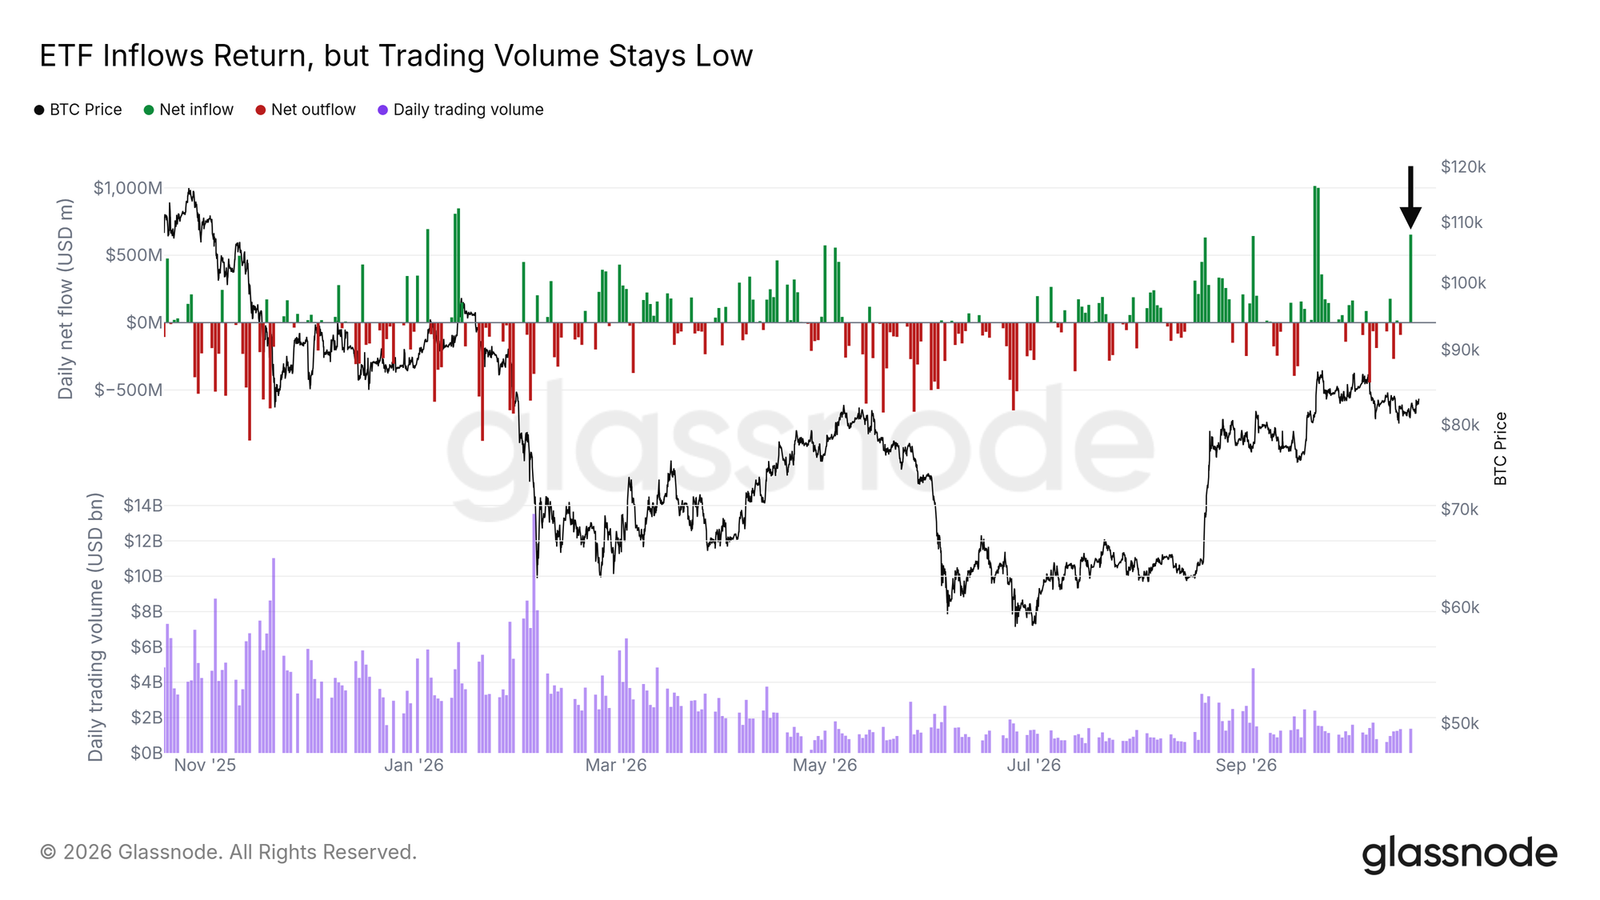
A positive signal has emerged on the funding side. After a week of net outflows, US spot ETFs recorded about $653 million in inflows on Monday, October 19, the largest single day since September 22, pushing weekly flows back into positive territory.
But volume has not followed. ETF trading that day was below a typical trading day over the past year, with the 30-day average volume less than a quarter of its level a year ago. In other words, inflows have returned, but it is not yet clear whether demand is broadening. Only sustained inflows alongside rising volume would show that buying is more than a one-day phenomenon.
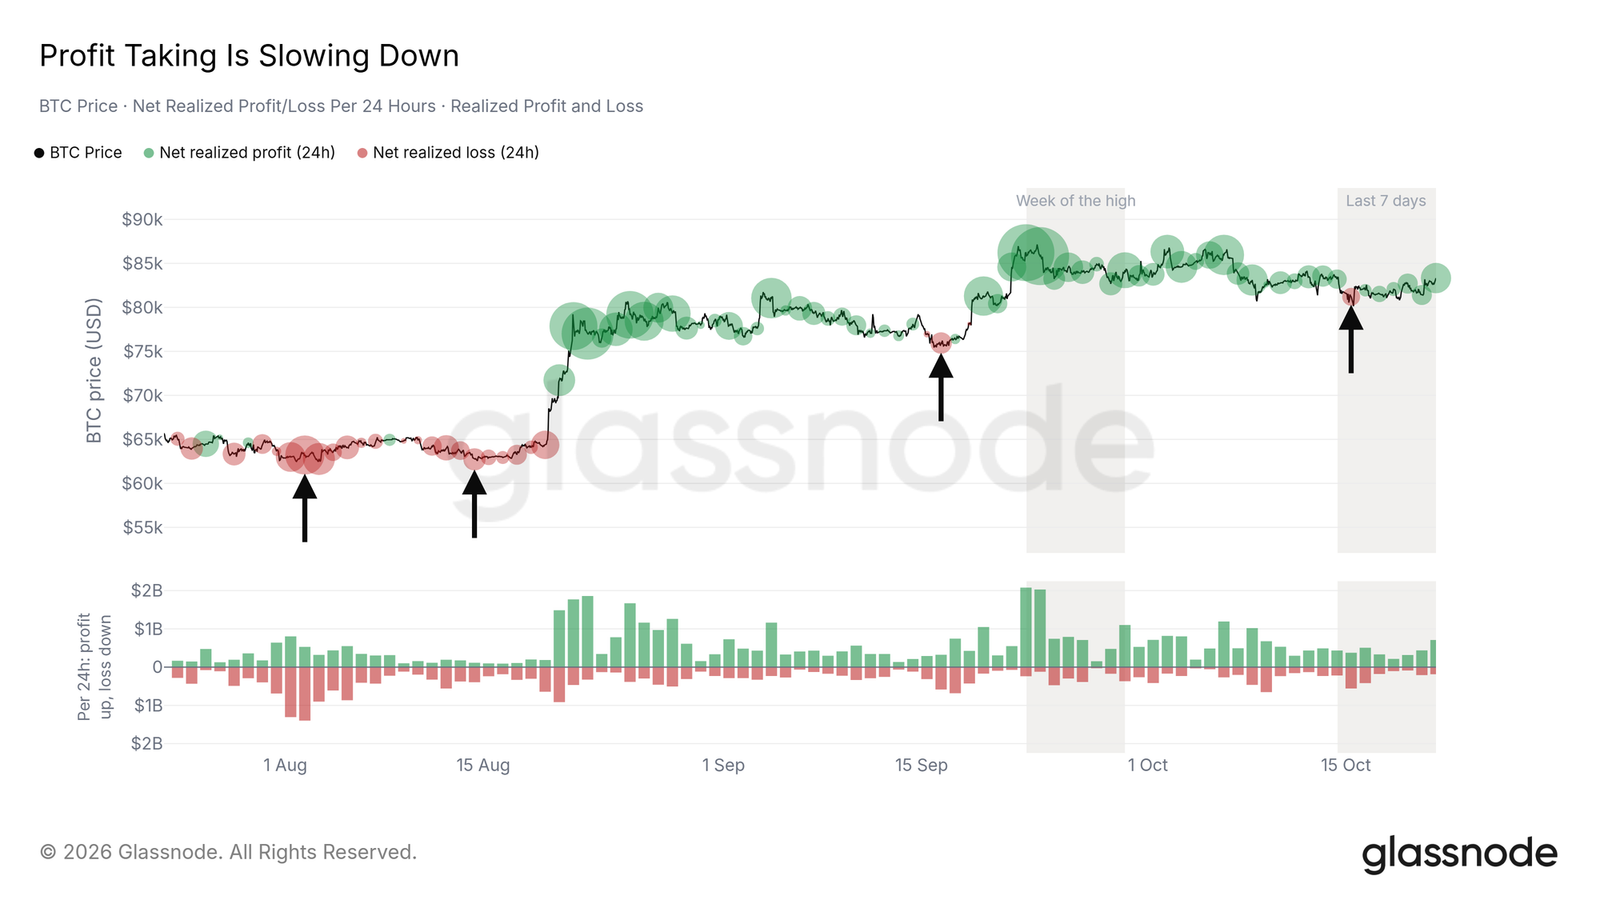
On-chain profit-taking is also cooling. Over the past week, the growth rate of on-chain realized profits fell to about half of the week of the September high; realized losses have remained stable, with the largest occurring in the 24 hours through the morning of October 15, when price was sliding toward 80K. If profit-taking heats up again as price approaches 87K, that would be the first signal of sellers returning to the upper edge of the range.
Two Dates: October 28 and November 11
Two upcoming events could break the range.
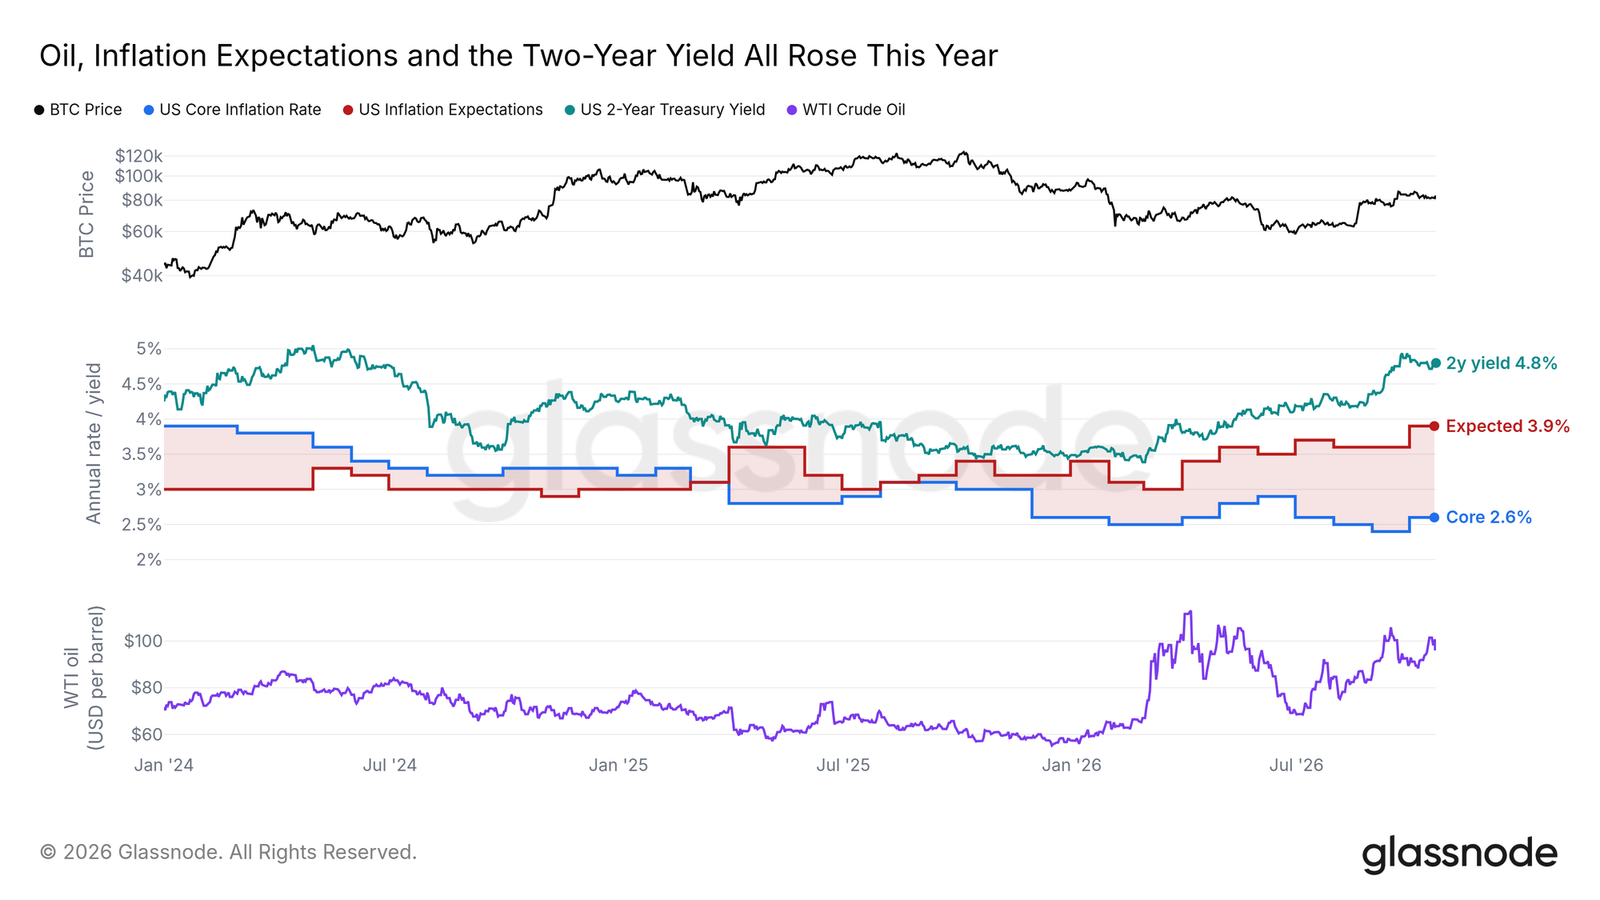
First is the Fed's rate decision on October 28. So far this year, WTI crude has risen about 73%, and household inflation expectations are up 0.5 percentage points. Core inflation is roughly flat versus the start of the year, but September CPI rose more than forecast on both headline and core year-over-year. The two-year Treasury yield has risen more than 1 percentage point this year to 4.8%, clearly above the upper bound of the Fed's 4% target range, even after a hike on September 16. Bitcoin rose about 10% after that hike. If oil prices continue to push inflation expectations higher, a second hike would be hard to rule out.
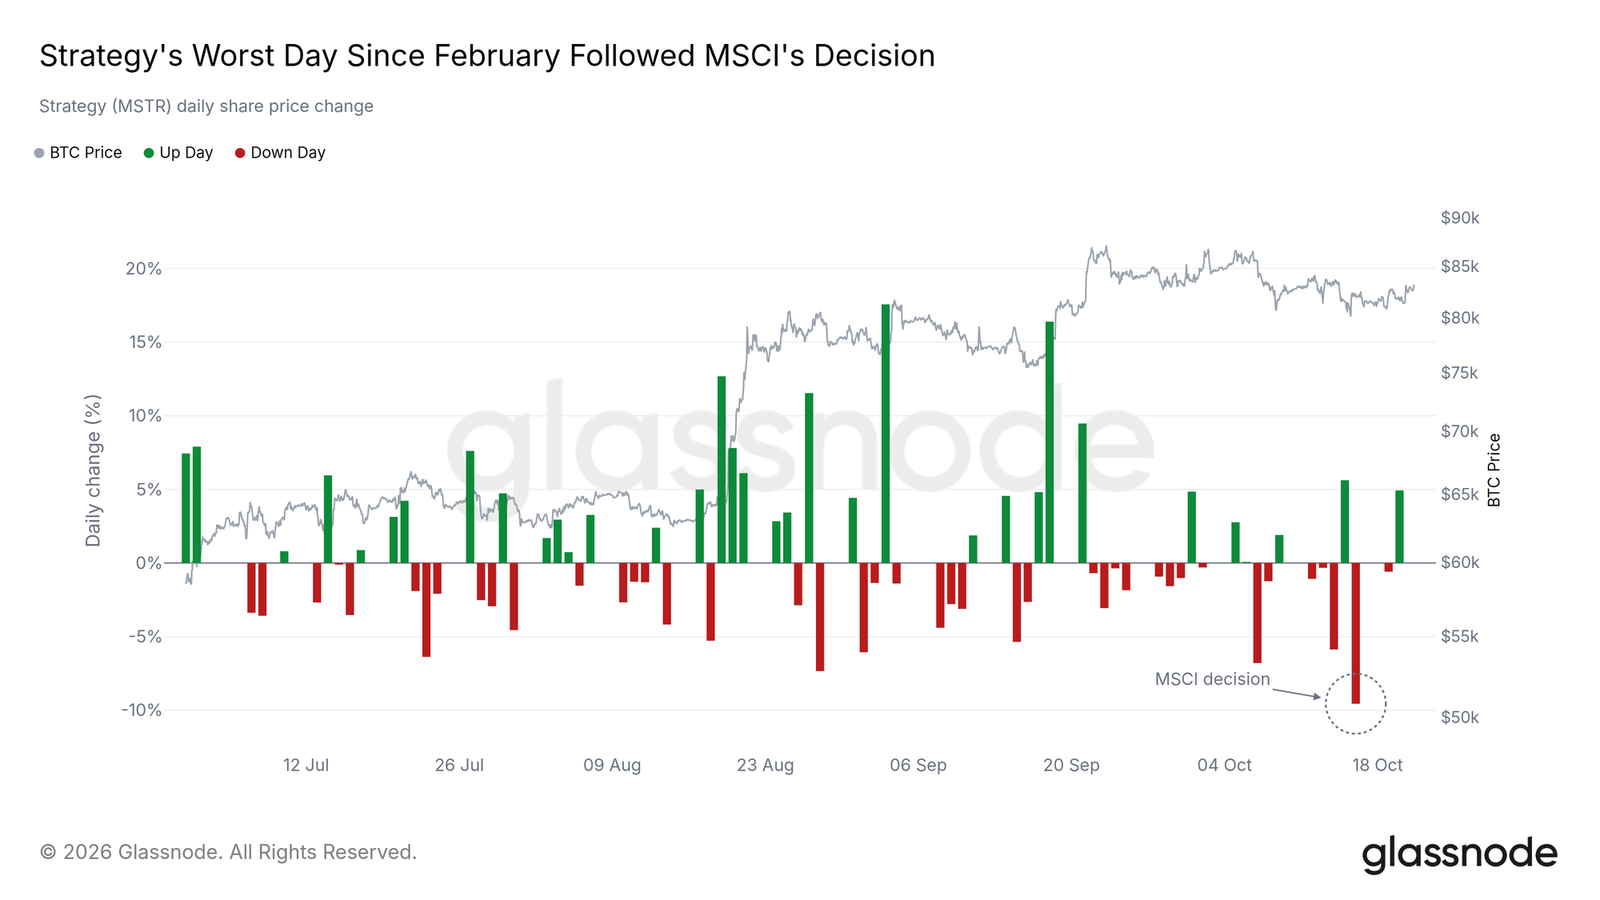
Second is MSCI's index removal announcement on November 11. After the US stock market close on October 15, MSCI passed new rules targeting "non-operating companies." A test using May data during the August consultation had already flagged Strategy and Metaplanet. Companies already in MSCI indexes would only be removed if they fail the test in both of the most recent annual filing periods. The final list will be published on November 11 and take effect at the close on November 30.
Strategy's stock fell nearly 10% on October 16, its worst single day since February, while Bitcoin barely moved that day. If Strategy appears on the list, funds tracking MSCI indexes would be forced to sell its shares. At a time when corporate treasury companies are already sharply reducing Bitcoin purchases, the stock would come under pressure first, and the next question is whether it will keep buying Bitcoin.
Altcoin Leverage Cools, Positioning Barely Trims
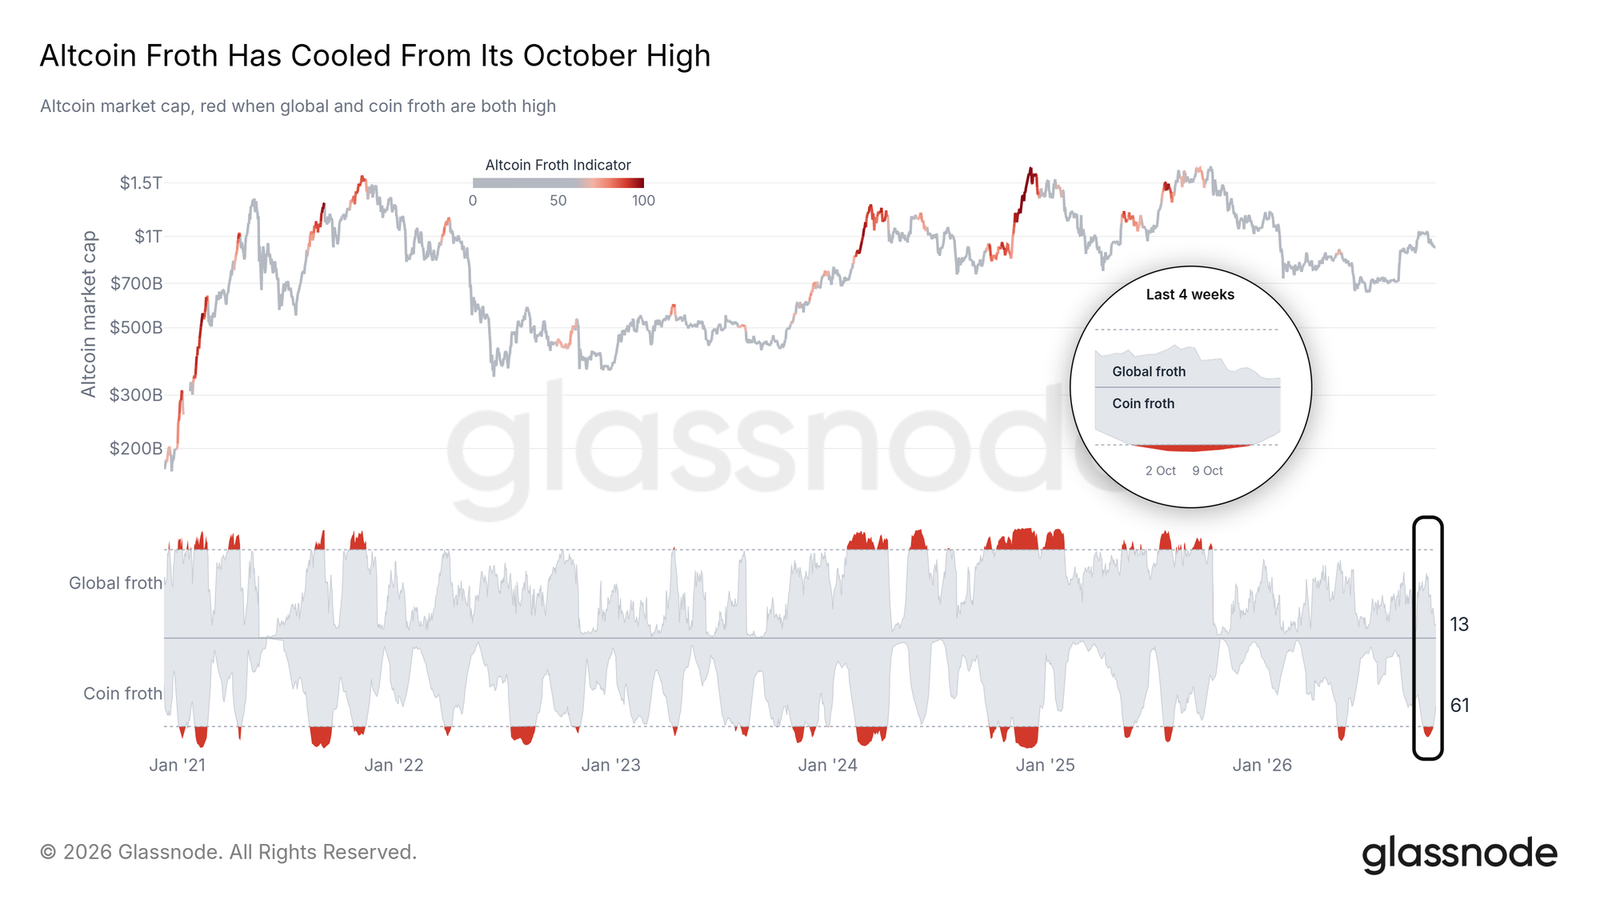
The crowded trade in altcoins is also receding. After Bitcoin slid toward the 80K bid on October 15, altcoins posted a median decline of about 4% over the following weekend, the largest weekend drop since May. The "single-coin bubble" metric, which measures leverage crowding in individual altcoins, peaked on October 7 and then fell out of the high zone; the "global bubble" metric for the entire altcoin market never entered the high zone and has since fallen further.
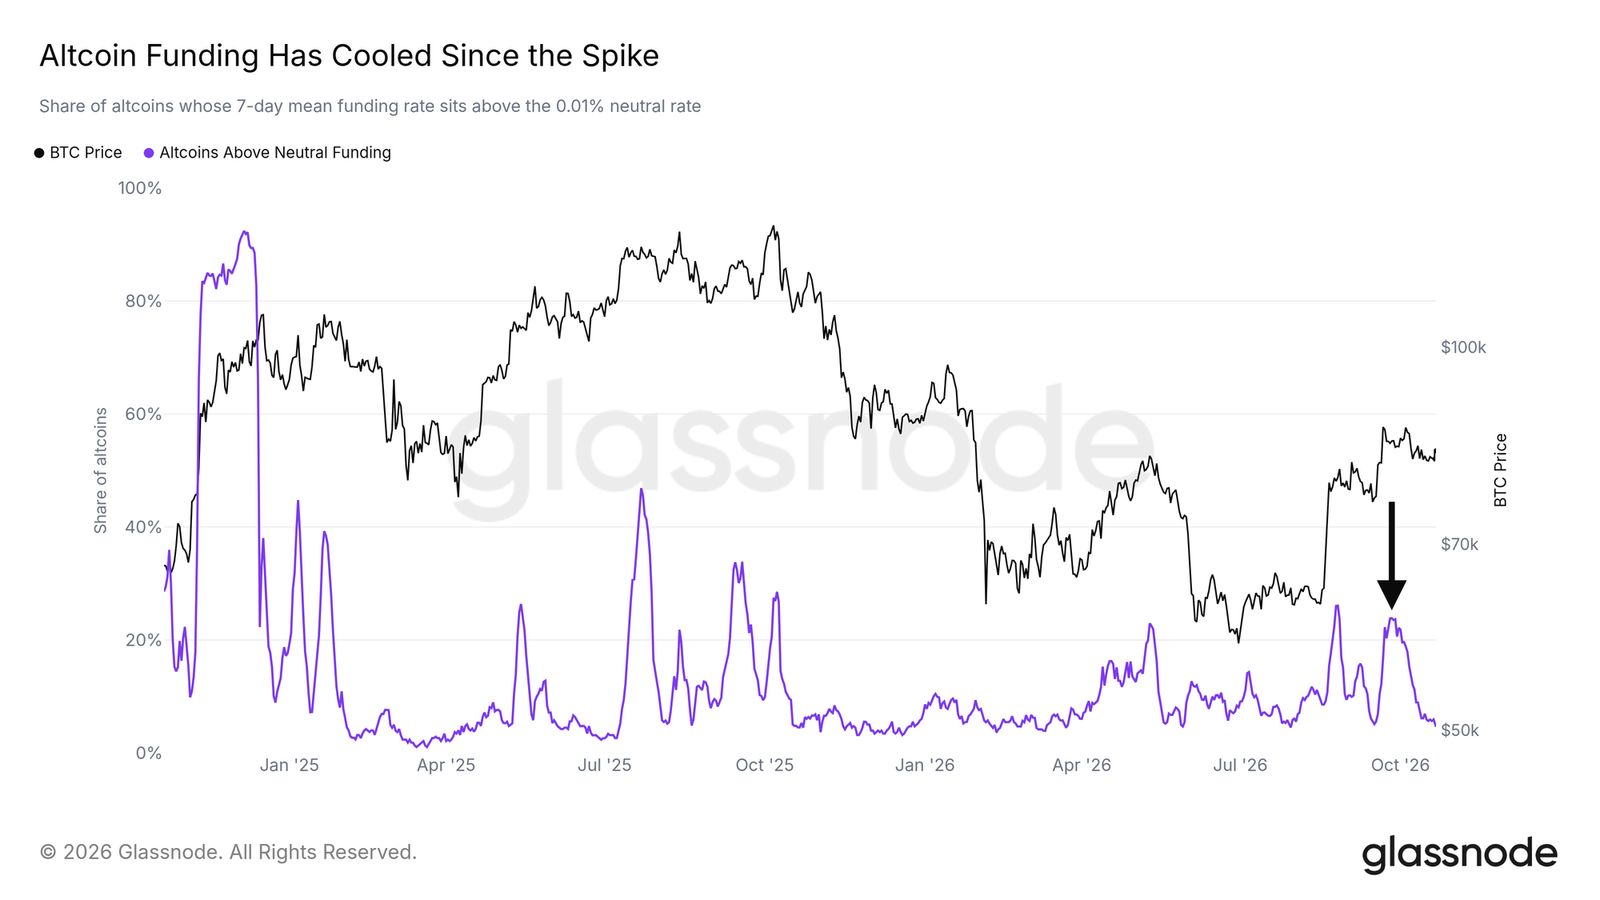
Funding rates have cooled as well. At the end of September, nearly a quarter of altcoins were paying funding rates above neutral levels; now it is under 5%, near the bottom of the two-year range. But note that, after stripping out price moves, open interest is only about 5% below its October peak. Most of the leverage is still on. If funding rates rise again, that would be the first signal of a new round of crowding.
Rotation, Gold Tokens, and Exchange Reserves
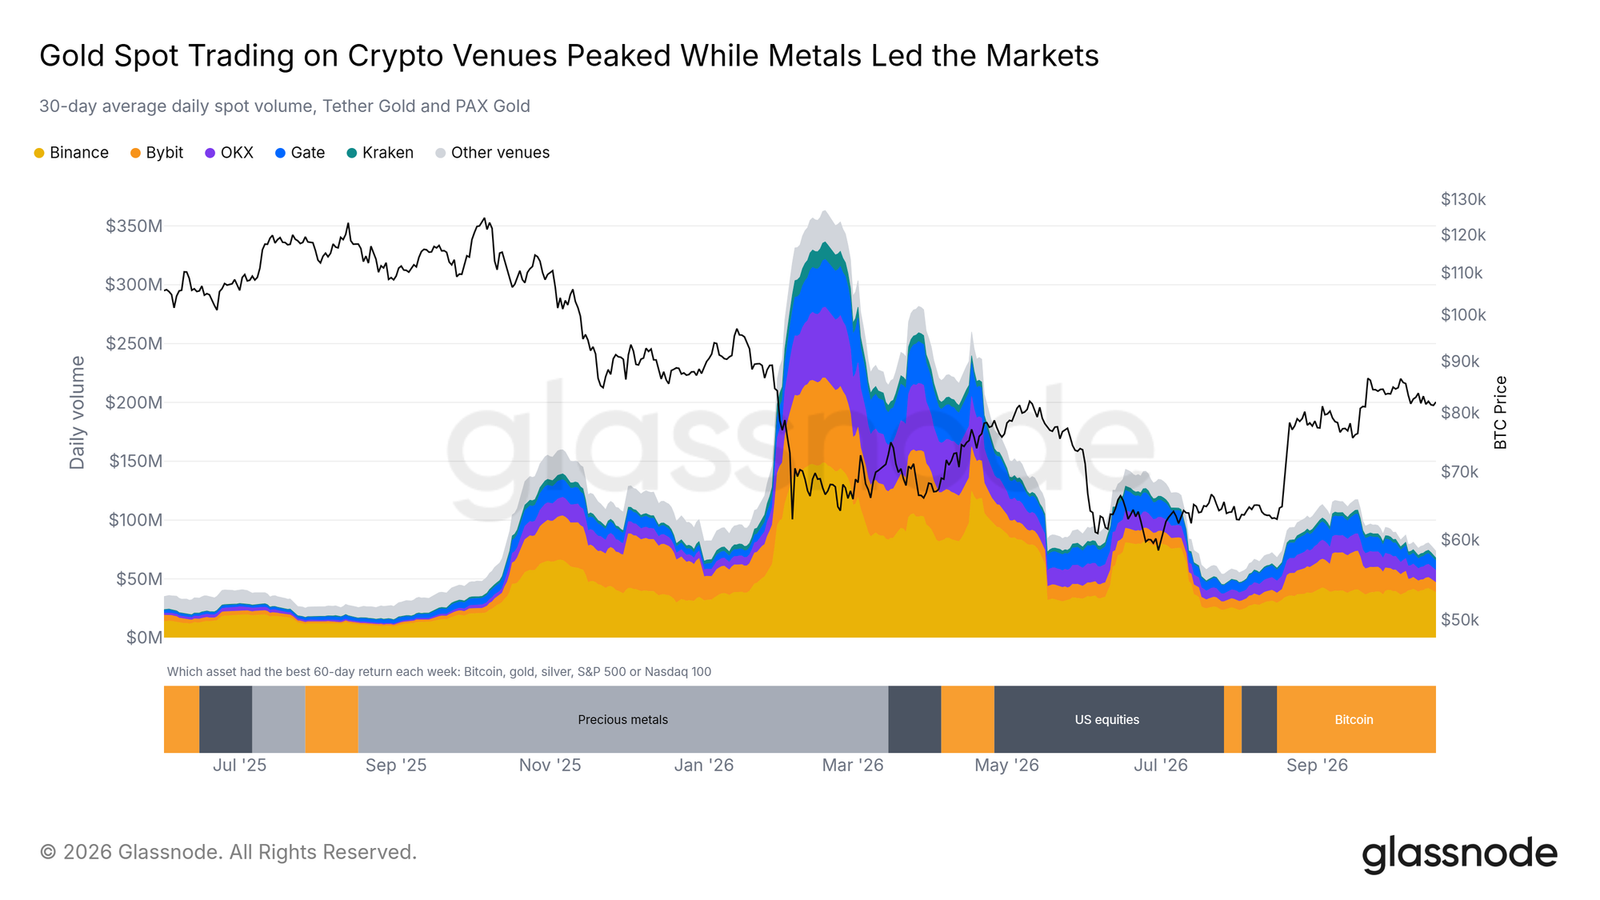
Market leadership this year has rotated from metals to equities to Bitcoin. Measured by two-month returns, gold and silver led in the first quarter, US equities led from spring through July, and Bitcoin has led over the past 10 weeks.
Tokenized gold trading on crypto exchanges has tracked the metals moves. Tokenized gold spot volume peaked in mid-February when precious metals led, fell to 15% of peak by late July, more than doubled in mid-September when Bitcoin led, and has since fallen back to 20% of the February peak. Binance still holds the largest share, while OKX and Gate have gained the most this year, with Gate rising from 0.6% in 2024 to 12% year-to-date in 2026.
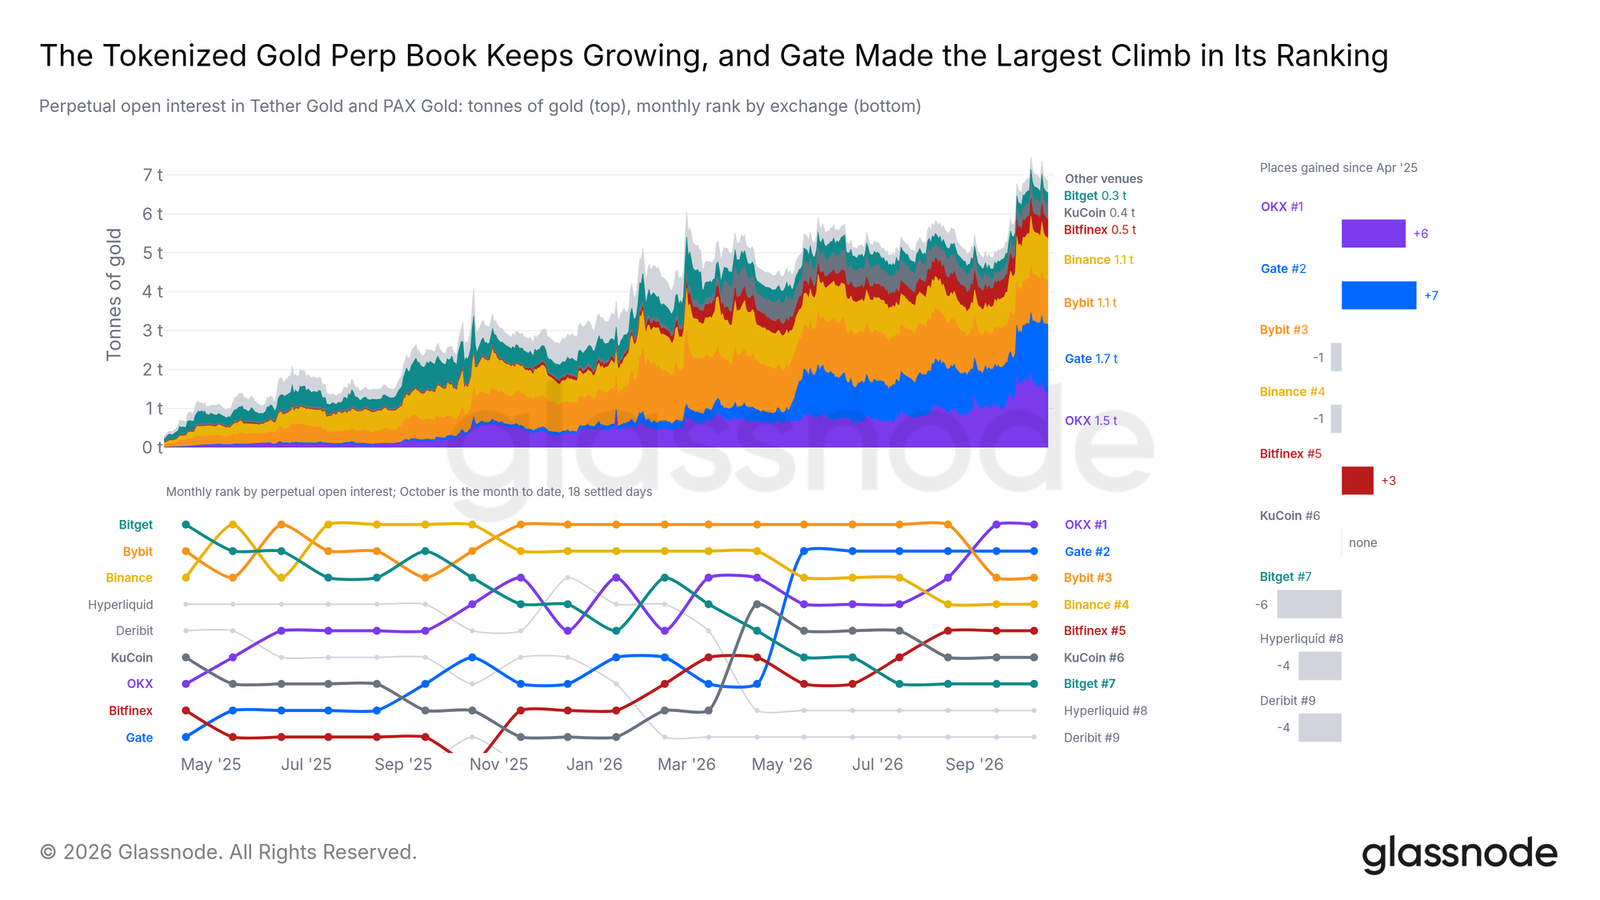
After volumes cooled, gold positioning has not been clearly withdrawn. Tokenized gold perpetual futures open interest now equals 7.0 tonnes of gold, 62% more than at the February spot volume peak. In mid-September, when spot trading slowed, this figure kept growing from 5.0 tonnes, suggesting traders are holding gold exposure for longer. This year, Gate accounted for 42% of net position growth since January 1, with its open interest ranking rising from 9th to 2nd; OKX climbed 6 places. Averaged over the past week, Gate ranked first among exchanges tracked by Glassnode at 1.7 tonnes, with OKX at 1.5 tonnes. If metals stop leading and positioning can still hold above 6 tonnes, that would show traders are continuing to hold gold without the support of a metals rally.
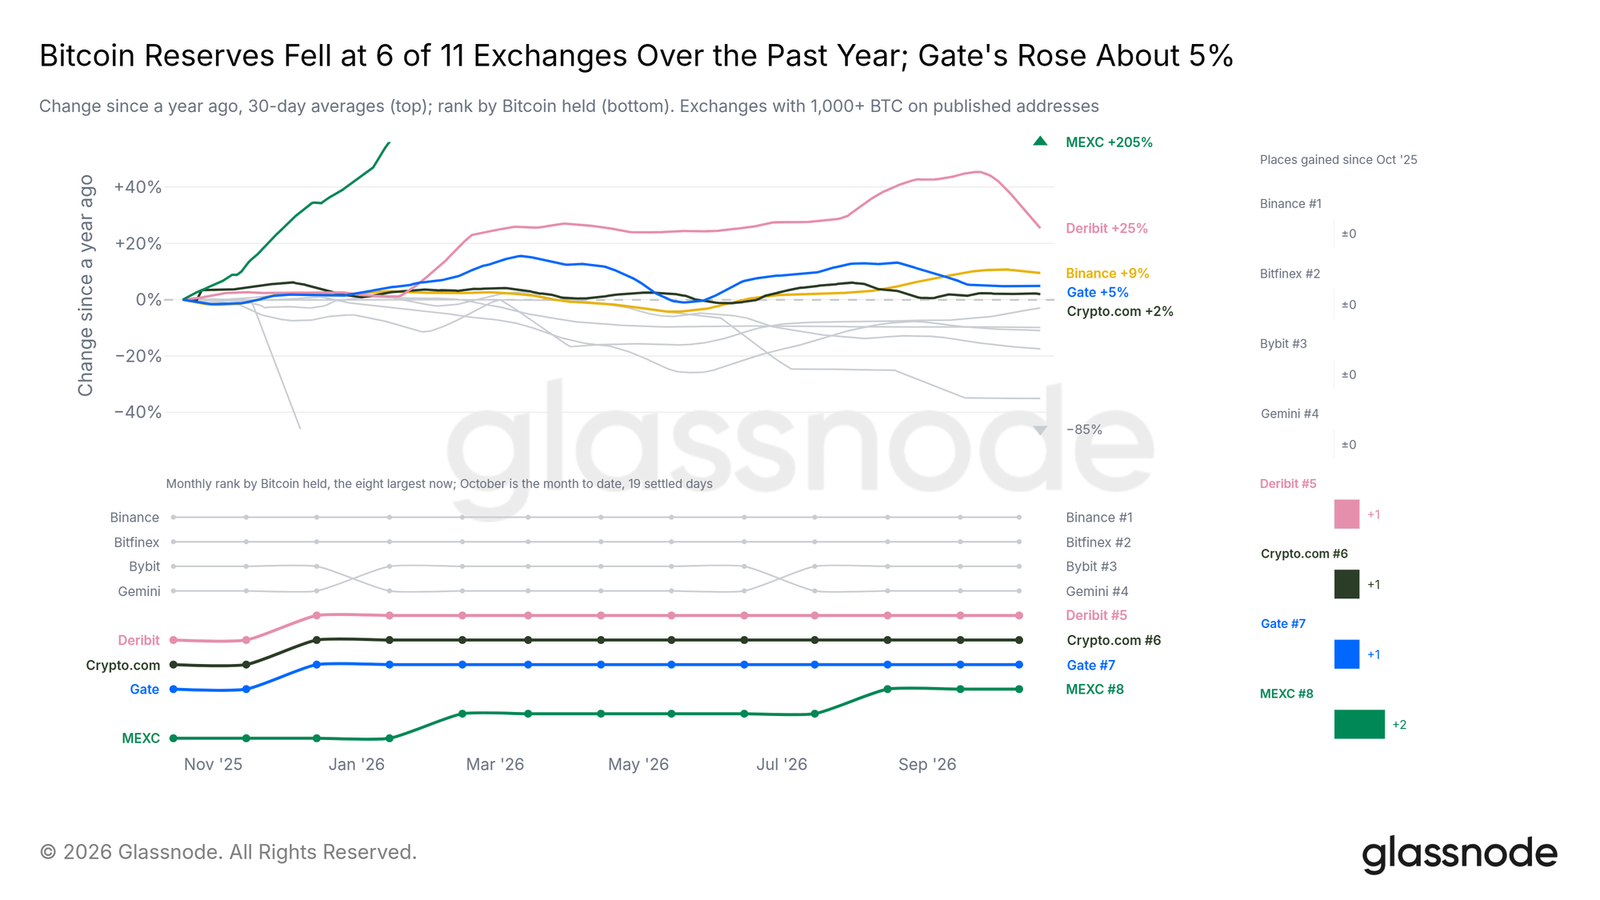
Bitcoin reserves on exchanges are thinning overall. Glassnode's proof-of-reserves metric tracks exchange public addresses, and of 11 exchanges holding at least 1,000 BTC, 6 hold less than a year ago. Gate's reserves grew 4.9%, while the median of the other 10 fell 6.4%. The breadth of declines widened in spring: at the end of last November, only 4 had less than in October the prior year, rising to 8 by the end of May, and now 6. Growth at the largest exchange has kept the total from sliding, but the other 10 combined are down about 10%. Gate released its latest proof of reserves this week, showing that as of October 18 its reserves exceeded user deposits by about $1.4 billion, with coverage ratios above 100% for Bitcoin, Ethereum, stablecoins, and other major assets.
Conclusion: Range Unbroken, Direction Hinges on Two Closes
Bitcoin remains trapped in a range. The October 15 dip found buyers at the 80K to 81.5K ETF and treasury cost lines, and profit-taking subsequently slowed; above, 85K to 87.5K concentrates the 6-to-12-month cost basis, spot sell orders, and the largest liquidation cluster.
Only a daily close above 87.5K, accompanied by sustained ETF inflows and rising volume, would show that demand is beginning to absorb this layer of supply. If the daily close breaks below 80K, ETF and treasury holders would on average return to a loss, bringing the true market mean near 77.6K into view. In between lie the Fed's October 28 decision and MSCI's November 11 list.