


Key Takeawaay
first level title
The value of GameFi Token is determined in part by the daily active user growth (DAU) and the burning/minting ratio (Burn/Minting Ratio).
Practicality is related to the burn/cast ratio.
According to the market value ranking of NFTGo.io subdivided tracks, GameFi ranks fourth in the NFT industry, with a total transaction volume of 3.29 billion US dollars.
Investors hold P2E NFTs in the medium to long term.
· Currently, most P2E is on Ethereum (ETH) or Solana (SOL). Unlike traditional games, the owners of P2E in-game assets are players, not companies. This is one of the reasons why GameFi may disrupt the gaming experience.In traditional games such as Counter-Strike, Fortnite, GTA, FIFA, and LOL, players must rely on game studios to obtain equipment and purchase skins.
first level title
Token economy
Token economy
Most GameFi platforms have two or more Tokens. The first type of token is governance token. The second type of Token is like a FIAT scheme, which is used to upgrade game characters. We can think about the P2E game Token economic model from the following dimensions:
secondary title
1. Market Cap Supply
Market capitalization is a key indicator of the total value of Token, measured in USD. The market value is calculated based on the size of the capital pool that has been invested in the project. The calculation method is the product of the circulating supply and the current price of the Token. Focusing on the market value can better understand the future value of the Token.
A high token price does not necessarily mean that its market value is higher than other tokens.
For example, the price of Token A is $1, and the circulating supply is 100; the price of Token B is $2, and the circulating supply is 25. People may generally think that Token A is worth less. Lets calculate the market capitalization of both:
Market cap = Token price x Token circulating supply
Market value of A=$1 x100=$100
Market value of B = $2 x25 = $50
The truth is that since A has a higher market cap than B, A is more valuable. Therefore, the market capitalization indicator can help you know the growth potential of a digital asset. The most common way to divide the Token market value is as follows (*B: Billion):
Large market capitalization: +10B
Medium market capitalization: 1B-10B
Also note that, as has been the case in recent days, most digital assets experience large fluctuations in market capitalization. In addition, it is recommended that you keep an eye on the supply of Tokens that are in circulation. Some Token wallets may be locked or burned, and will only be held in smart contracts/wallets and will not be circulated in the market.
2. Token
secondary title
Digital assets have two economic models: inflationary and deflationary.Inflation Token refers to the circulationnet increaseToken, and the tightening Token is the circulationnet reduction
Token.(Fiat-to-NFT)Inflation Token: As mentioned above, GameFi has a Token that can be regarded as a FIAT scheme
Tightening Tokens: Tightening Tokens are the opposite of inflationary Tokens. The biggest difference between the two is that Tightening Tokens have a maximum supply limit when they are launched, and not all of them will be released to the market on the day of launch; Decreases over time. The operation of the burning mechanism usually relies on the burning wallet-taking out a fixed proportion of Tokens from the market at a specific time.
secondary title
3. Allocation
Each project has its own distribution model, and there is no one-size-fits-all solution. In most cases, the distribution ratio of the core team (founders) is 5%-20%, and private investors account for 3%-32%. The number fluctuates depending on how much funds the team hopes to raise for project development. Often only 10%-20% of the funds are allocated to the circulating supply in the beginning, and eventually, all the supply will be released. In addition to the above ratio, the remaining part will flow to two places, one wallet is used to lock funds, and the other is used for marketing, promotion and other purposes.
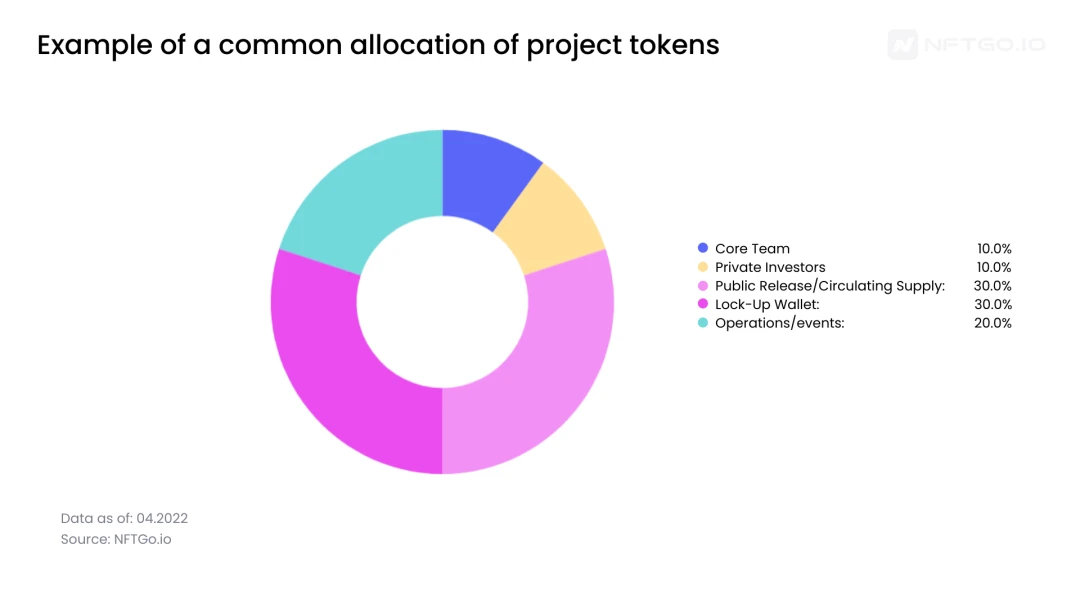
Common project Token distribution scheme; data source: NFTGo.io
secondary title
4. Utility and growth
The value of Token also depends on the utility and growth of daily active users (DAU), and DAU is correlated with the price of Token. If a Token has a wide range of users, the daily Token minting/burning ratio will also be high, but if the utility is not enough, the Token price will eventually drop, because the minting and burning ratio will bring higher inflationary pressure on the Token.
Breeding
parts upgrade
pledge
pledge
liquidity pool
The figure below takes some GameFi Tokens in the current market as examples to show the relationship between DAU (number of daily active users), Token price and Utility.
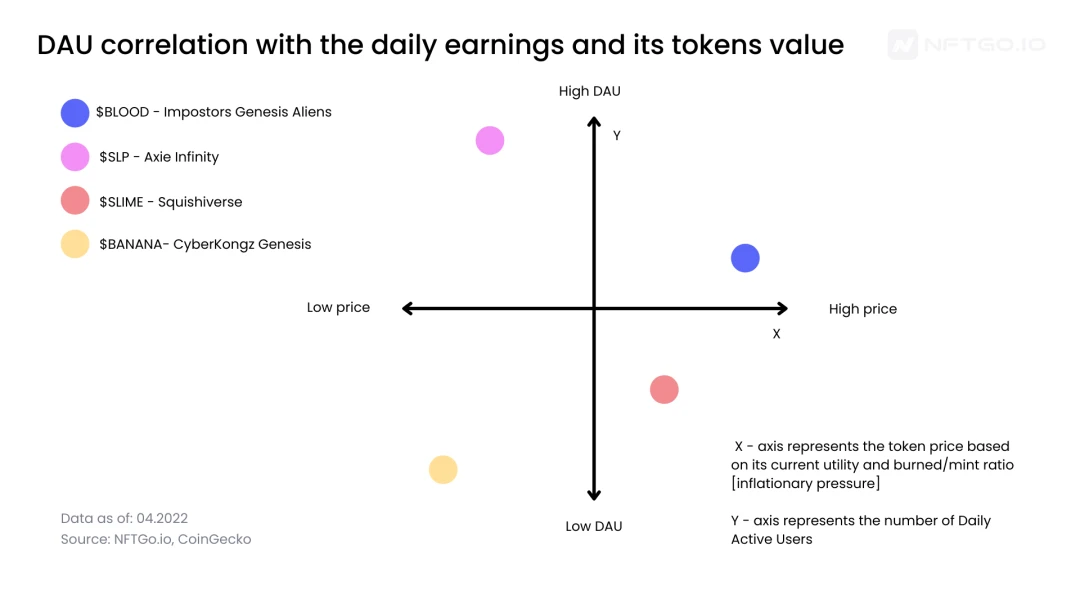
image description
Correlation between DAU, revenue and Token value; data source: NFTGo.io, CoinGecko
If there is inflationary pressure caused by the burn/mint ratio, there will be a situation where DAU is high and token price is low. If the burning/casting ratio is too high, Token will depreciate due to lack of practicality (burning mechanism). Some collectibles like to have a low price, high DAU, and high burn/mint ratio for a short period of time, as this allows them to have more circulating supply, but after a while, the circulating supply (such as skins, levels, lands, NFT features, etc.) ) will decline with the creation of new combustion mechanisms, and eventually, the price will stabilize.
Low daily income and DAU are not the worst situation, because at this time, the NFT project will usually be relatively cheap.
In order to better evaluate Token performance, you need to consider the following external factors:
Macroeconomic trends: digital asset market, stock market, overall sentiment of the NFT market, current game development trends, etc.
current floor price
return on investment (ROI)
policy
policy
first level title
The game industry attracts people to join Web3 by virtue of its fun and practicality. The total value of P2E games is approximately US$1.69 billion, ranking fourth in the market value of the NFT industry.
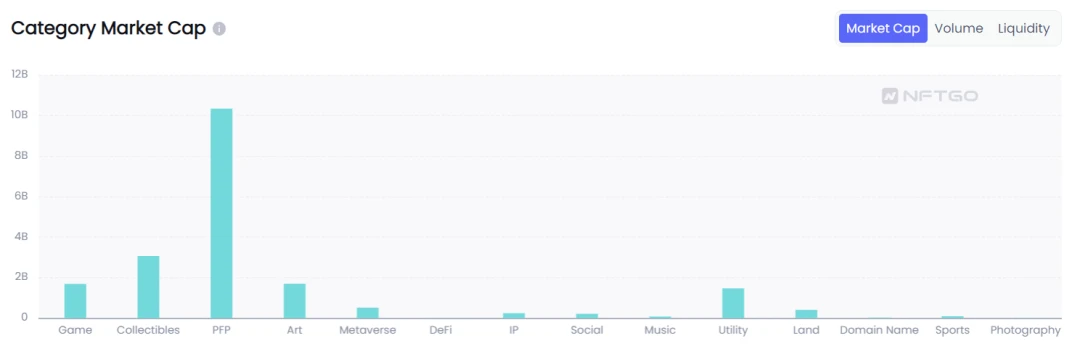
image description
GameFi will show explosive growth in 2021, and the popularity of P2E has also risen recently. The total transaction volume of NFT Game is as high as 3.29 billion US dollars, ranking third.
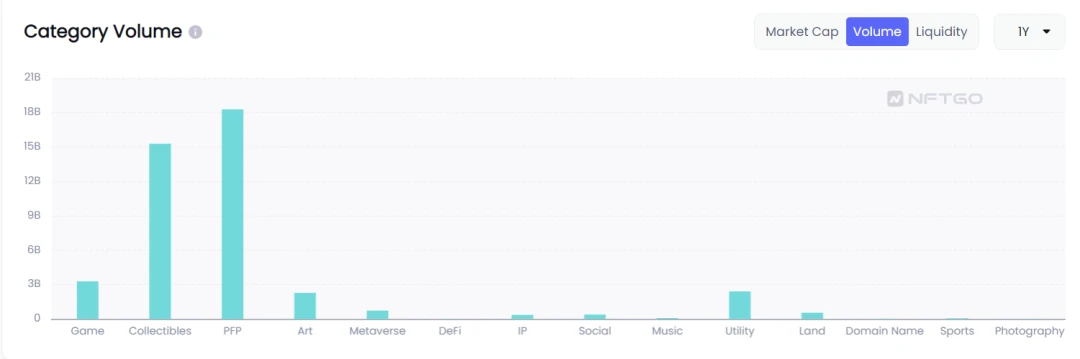
The total amount of each industry on the chain; data source: NFTGo.io
secondary title
In order to obtain the development trend of the holding time of the P2E industry, we analyzed 18 P2E collectibles on Ethereum and obtained the holding pattern. The image below shows the 18 collectibles and their holding periods.
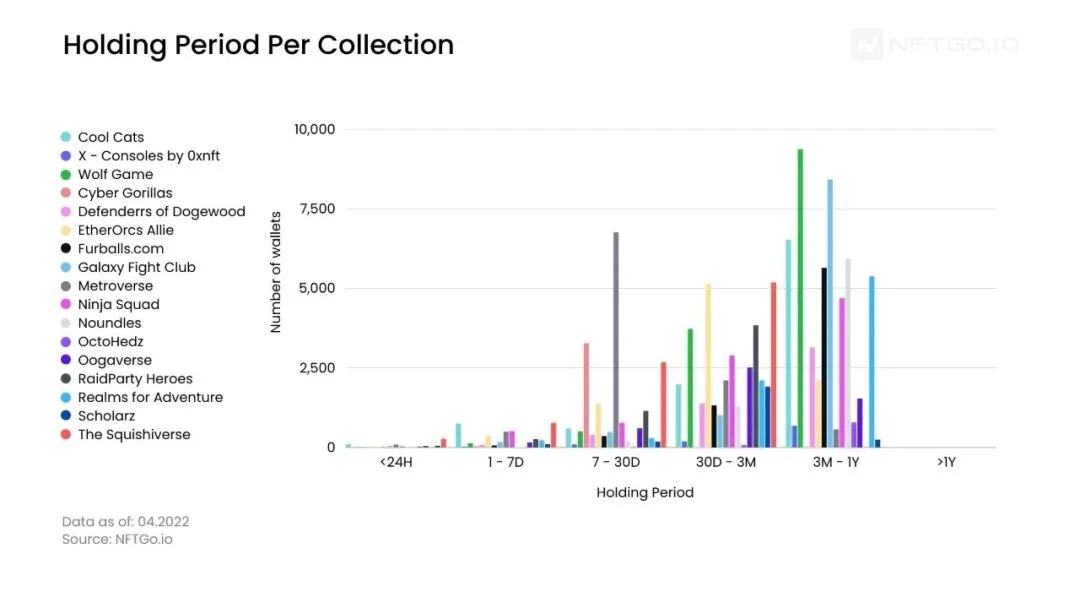
image description
As shown in the figure, the holding period mode with the largest proportion is 3 months to 1 year. Because passive income and assets may appreciate in the future, P2E NFT holders tend to make medium and long-term investments.
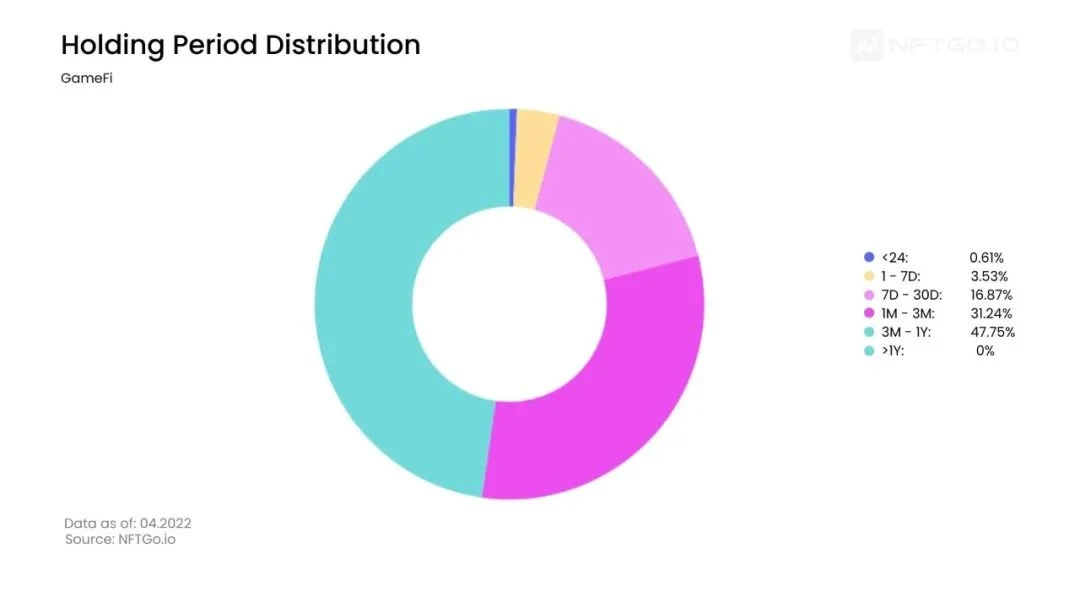
image description
GameFi’s holding period; data source: NFTGo.io
We compared the holding period distributions of GameFi and BAYC and found something in common:
Less than 4% sold their NFT within 1-7 days
The vast majority of investors hope to hold assets for more than 3 months
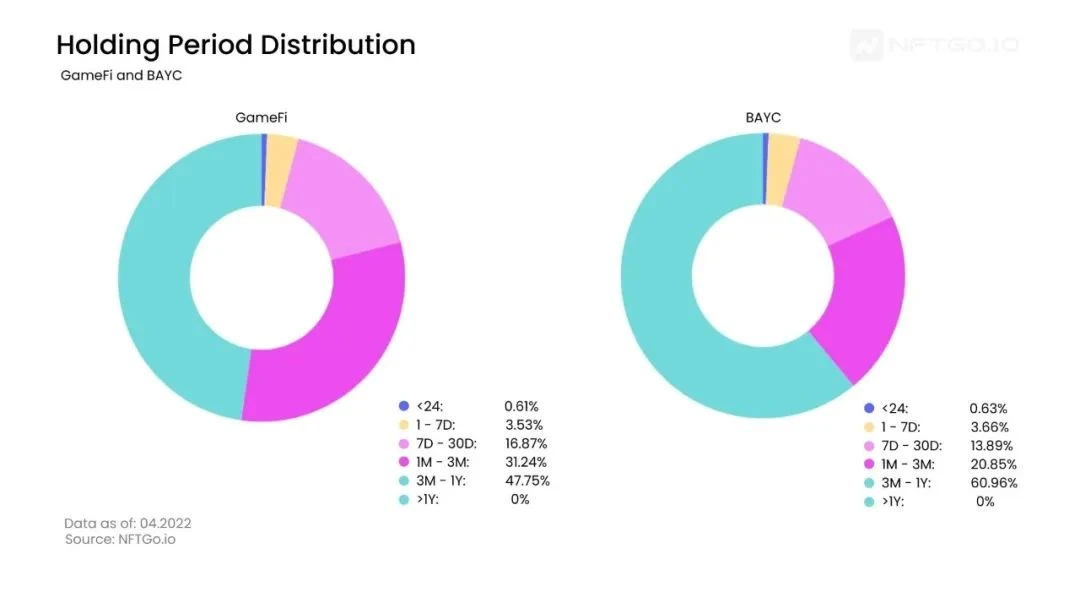
Holding period of GameFi and BAYC; data source: NFTGo.io
GameFi ROI
secondary title
If you want to calculate the return on investment (ROI) of P2E, you can consider the following factors:
Gas fees for buying NFTs from the marketplace
The higher the DLV, the greater the asset volatility
fluidity
fluidity
The following figure is a P2E with a higher ROI in Ethereum:
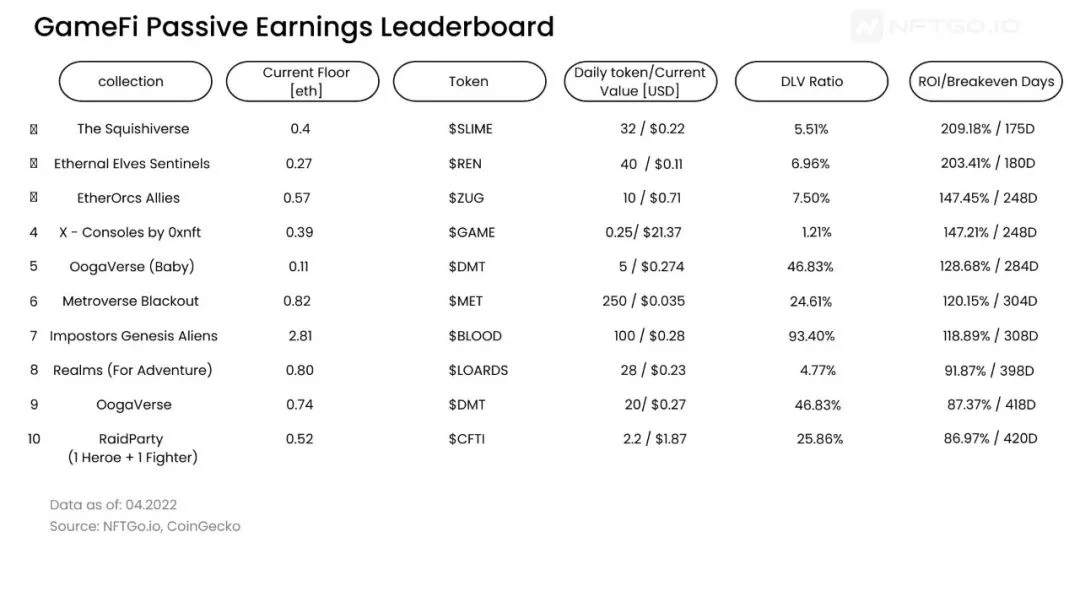
image description
first level title
epilogue
epilogue
GameFi is a video game market under the Web3 ecosystem, based on the community, for the community. GameFi allows players to earn and trade Tokens in exchange for any desired digital assets. Most importantly, players have custody of digital assets.


