


Introduction
Introduction
Introduction
Since last summers crazy rally, NFT is facing a historical cooling-off period in the market. We investigated the performance of blue-chip NFTs in our first article, and this article will continue to examine the macro trends driving price changes in the NFT market.
Over the past week, there has been over $246 million in transaction volume on Ethereum, with most of the transactions on the market denominated in ETH. As the value of ETH fell from an all-time high above $4K to $1K, NFT valuations were also affected by this plunge.
In such uncertain and speculative times, we can use data to spot signals from noise and make data-driven decisions. In this post, we will examine the correlation between ETH and NFTs.
How is the market cap of NFT and ETH calculated?
In general, market capitalization is a metric for analyzing the dollar value of a company, NFT collectible, or cryptocurrency. This indicator is based on the assets current share price and its total outstanding shares. Since both stocks and cryptocurrencies are fungible assets, the market capitalization of these types of assets is calculated by multiplying the total number of outstanding shares by the current market price of one share. For example, if a cryptocurrency has a total of 1 million shares and the share price is $20, its market capitalization will be 100*$20 = $20 million.
In NFTs, each NFT in a collection may have a different value due to rarity and other dynamic factors. The NFT market is also composed of ERC1155 (Semi-fungible) tokens. In order to accommodate these two factors and provide an accurate representation of the total value of NFT collectibles, NFTGo.io market cap calculation is the maximum value between the floor price of NFT collectibles and its latest transaction price. In this way, we can exclude some of the highest-priced collections to reflect the total value of the collection.
Why is market capitalization important?
Market capitalization plays a key role in assessing the potential upside of a project, and is one of the important indicators for investors to measure their willingness to pay for NFTs. While the average price of an NFT may be overvalued or undervalued, market capitalization more accurately determines the total value of NFTs. Before investing in an NFT project, it is very important to pay attention to market value, floor price, and average price. Market value represents the risk and value of the project, and these dynamic factors are related to how to make strategic investments in NFT.
1- Risk Management
Risk reduction and portfolio diversification are key components of a successful NFT investment strategy, and risk management and predicting risk allow players to make better decisions in speculative markets.
Similar to when a storm hits, oak trees with stronger trunks and roots are stronger than small saplings; compared with newly issued projects and projects with low market capitalization, NFT projects with high market capitalization are usually less volatile, which shows that market capitalization is at risk. The key role in management, this article will explain the volatility of more different categories of NFT projects.
2- value
Market conditions determine market value. This indicator can help investors judge the valuation of NFT by other investors, and help traders and investors identify high-value projects.
Correlation between ETH and NFT
The dizzying sell-off after aggressive liquidation caused the price of ETH to shrink sharply, while the NFT market is mainly denominated in ETH, and almost all NFT transactions are completed by ETH or WETH.
The market value of ETH has fallen from a high of approximately US$550 billion in early December 2021 to less than US$130 billion in June 2022. In the past three months, both ETH market value and NFT market value have fallen together.
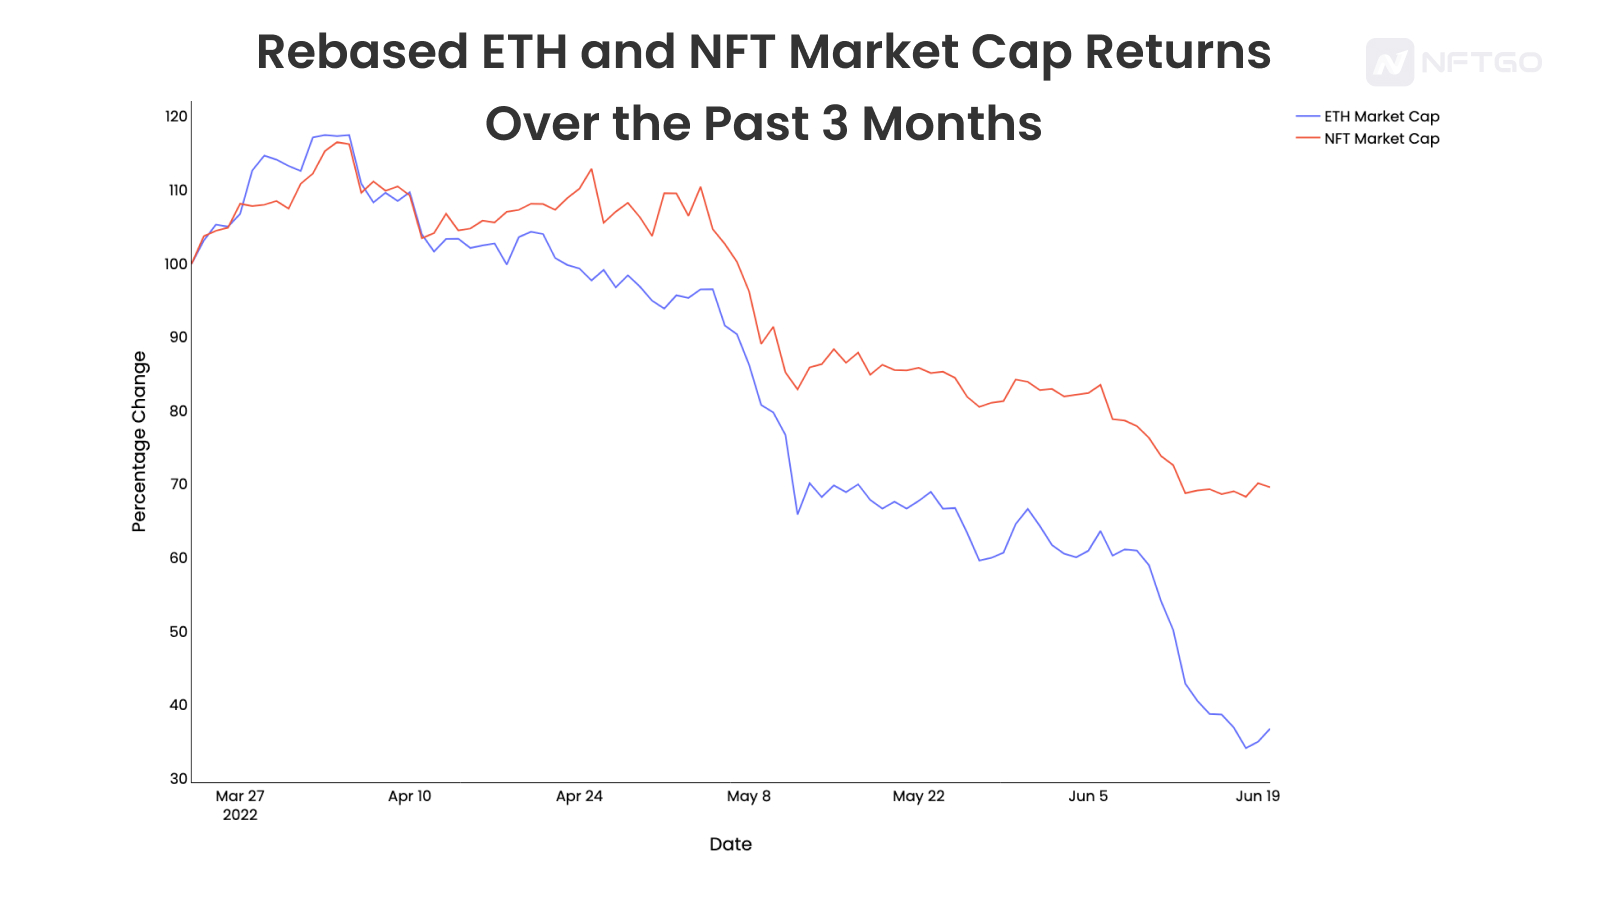
The chart below shows the rescaled ETH and NFT market capitalization returns from this period to today. In the rebasing chart, both market values start at 100, above 100 indicates an increase, and below 100 indicates a decrease from the initial value. The common downtrend of ETH and NFTs shows a strong correlation.
image description
Rebase ETH and NFT market capitalization returns over the past 3 months
Why are NFTs crashing less than ETH?
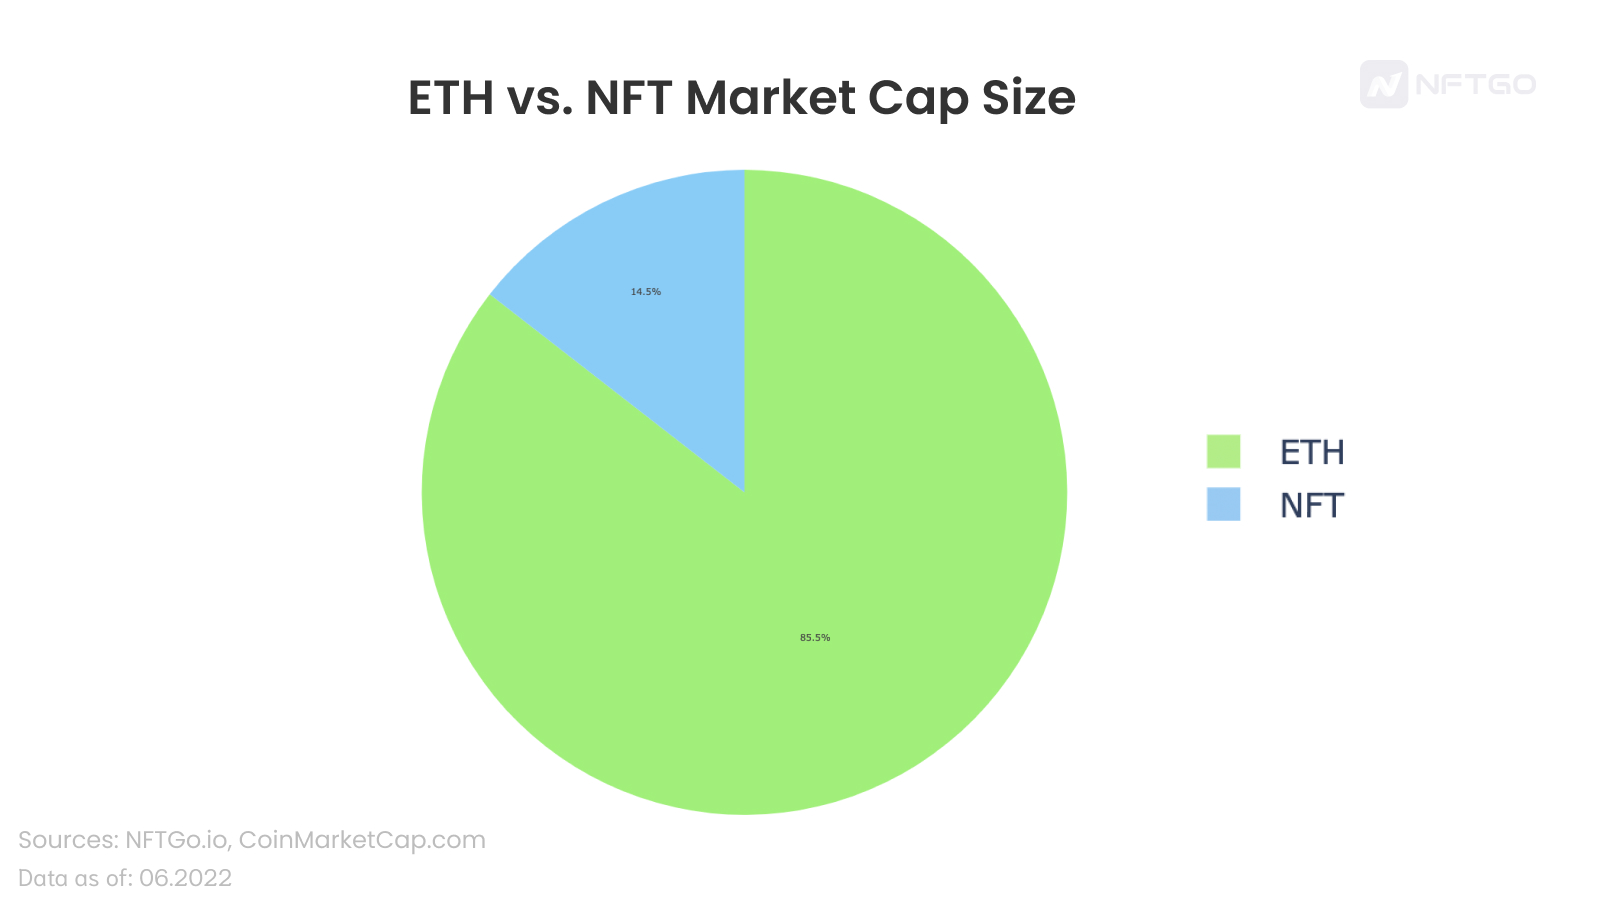
Its worth considering that NFTs are a very small subset of the crypto market. NFT brings together culture, art, finance and transactions, providing a decentralized way to connect creators and fans. ETH is several orders of magnitude more mainstream than NFTs, and there are huge funds with high leverage in the cryptocurrency market that have been liquidated significantly in the past few weeks. All these dynamics have played together to cause a larger decline in the market value of ETH, below The chart below illustrates the market size of the two assets.
image description
Comparison of the market value of ETH and NFT
One way to quantify how mainstream NFTs are relative to cryptocurrencies is to calculate the ratio of NFT market capitalization to mainstream crypto assets like ETH. For example, on March 21, 2022, according to YCharts, ETHs market capitalization was $238.3 billion, and the NFT market capitalization chart recorded by NFTGo.io on this day was $19.3 billion. The NFT/ETH ratio on March 21 will be 19.3 / 238.3, roughly equal to 0.26. On the other hand, the numbers changed on Dec. 5, when ETH was $498 billion and NFTs were $9.8 billion. These changes in the NFT/ETH ratio can show how close NFTs are to the size of ETH’s market cap over time. In this case, the focus of the analysis is not necessarily to predict when NFTs will reach a ratio of 1, but to analyze the growth rate of NFTs relative to mainstream assets such as ETH.
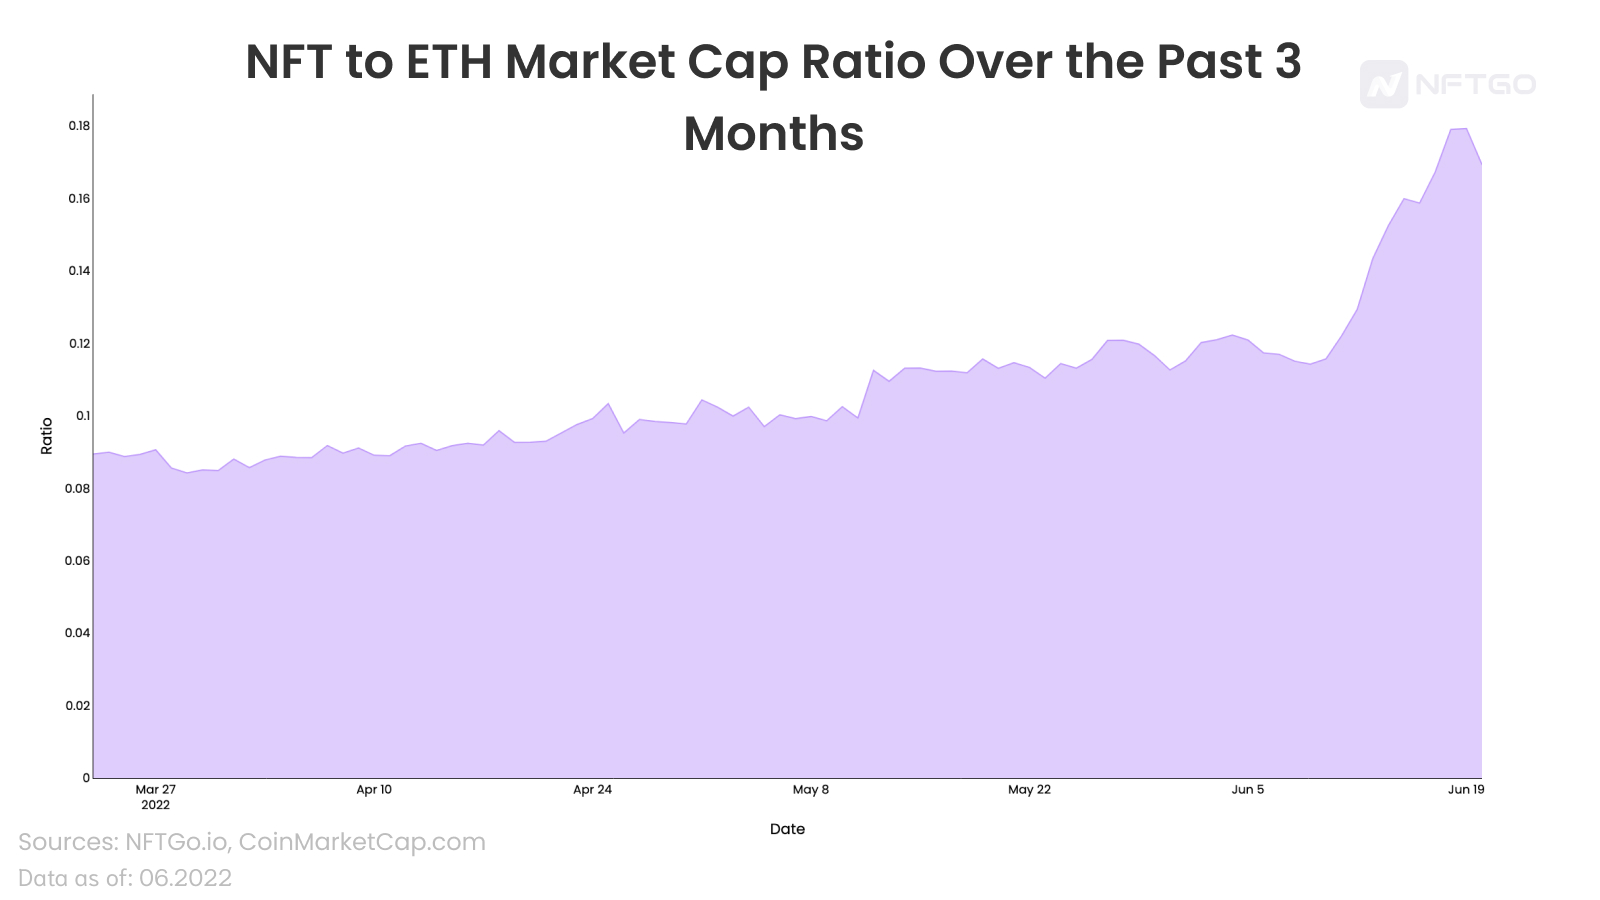
The graph below shows the NFT/ETH market capitalization ratio from the end of November 2021 to May 2022. We can observe an increase in the NFT/ETH ratio. The ratio has grown from below 0.02 at the end of 2021 to above 0.05 in just two months. The NFT market continues to grow again, from 0.05 to now getting closer to 0.08.
image description
Logarithmic scale of ROI for NFTs and ETH
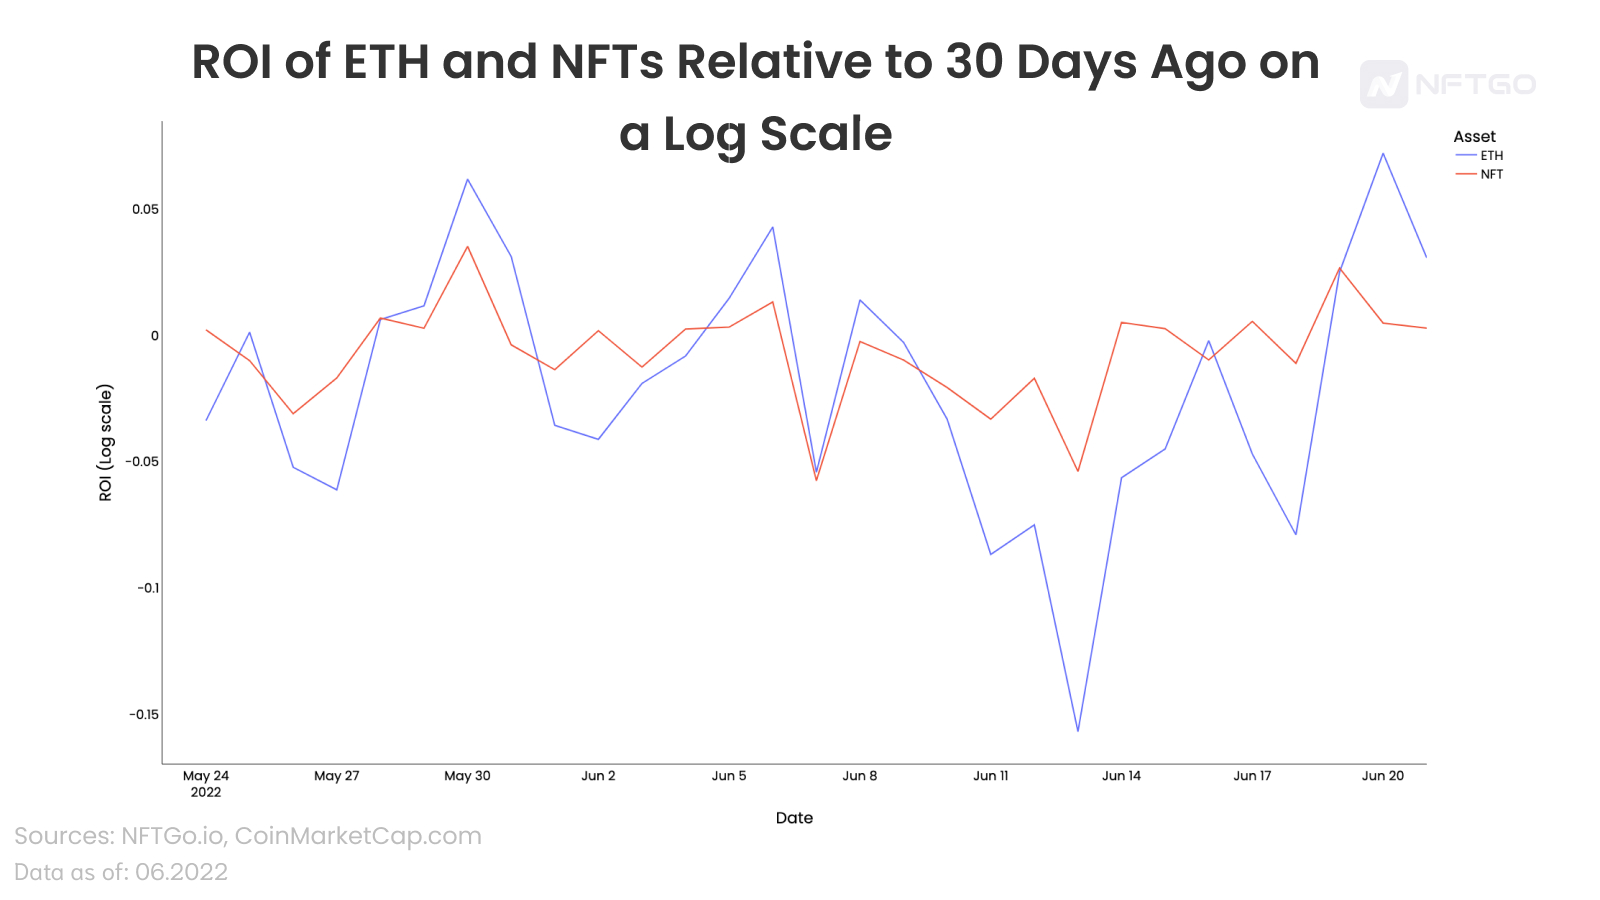
Earlier, we looked at the reinvested ROI of NFTs and ETH. However, over the past 3 months, both NFT and ETH prices have fluctuated wildly. To capture these drastic changes, we can use a log scale chart to accurately analyze the ROI percentages for various large and small changes. The chart below shows the ROI of ETH and NFTs relative to their market capitalization at the start of the week.
Log Scale of ROI for ETH and NFTs relative to 30 days ago
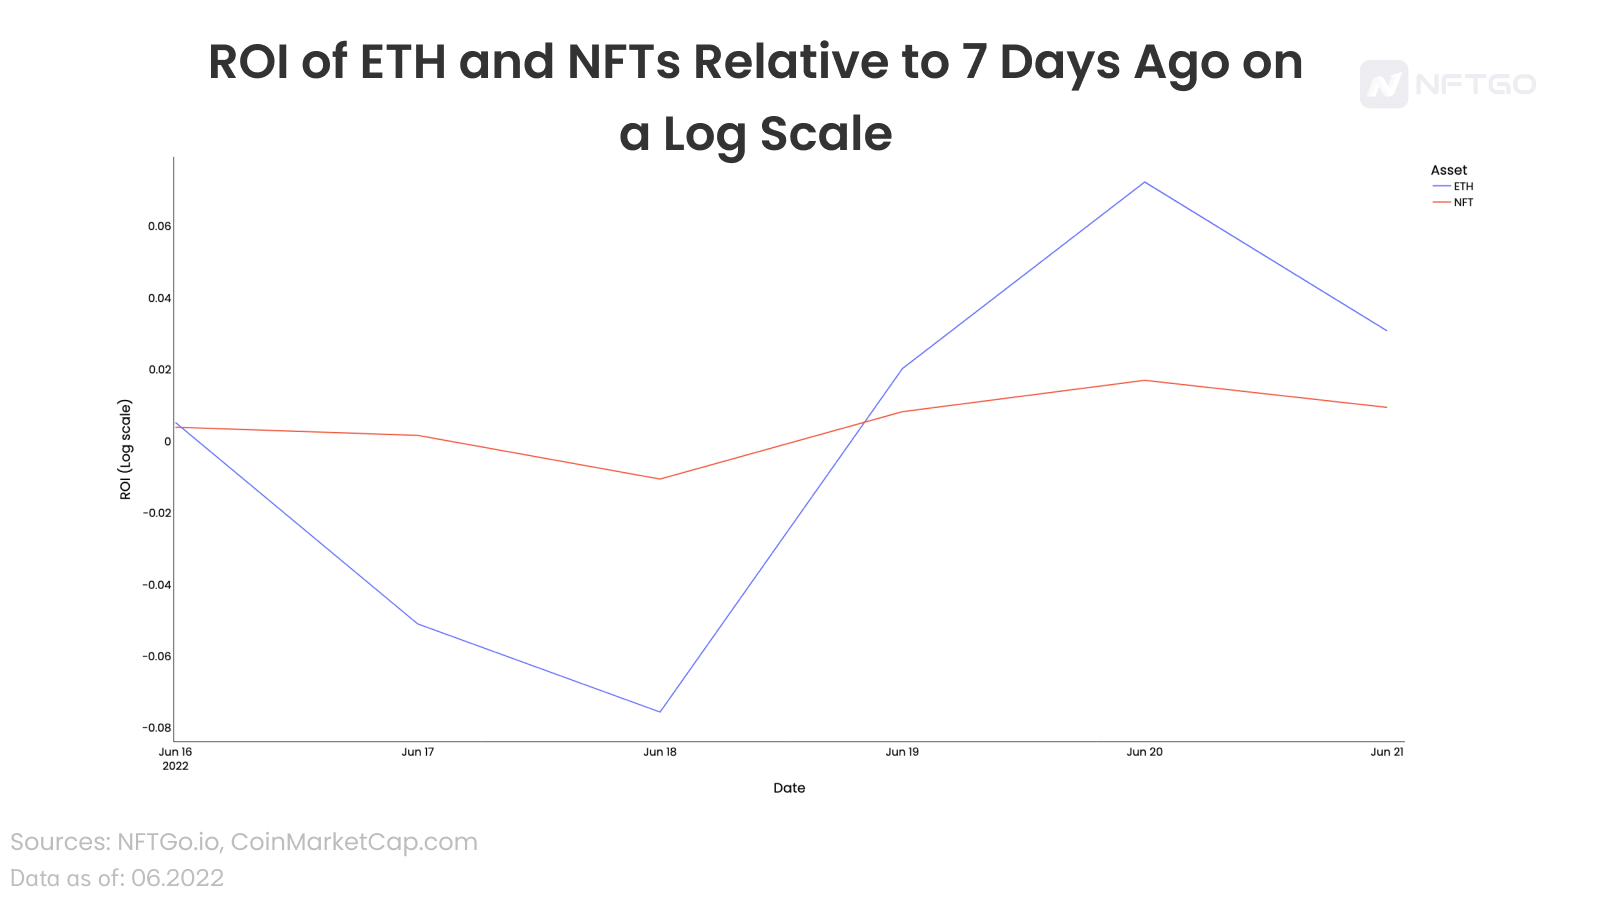
We can observe that both ETH and NFT are moving in the same direction. As ETH fell, the price of NFTs also began to fall, and therefore, their market cap also fell. However, the change in ETHs market capitalization is more dramatic than that of NFT. By only zooming in to the past week, we can see more subtle changes from the NFT market.
image description
Log Scale of ROI for ETH and NFTs relative to 7 days ago
The correlation coefficient of two data points gives us insight into how dependent they are, and studying the correlation of two variables allows us to understand the dynamics of the influence of each value.
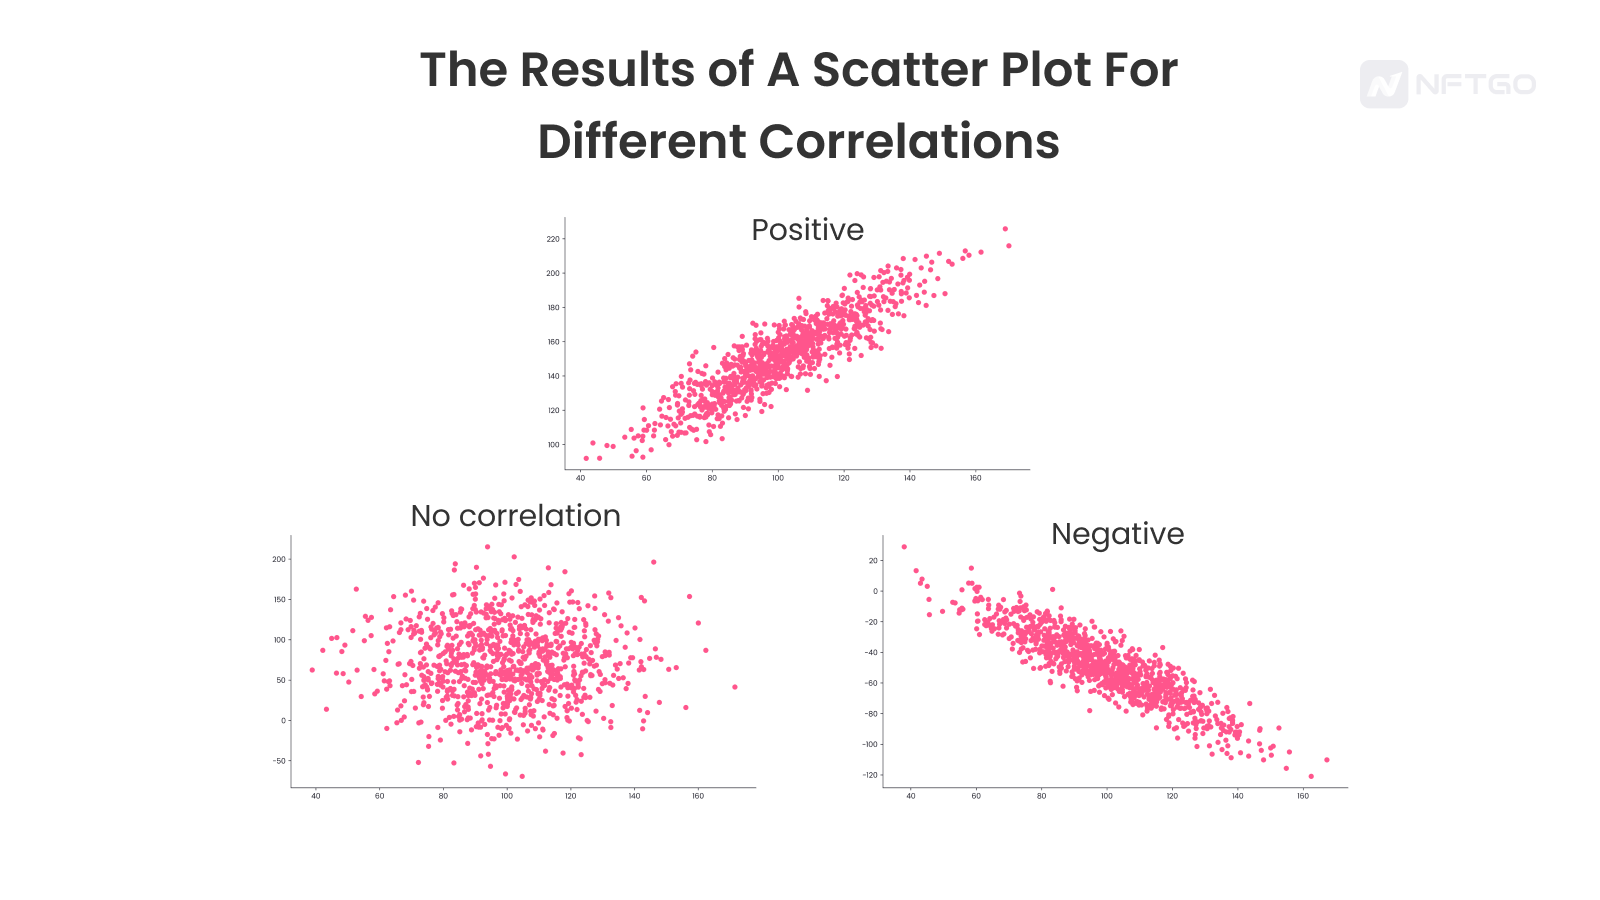
A correlation coefficient close to 1 means that there is a one-to-one relationship between the two values. In our case, this means that the NFT market closely follows the market cap of ETH. Another situation may be that there is a subtle correlation between the market value of NFT and ETH. In this case the correlation will be close to zero. We can use a scatterplot to illustrate the correlation between NFT market capitalization and trading volume. Before we examine the results, the chart below shows how each case of positive, negative, or zero correlation appears in the scatterplot.
image description
Results of scatterplots with different degrees of association
The strength of these correlations depends on the cycle of the market.
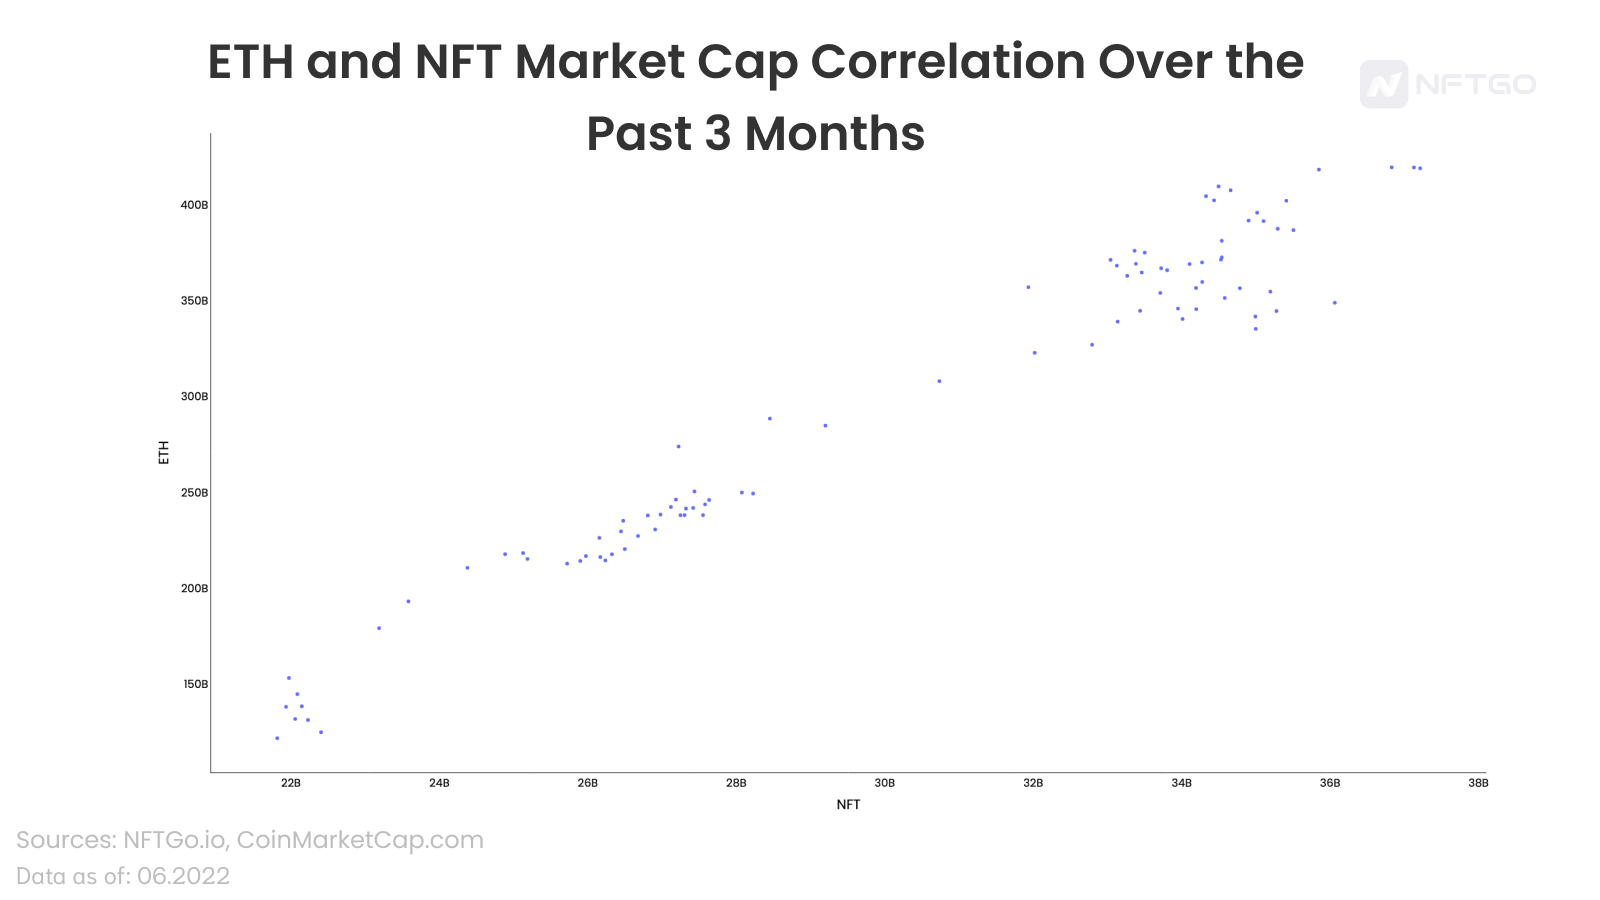
The chart below illustrates the correlation between NFT and ETH market capitalization over the past 3 months. The x-axis represents the total market capitalization of NFTs, which grew to over $38 billion at its peak, and the y-axis represents the market capitalization of Ethereum over a 3-month period over the same period.
Correlation between ETH and NFT market capitalization over the past 3 months
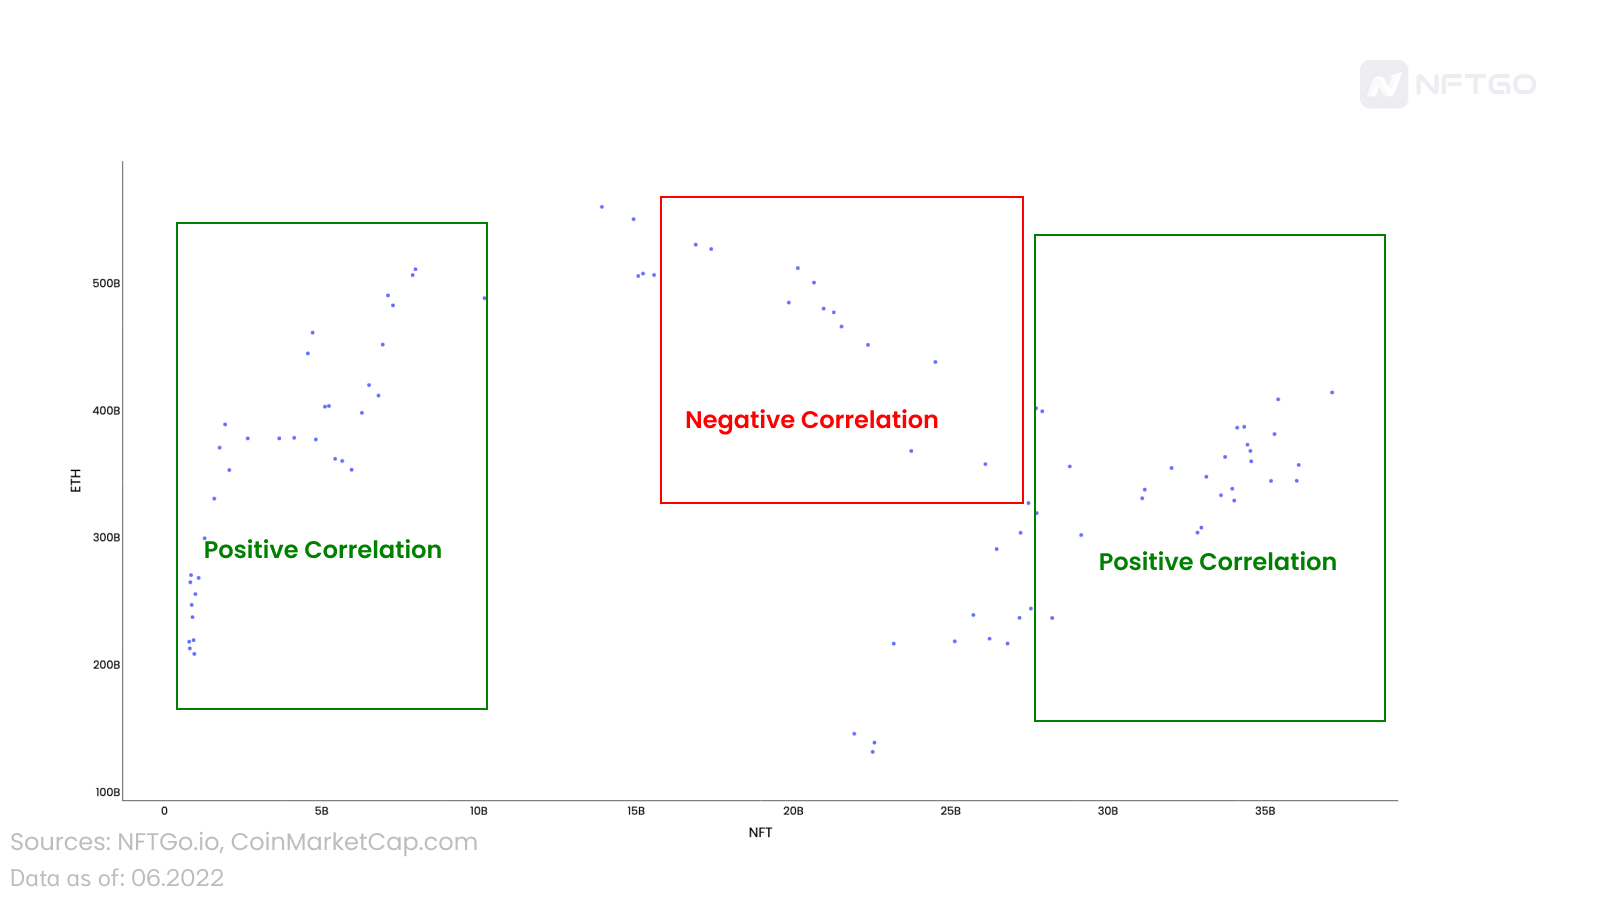
However, when we extend the time frame to 1 year, the correlation is not always negative or positive. In the NFT market, there have been times when the correlation was both negative and positive, and NFT did not directly follow the ETH trend. The unique bull market of NFT, a large number of issuances, the entry of giant whales, and the emergence of new blue chips can all make the NFT market more independent of the ETH market.
image description
Analyze the Pearson correlation between NFT and ETH
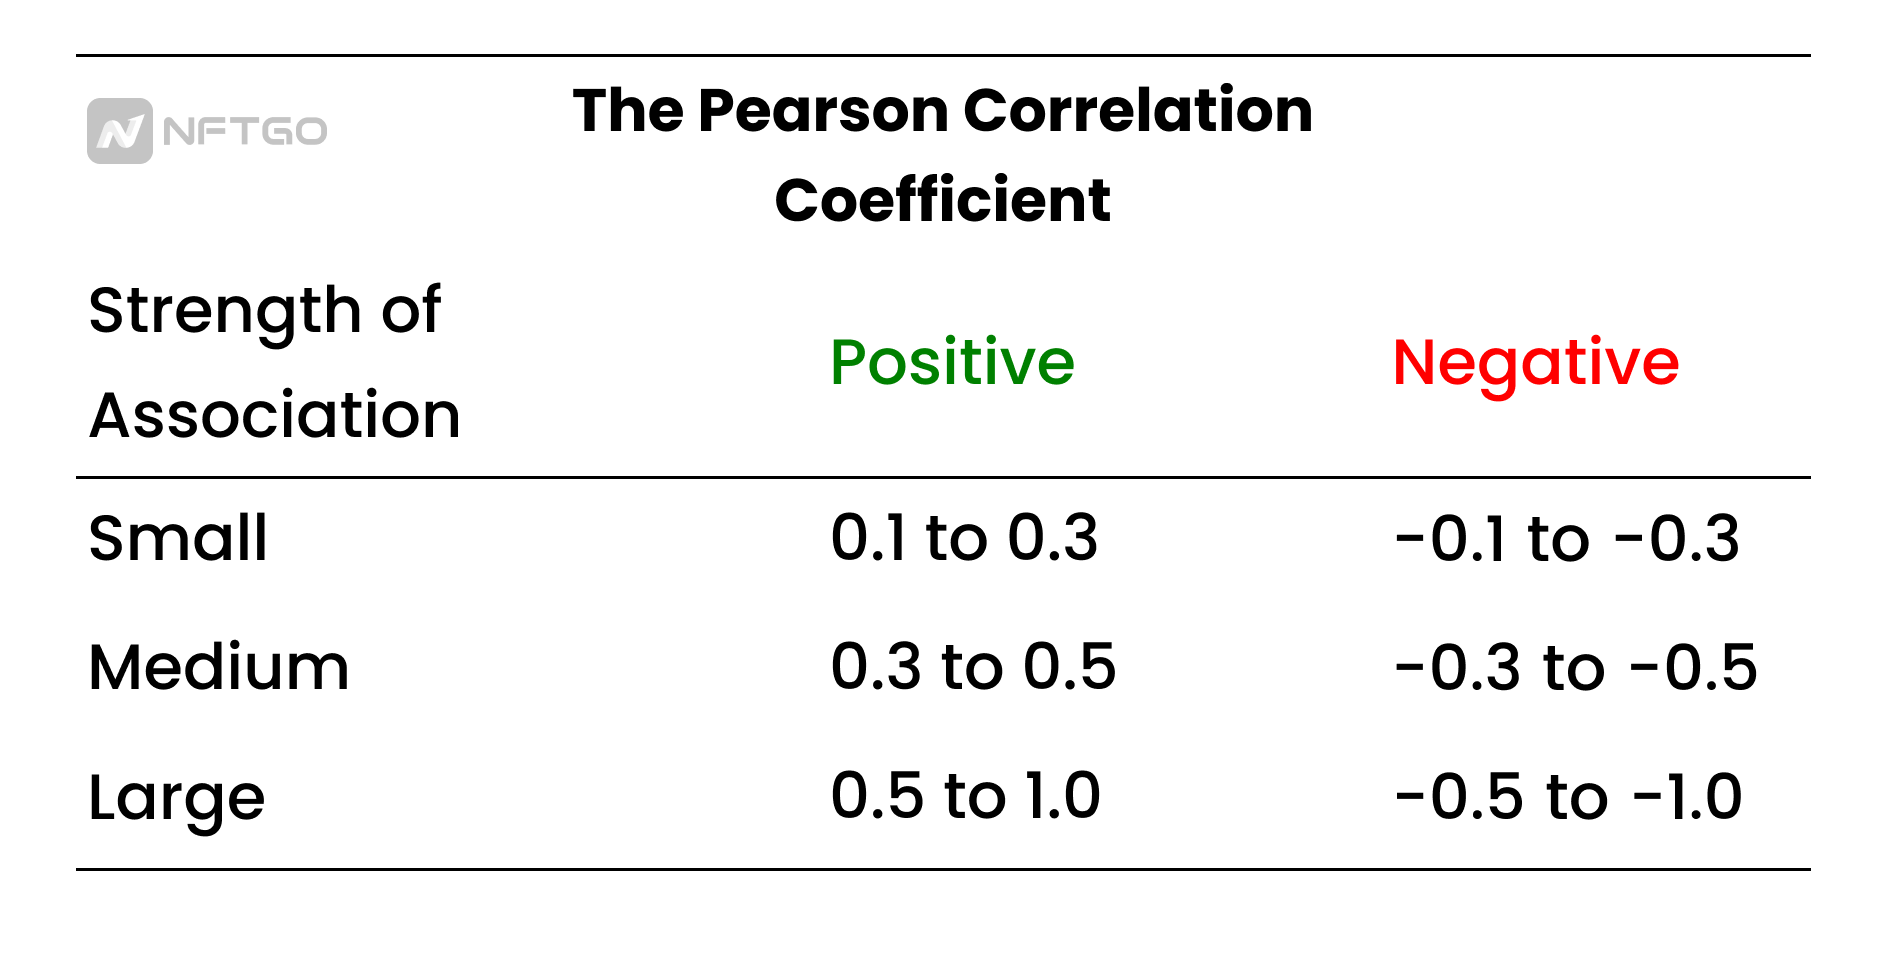
The Pearson correlation is a formula used to analyze the strength of a linear association between two variables. This value (indicated by r) can be between -1 and 1. Depending on the value of r, we can analyze the linear correlation between two variables.
image description
Pearson correlation coefficient
Use Bitcoin as a reference
Bitcoin is widely considered to be strongly correlated with ETH. Since these two cryptocurrencies make up a large percentage of the overall cryptocurrency market capitalization and are two of the most popular cryptocurrencies, they usually rise and fall together during times when the market buys low and sells high. We can use the strong positive correlation between BTC/ETH as a reference for analyzing the strength of NFT/ETH correlation.
Correlation is unstable
However, we need to consider the role of different market cycles on correlations. When analyzing financial assets, it is worth remembering that correlation is a cyclical and contextual factor. The strength of the association between two assets, even a positive or negative association, can change over time. To illustrate this, we analyze the Pearson correlation of two pairs: ETH/BTC and ETH/NFT in four different time windows:
Long term: 1 year
Medium term: 3 months
Recent: 1 week
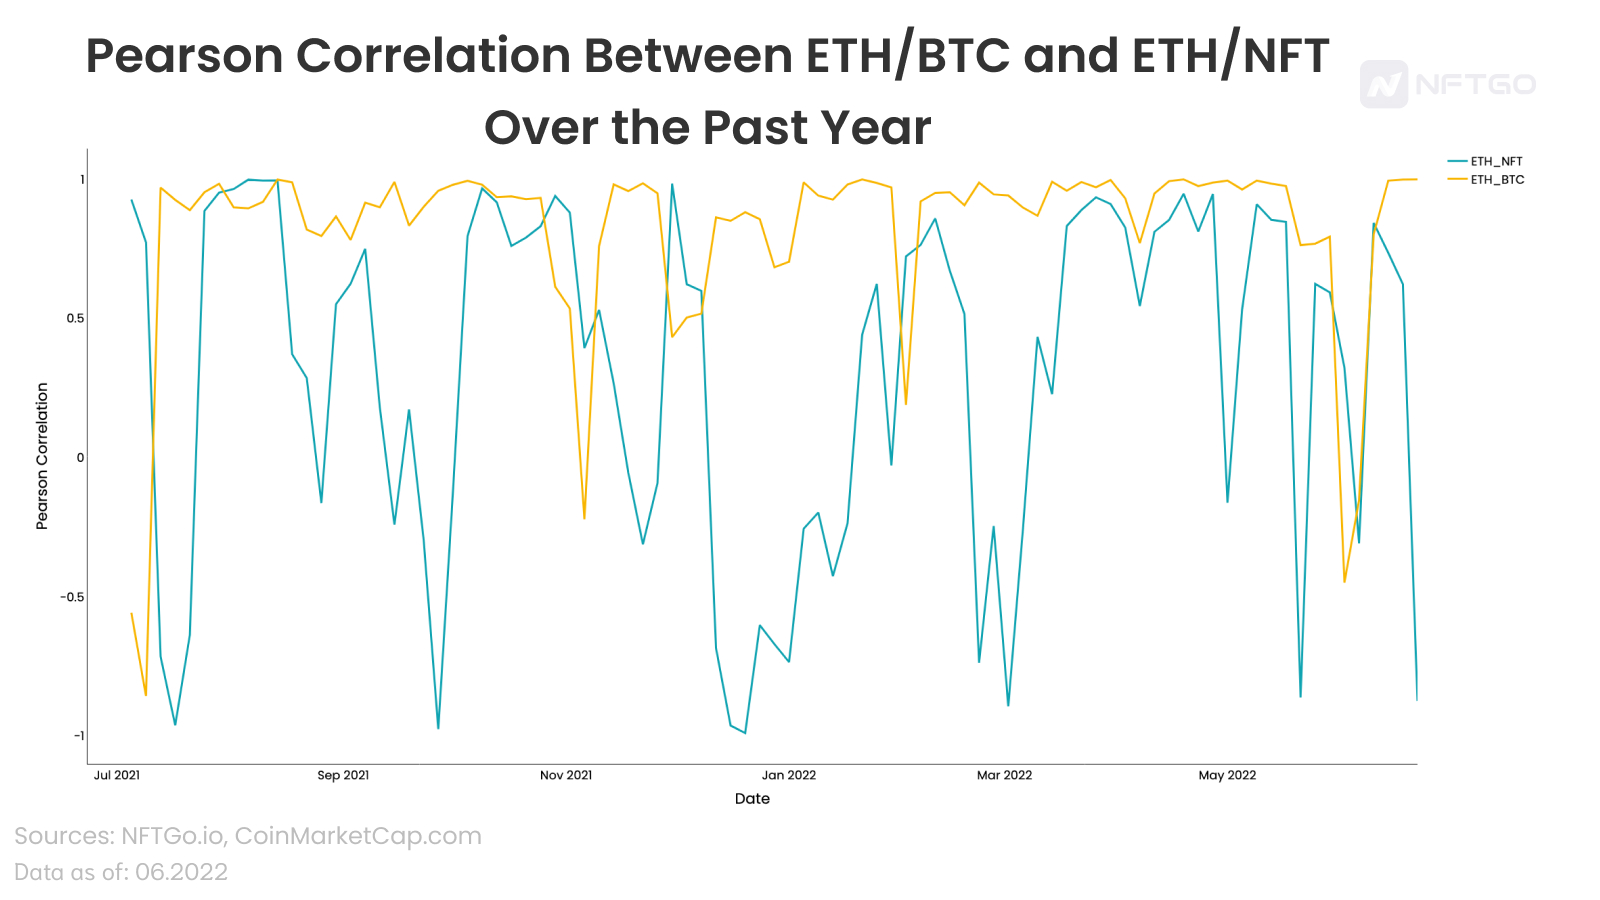
The chart below illustrates the Pearson correlation of the two currency pairs over the past year. This graph illustrates how volatile the correlation between two speculative assets can be, even if the two assets are ETH and BTC, and they are both in the cryptocurrency space, the negative correlation between the two assets is that they A signal of a unique value proposition in the market. We can observe that the correlation degree of ETH/BTC is closer to 1 than that of ETH/NFT. Using BTCs correlation with ETH as a reference, we can observe an independent movement of the NFT market relative to ETH.
image description
Pearson correlation between ETH/BTC and ETH/NFT over the past year
Most importantly, a correlation close to zero indicates independence from other assets, while an asset with a negative correlation is used as a hedge against other assets. A concrete example is hedging against a declining dollar by holding assets such as gold. NFT and digital collectibles are used as a hedge against the possible decline in cryptocurrencies such as ETH.
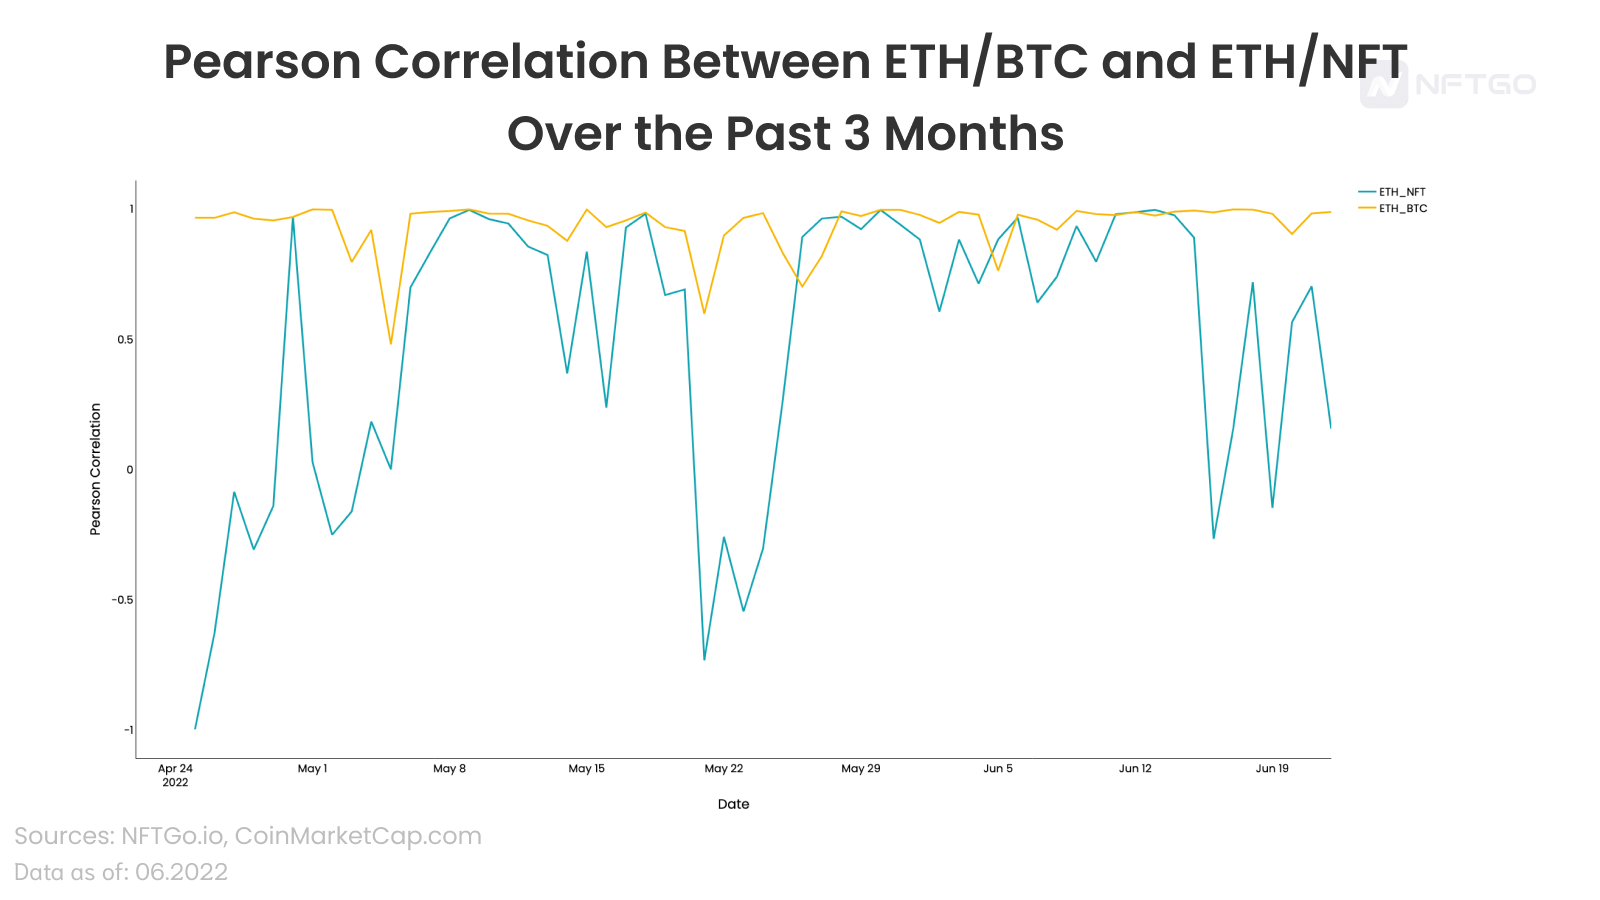
Cryptocurrencies have been in a bear market since early 2022. But the NFT mania continues, with projects like Otherdeed and Moonbirds enjoying great success in the cryptocurrency bear market. The chart below narrows the time frame to 3 months.
image description
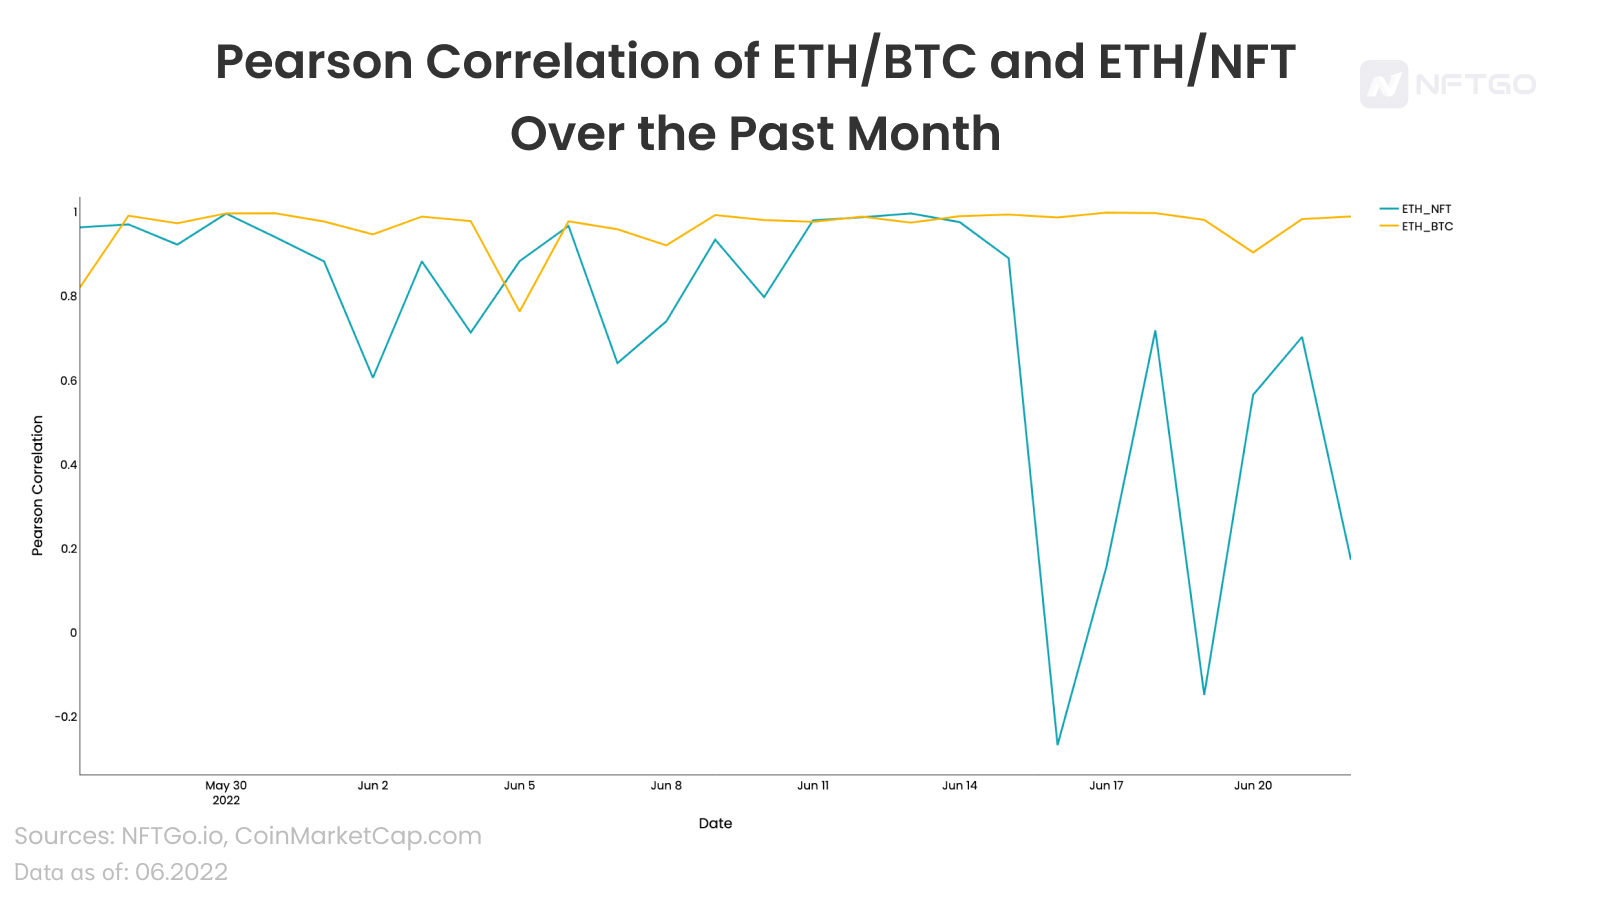
The chart below illustrates the Pearson correlation of the two currency pairs over the past month. In this time window, the correlation of ETH and BTC has been very close to 1, and it has remained almost flat during these three months. However, even though NFTs started the period with a correlation close to 1, since June 13, the correlation between NFTs and ETH has been trending negatively. NFTs have been shifting toward more volatile correlations lately compared to the beginning of the month. This could be caused by several events specific to NFTs.
2- NFT NYC
1- Blue chip favorites and new companies like Yuga Labs make new announcements
Pearson correlation of ETH/BTC and ETH/NFT over the past month
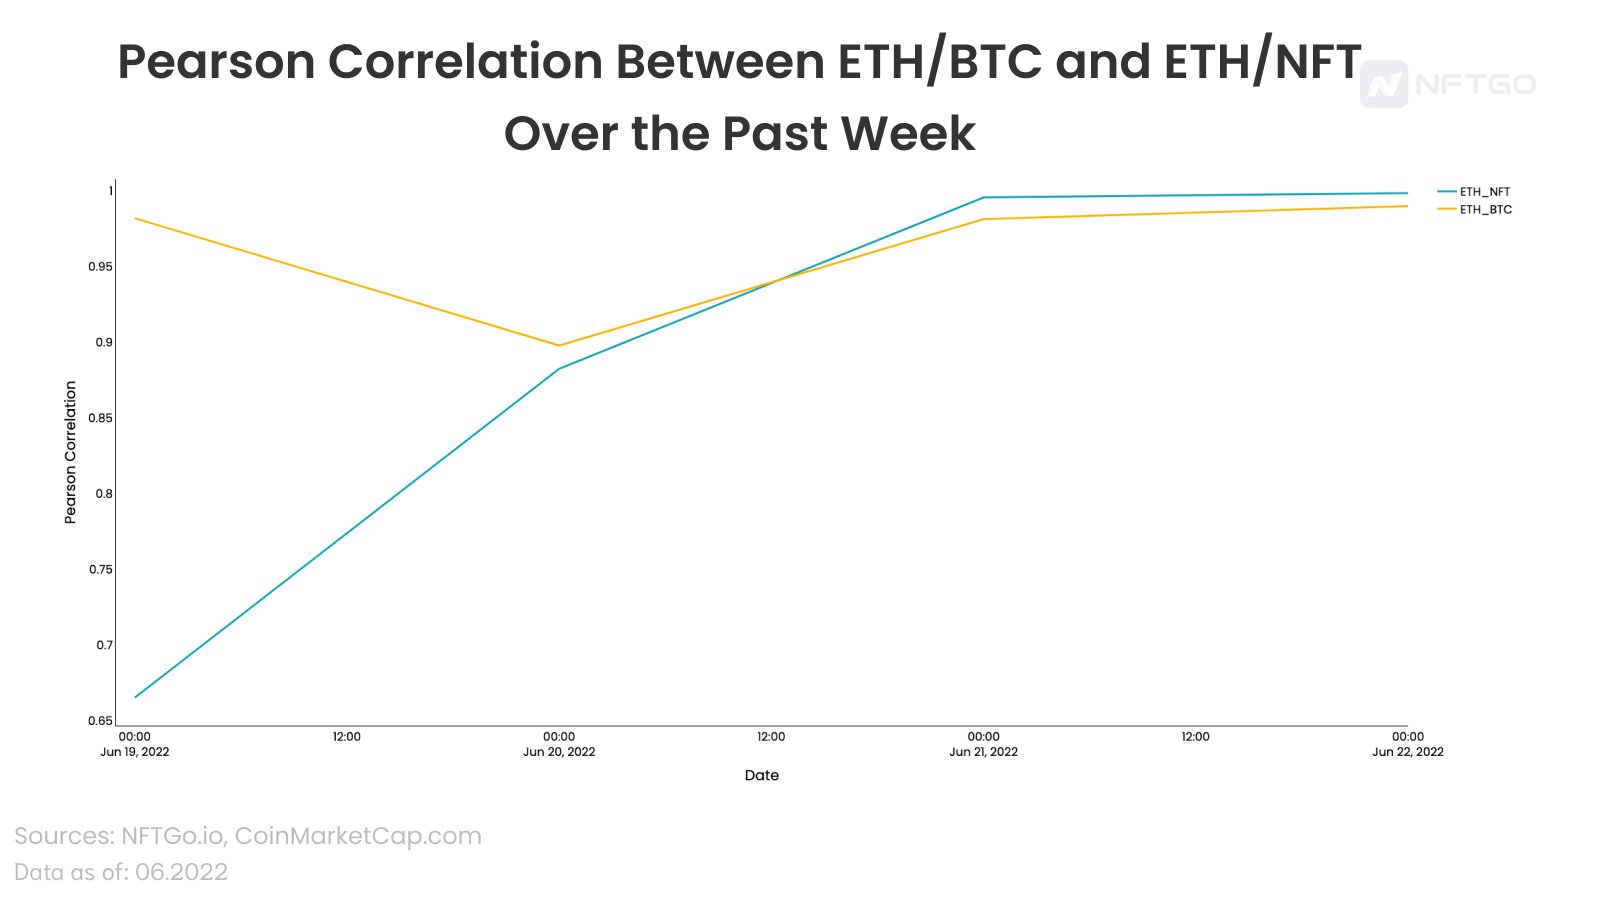
But thats not always the case. As we shorten the time frame to the current bear market, we can see a stronger positive correlation between ETH and NFTs. In the past week, the market value of NFT and ETH has been strongly correlated, which shows that NFT is more related to the ETH market than in the bull market. The cooling period of NFT Summer has been replaced by the slow pace of blue-chip NFT launching new series to expand the brand.
image description
Pearson correlation of ETH/BTC and ETH/NFT over the past week
Can NFT survive this plunge?
Over the past few weeks, the cryptocurrency market has been rocked by the latest macro events. The $LUNA crash in early May was a prelude to a cryptocurrency recession, the result of aggressive rate hikes by the U.S. Federal Reserve.
The bull cycle in the cryptocurrency market has now transitioned into liquidation amid the global pandemic, with hedge funds losing highly leveraged positions and cryptocurrency investors experiencing a sharp decline in the total value of their portfolios.
This bear market may have wiped out some NFTs, but many more are recovering from the market crash.


