


Original author: Alfred, Trend Research
1. The macro and crypto market are gradually improving
1. Signs of tariff easing
The short-term direct emotional impact and risk aversion brought about by Trumps tariff policy have eased, and market volatility has declined. Trump made a public speech on Tuesday (April 22) local time, admitting that the current US tariffs on goods imported from China are too high and that the tax rates are expected to be significantly reduced. This marks that Trump has softened his attitude on his signature tariff policy.
2. Expectations of interest rate easing
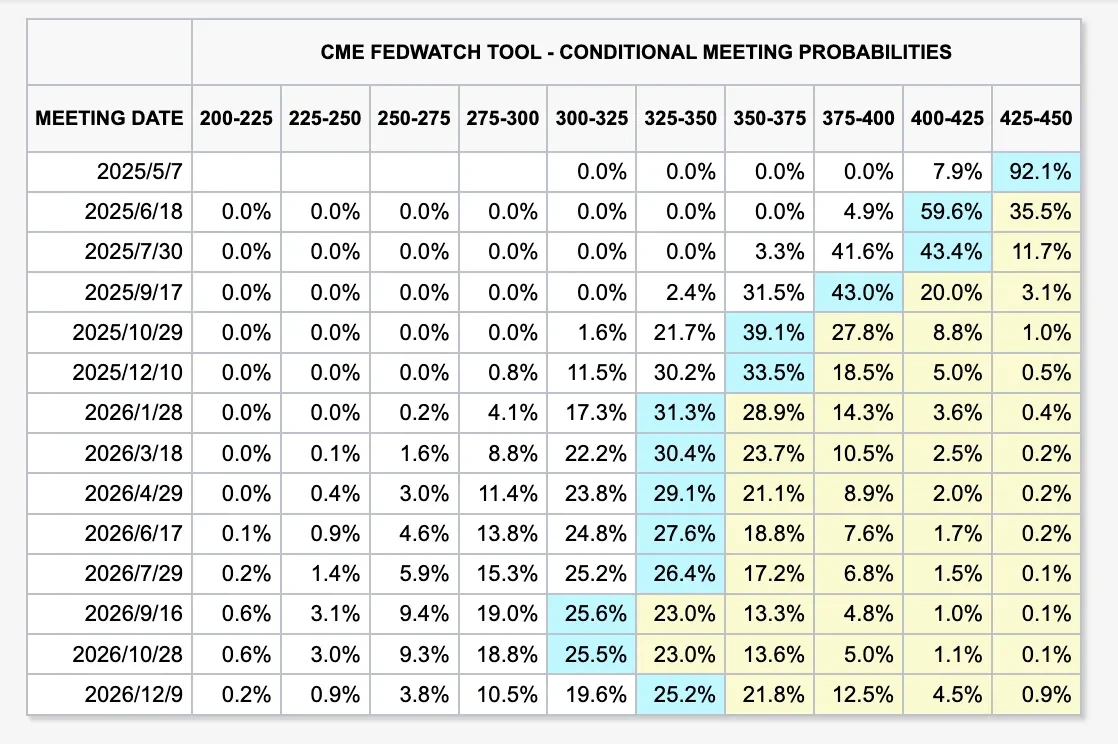
The current CME interest rate futures imply that interest rates will be cut starting in June, with a total of three cuts this year. This may inject new liquidity into the market.
3. Crypto-friendly policies are gradually implemented
Since Trump took office, the crypto market has become a key industry for his development, aiming to create a new dollar hegemony system. (1) On March 6, 2025, Trump signed an executive order to formally establish the Strategic Bitcoin Reserve and the U.S. Digital Asset Reserve. The plan is currently being promoted. At the same time, dozens of states in the United States are promoting Bitcoin state reserve bills. If Arizona passes the final three readings, it will be submitted to the governor for signature.
(2) The United States is currently promoting two stablecoin bills, the GENIUS Act (Guidance and Establishment of the United States Stablecoin National Innovation Act) and the STABLE Act (Stablecoin Transparency and Accountability for Promoting the Economy Act). Both bills have been passed by their respective committees. It is generally expected in the industry that the final bill may be passed and implemented in the second half of 2025, depending on the speed of coordination between the two houses and the attitude of the president.
(3) On April 22, Paul Atkins, nominated by Trump, officially succeeded Gary Gensler as SEC Chairman. Atkins is seen as a regulator friendly to the crypto industry and is expected to reduce enforcement actions against crypto companies and promote industry innovation.
4. BTC turns from short to long
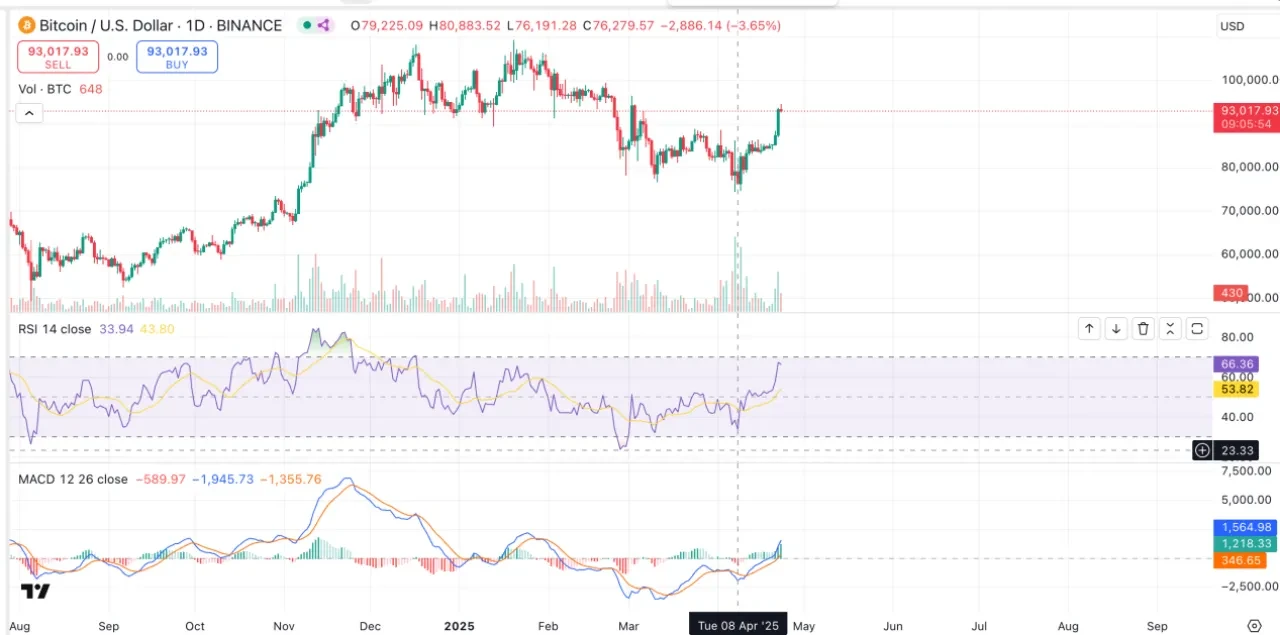
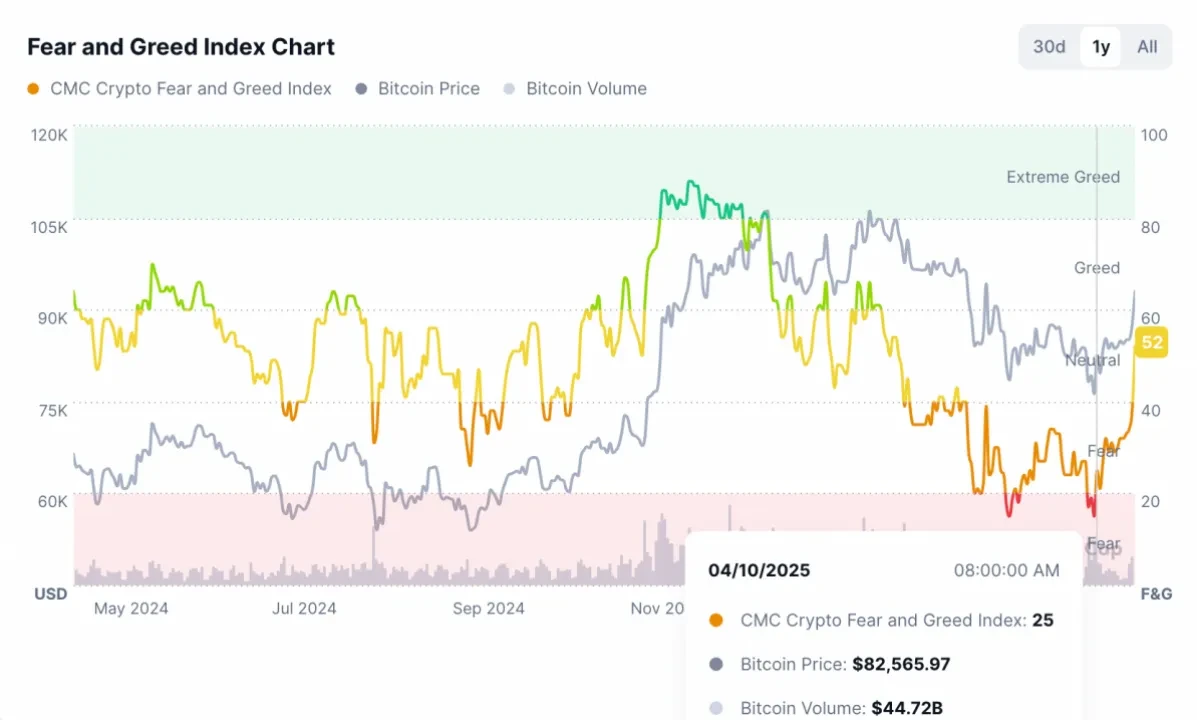
Since mid-March, BTC has outperformed the U.S. stock market overall, reflecting some of the safe-haven properties similar to gold. Around April 8, BTCs RSI and MACD both showed a bottom divergence, and the superimposed sentiment indicator reached an extremely panic position, forming a recent bottom. So far, both the MACD fast and slow lines have come above the zero axis, and the market trend has turned from short to long.
2. ETH may lead the trend reversal of the altcoin market
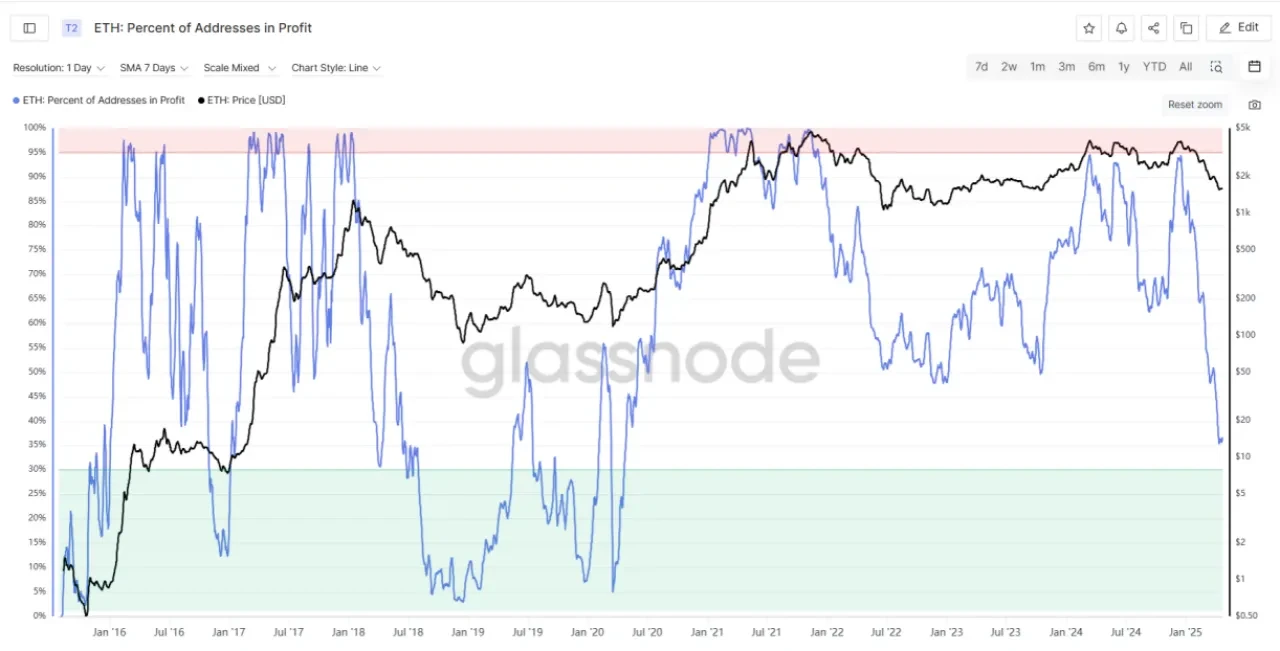
1. On-chain data: ETH has experienced a long decline of 5 months since December 2024. The number of profitable addresses has dropped to a lower level than in the bear market and continues to be oversold. Currently, with the recovery of the crypto market, it has entered a critical support-resistance swap range.
(1) Profitable address data
The number of profitable addresses has dropped rapidly, from nearly 95% at the end of December last year to only about 35% of the addresses still making profits. This level is even lower than during the 2022 bear market.
(2) MVRV indicator
The MVRV indicator has dropped to 0.8, the market value is already lower than the realized value, and it has clearly entered an oversold state, which is equivalent to the bear market stages in 2022 and 2019.

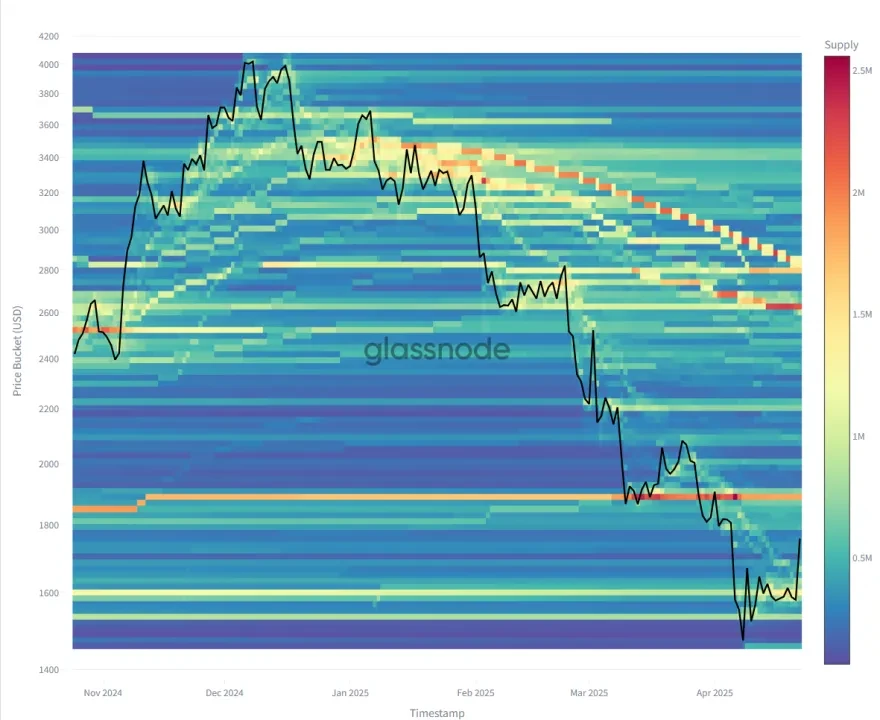
(3) Cost basis distribution
The redder the color, the more chips are exchanged. The four active trading areas are: $3200-3400, $2600-2800, $1850, and $1650.
In the $3200-3400 area, as time goes by, holders fail to hold firmly and sell at a loss (the color changes from orange and yellow to green). In the $2600-2800 area, the accumulation time is short, but it is still in the holding state, and there is no large-scale exit. The $1850 area is the position of long-term holders, and there has been no major change in the position since November 2024. $1650 is the accumulation area formed by looking for a new bottom after this decline.
Judging from the cost basis distribution, there is a large area of accumulation of chips by long-term holders near 1850. It is necessary to observe whether a pressure-support swap is formed to form a new support level.
2. Contract data analysis: As the second largest cryptocurrency by market value, ETH has a huge contract market size. The contract size of the exchange is several times or even dozens of times the balance of its wallet. At present, the contract market has shown a certain degree of synchronous rise with spot funds.
(1) Changes in contract positions
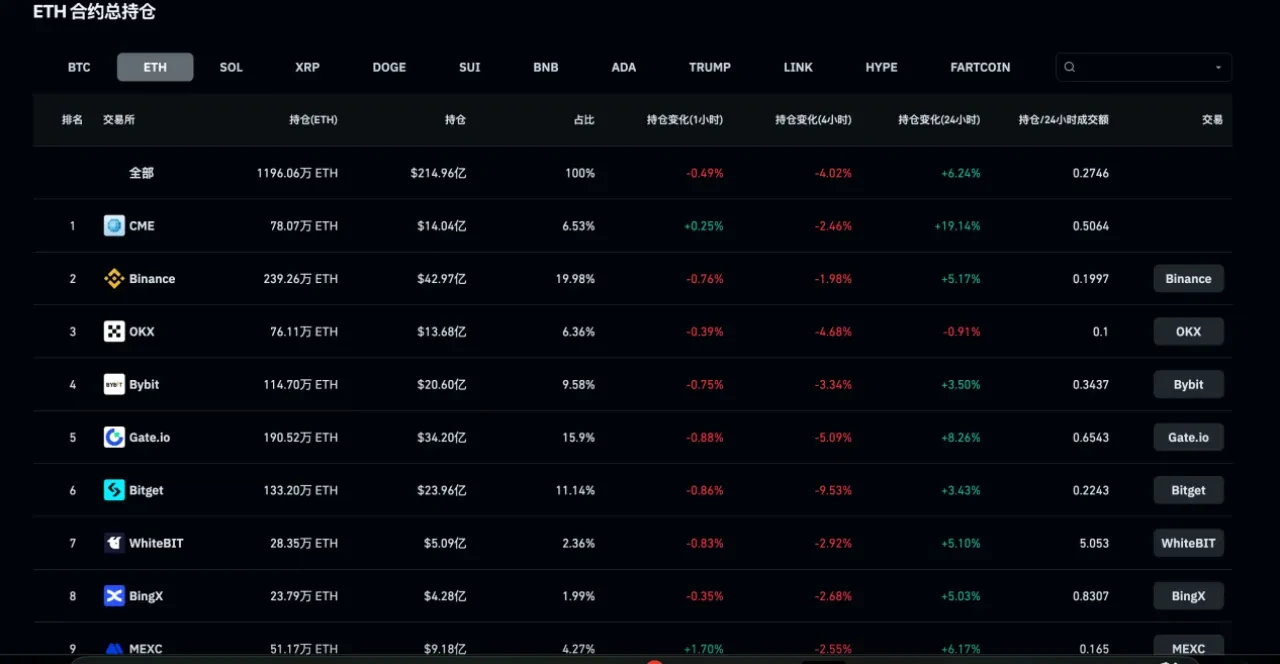
At present, the total amount of ETH contract positions is 21.821 billion US dollars, the market value is 216.9 billion US dollars, and the OI/MC is around 10%. Among the major currencies, this indicator is 3.5% for BTC, 7.3% for SOL, and 0.9% for BNB. It can be seen that ETH has more liquidity and reference significance in contracts.
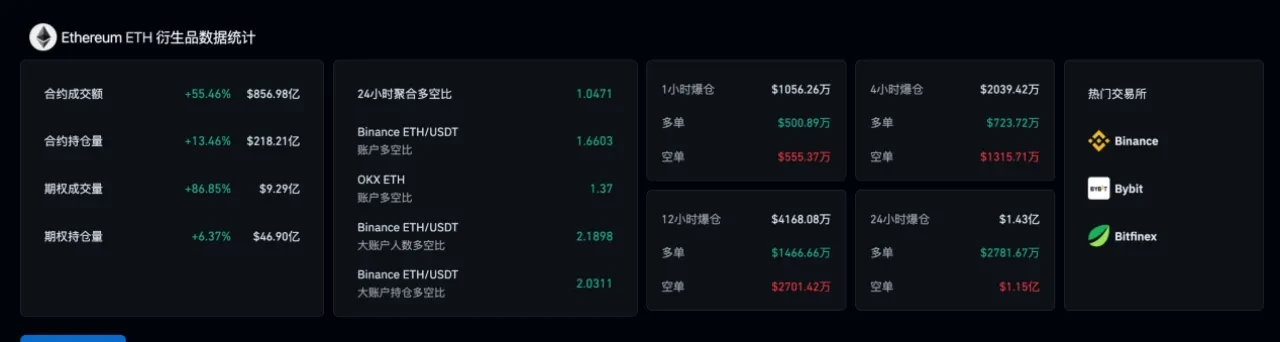
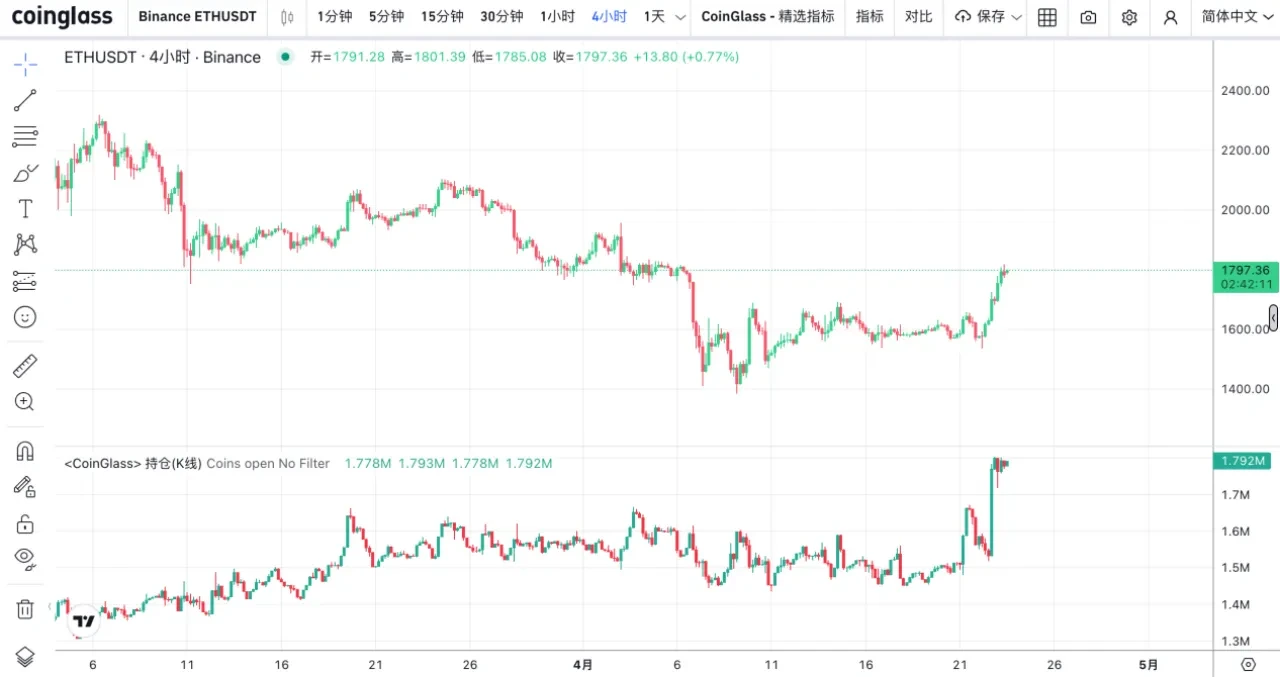
Currently, the total volume of Binance ETH-USDT contracts is 1.789 million ETH, making it the ETH contract trading pair with the largest holdings.
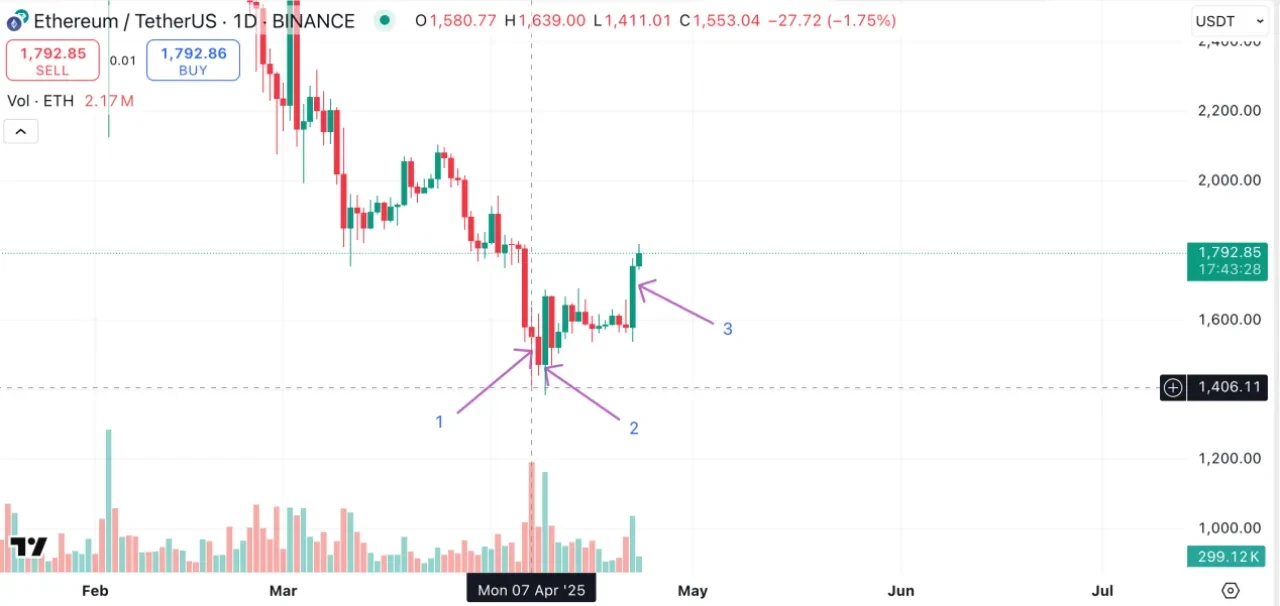
According to the figure below, since April 11, ETH has tested the resistance level of around 1650 three times, and the contract open interest and price increase are positively correlated. On the evening of April 22, the ETH contract open interest increased significantly, driving the price to break through to $1695. Subsequently, the total contract open interest remained in the range, while the price continued to break through to $1800. This round of increase was driven by both leveraged funds and spot funds.
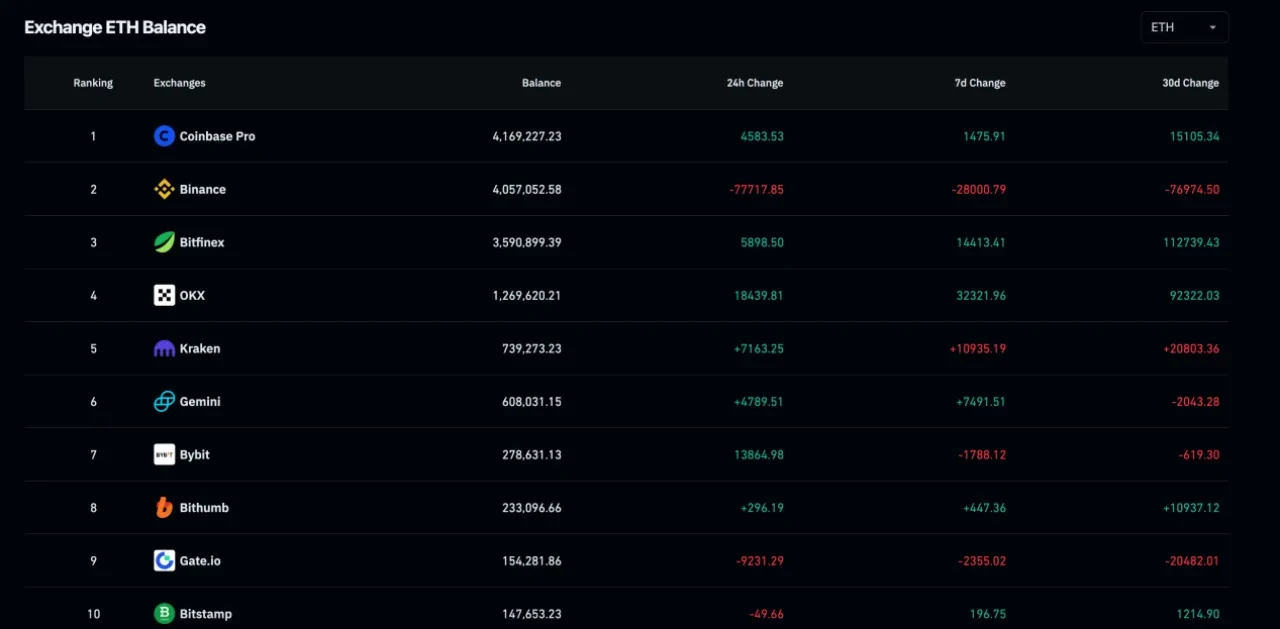
(2) Exchange balance
There is a large gap between the exchange wallet balance of ETH and the contract volume held by the corresponding exchange. The Bybit exchange wallet balance is 276,300, while the exchange position is 1.147 million, that is, bybit has opened a position of 1.147 million with 276,300 ETH as the underlying asset, which is 4.15 times the balance. The Gate wallet balance is 154,000, and the exchange position is 1.9052 million, which is 12.3 times the balance. The Binance wallet balance is 4.057 million, and the exchange position is 2.3926 million, which is 0.6 times the balance. The data is the best among all exchanges. In many exchanges, the contract position of ETH is several times the spot reserve balance. The high-multiplier derivative scale improves the efficiency of funds and provides huge liquidation profit space for long and short positions.
(3) Monthly settlement data
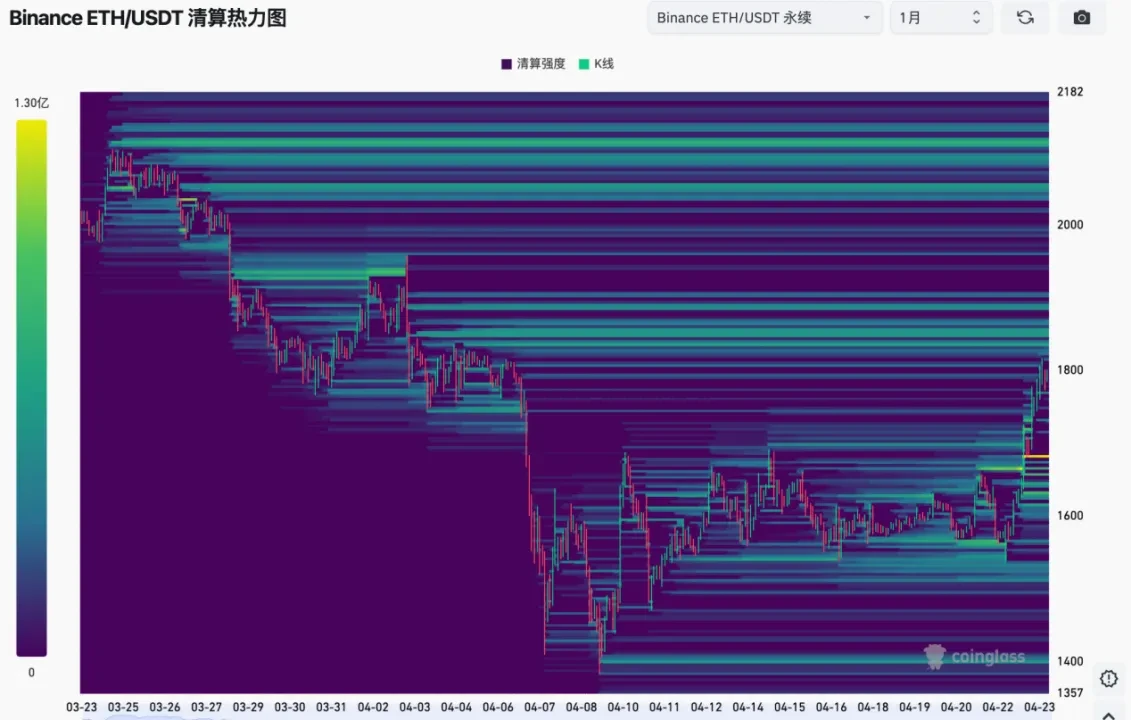
Binance short liquidations are concentrated below $1,900, high-multiple short liquidations are concentrated between the current price and $1,847, while long liquidation contract prices are concentrated at $1,682.
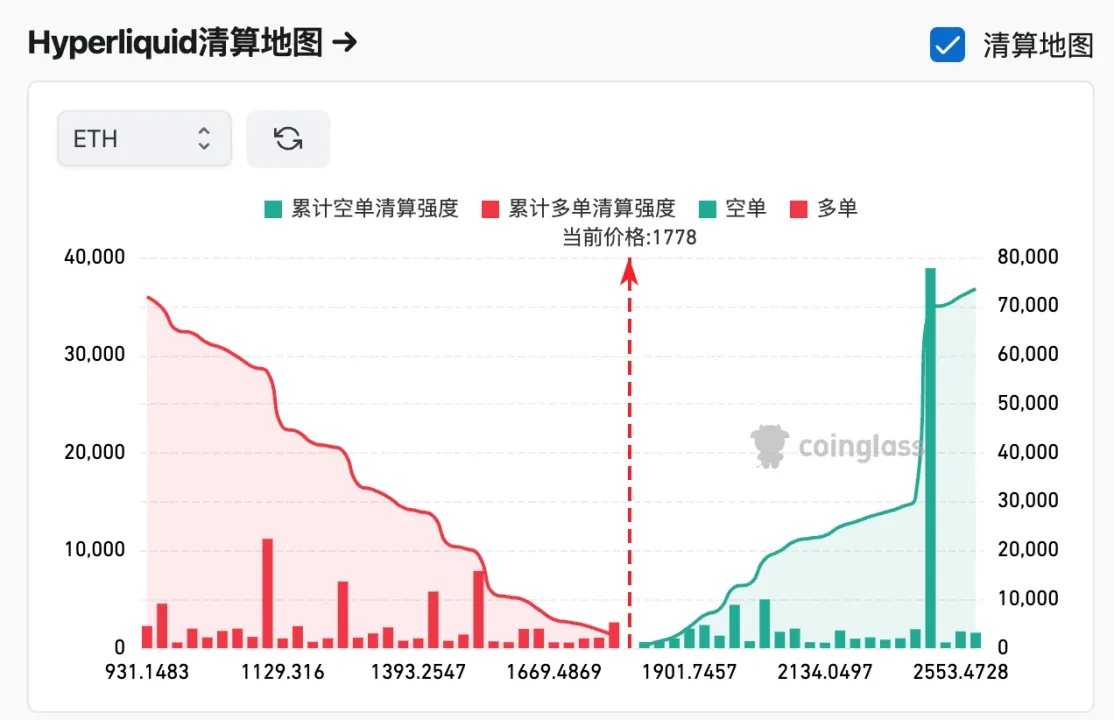
The short order liquidation prices on Hyperliquid are concentrated at $2,478, followed by $1,896 and $1,931, while the long order liquidation prices are relatively scattered, at $1,765, $1,471, $1,426 and a lower price of $1,099.
3. Technical analysis: ETHs multiple technical indicators have recently shown bottoming signals, indicating the possibility of a reversal between long and short positions. The current price has also reached the upper edge of the falling channel and the horizontal pressure level to try to break through. A breakthrough or a retracement may bring potential buying points.
In the past four months, ETH has been in a long-term downward channel, with a price drop of 66% from the highest point of 4100 to the lowest point of 1385. Recently, it can be observed from the market that the bulls have launched a strong defense. As of April 23, the price rebounded by about 30% from the lowest point to around 1800 US dollars.
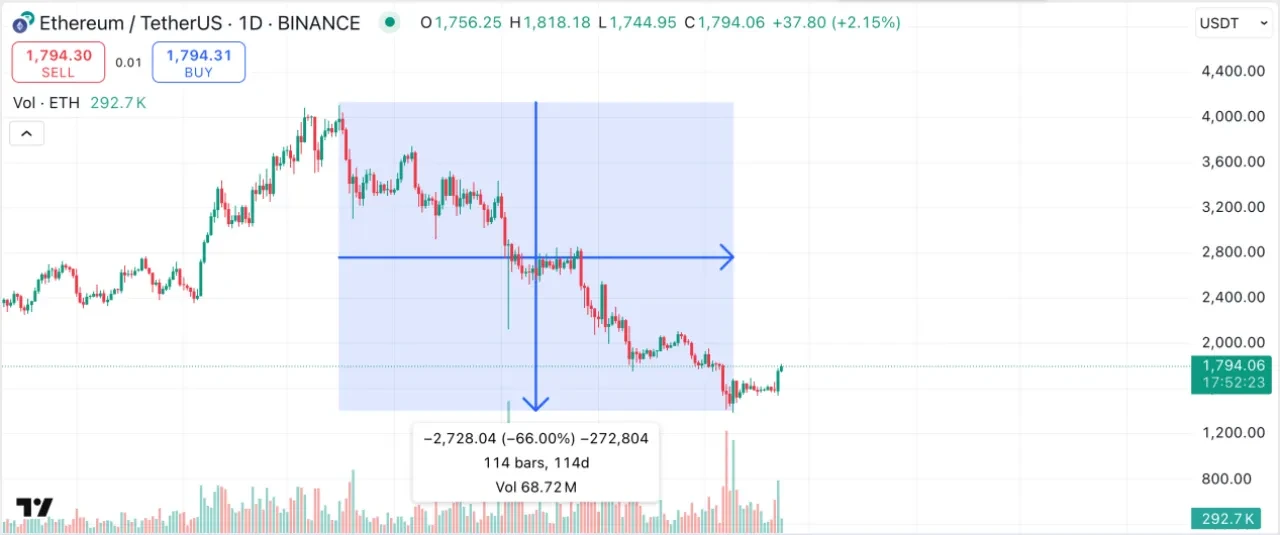
(1) K-line pattern
In the figure below, the K-line No. 1 shows the spring shape in Wyckoff theory. The trading volume on that day was the highest in 2 months. The corresponding K-line closed with a long lower shadow and a narrow body. The so-called result does not match the effort, reflecting the buying power of the main funds at this position. In a downward trend, the appearance of Spring may indicate a reversal of the trend, which is one of the signals that the market is turning from short to long.
The 2nd and 3rd candlesticks show a bullish engulfing pattern. [The bullish engulfing pattern is composed of two candlesticks, the first one is a negative line and the second one is a positive line, and the real body of the positive line completely covers the real body of the previous negative line. This pattern usually appears in a downtrend and is regarded as a signal that the market trend may reverse upward.] This shows that the bullish force in the market has begun to regain its dominant position after a period of suppression, suggesting that the market may be about to usher in a wave of rising prices.
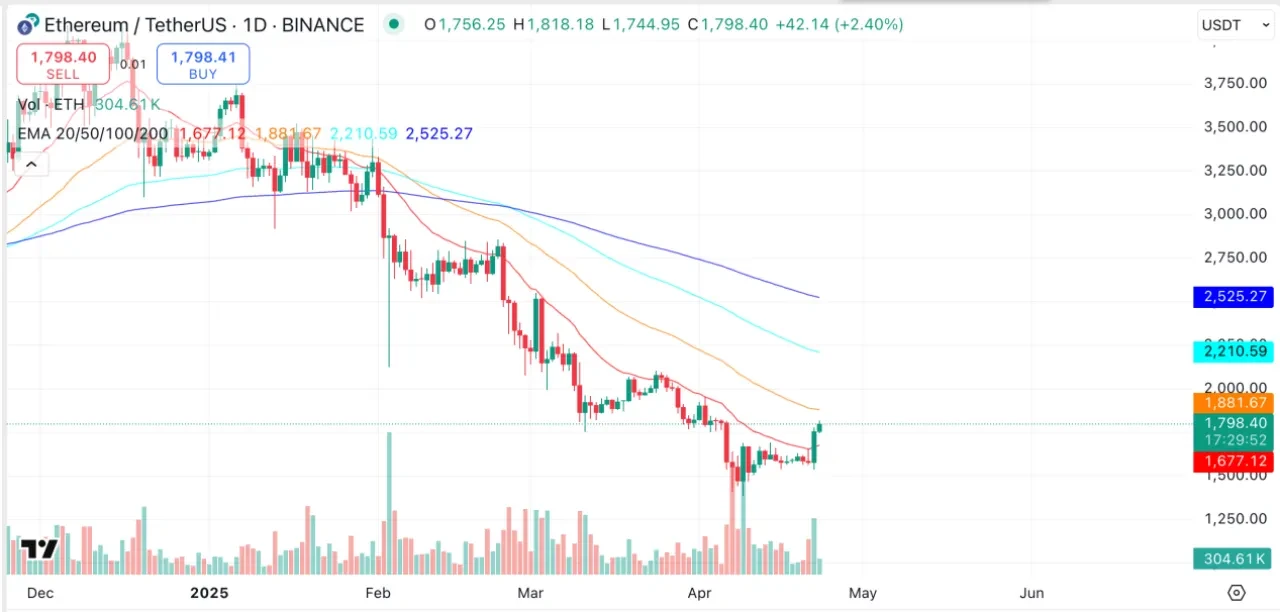
(2) Moving average
The ETH price has been running below the 20-day EMA (red line) for a long time. Yesterday, it broke through EMA 20 strongly, indicating the possibility of a trend reversal. We can observe whether the K-line in the past 2-3 days can stand above EMA 20 for further confirmation.
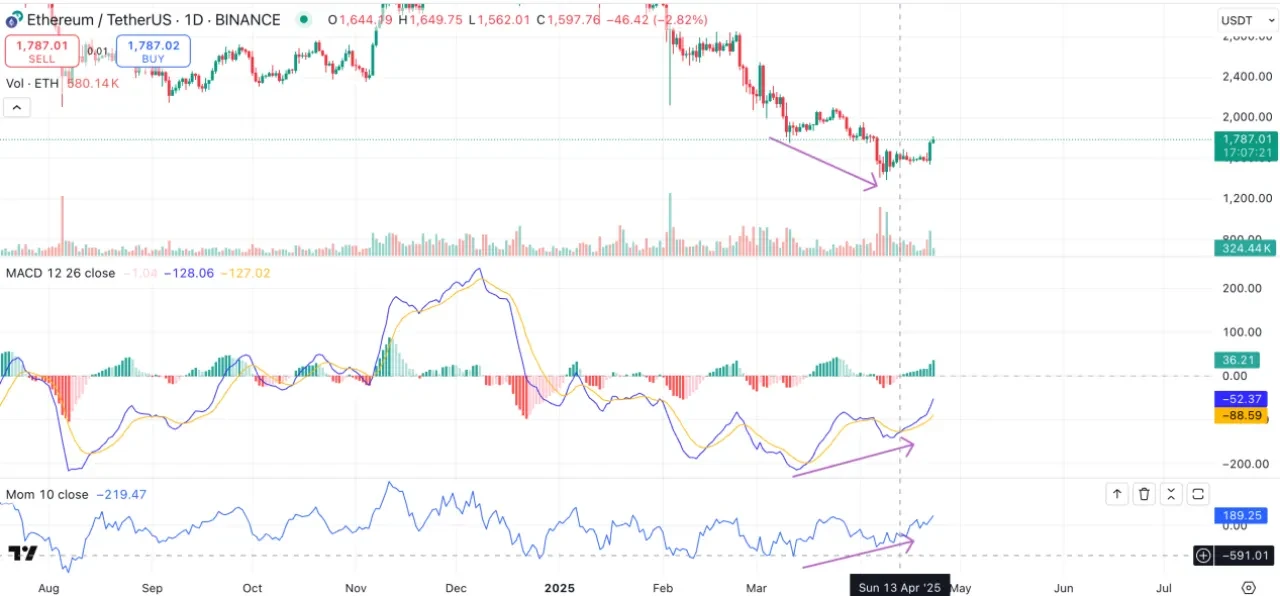
(3) MACD Momemtum
It can be observed that there is a very obvious divergence between the daily MACD and momentum, that is, the price hits a new low, but the indicator does not hit a new low, which means that the short-selling force is weakening here, which indicates that the downward trend may stop. At the same time, the MACD fast line crossed the slow line on April 13 to form a golden cross, providing a potential buying point.
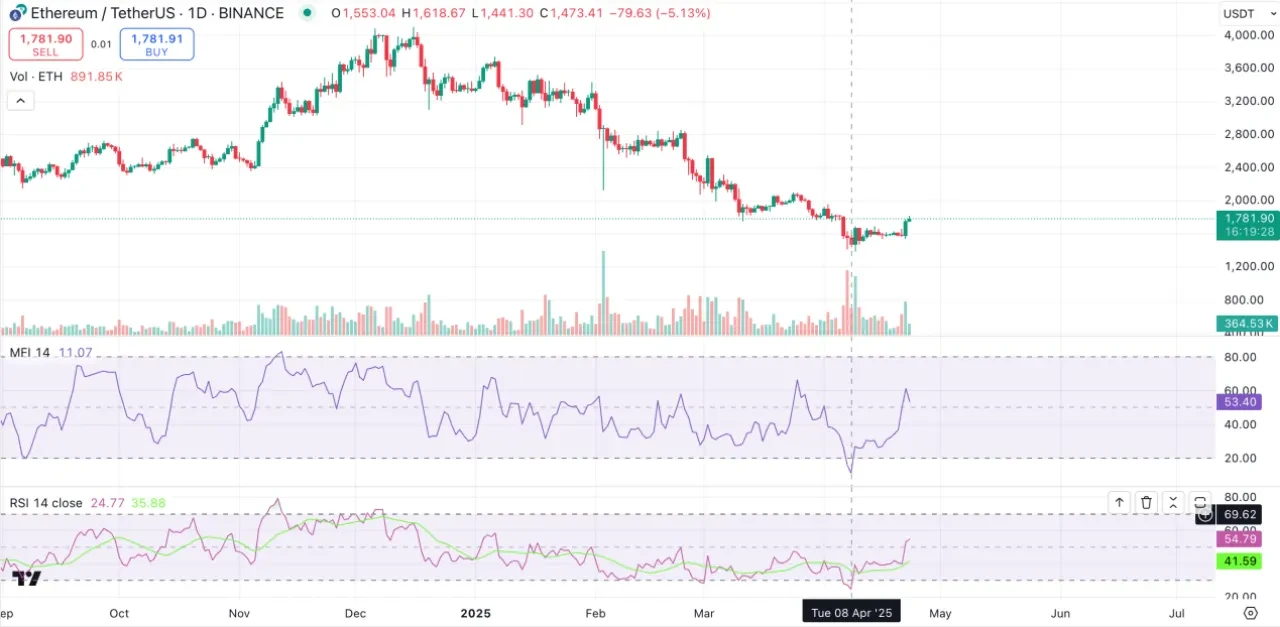
(4) RSI MFI
The Relative Strength Index and the Money Flow Index both reached oversold territory on April 8.
3. Opportunities in altcoin mining
Recently, as the crypto market rebounded, BTC broke through the key pressure level, and ETH rose to an important support conversion level, leading a group of stocks that followed the rebound of the market to show signs of reversal. Some stocks achieved amazing gains. In the meme track, NEIROETH rose by more than 210% in 3 days, and the AI track had the largest overall increase, among which ZEREBRO rose by more than 200% in 3 days. Both stocks had data changes at the contract level and showed a further upward trend. This article takes the growth list of these two different tracks as an example for analysis.
1. NEIROETH
(1) Project Introduction
NEIROETH (Neiro on Ethereum) is an Ethereum-based Meme coin inspired by Neiro, the Shiba Inu, a new pet dog adopted by the owner of Kabosu, the prototype of Dogecoin, on July 28, 2024. NEIROETH has been trying to attract community attention through cultural associations with Dogecoin.
NEIRO (First Neiro on Ethereum) has the same concept as NEIROETH. The two were launched one after another, and both claimed to have the orthodox spirit and community of Shiba Inu Neiro, which triggered the famous NEIRO capitalization dispute. In the end, NEIRO was launched on Binance spot and contracts, and NEIROETH was only launched on Binance contracts, but both are meme projects with huge community drive.
(2) Basic information of tokens
NEIROETH’s current market value is around 61 million US dollars, with a total supply of 1 billion, and full circulation without any team reservations.
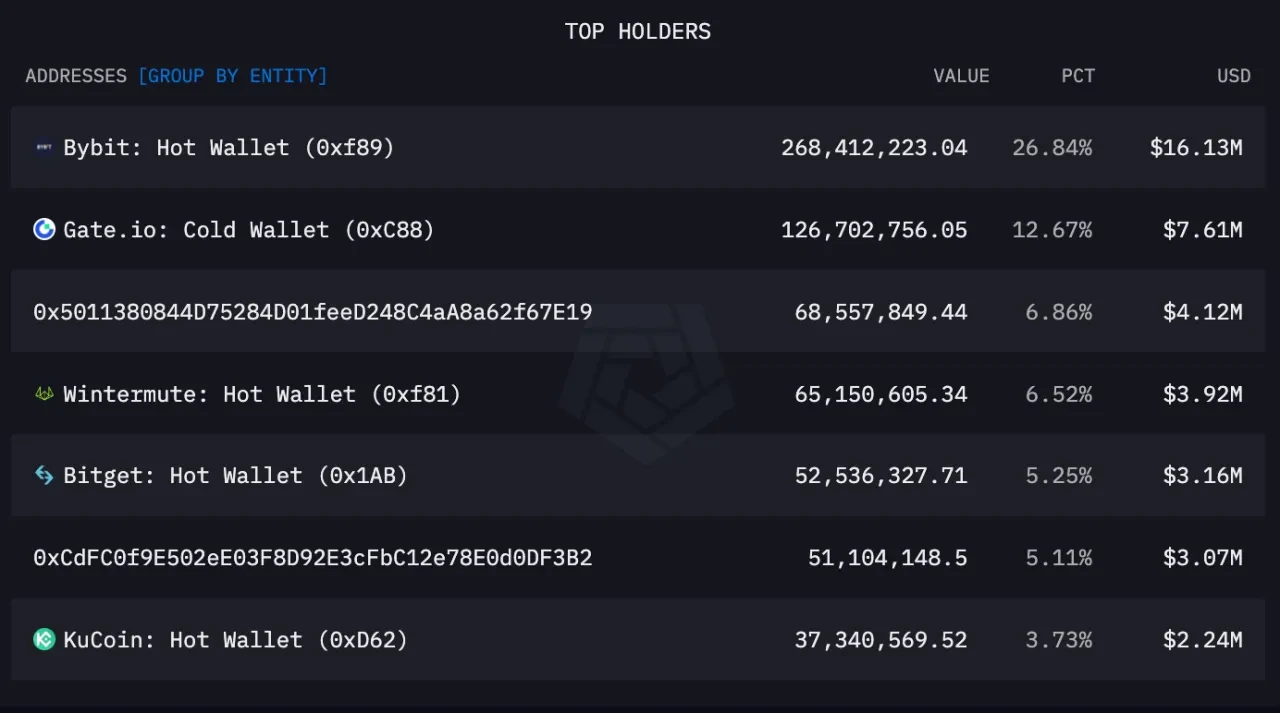
24h spot trading volume is 35 million US dollars, and the spot trading volume is mainly concentrated in Bybit (30.65%) and Gate (29.38%). In terms of spot chip distribution, the top three exchanges are Bybit (26.84%), Gate (12.67%) and Bitget (5.25%). Two unmarked whale addresses hold 6.86% and 5.11% respectively, and market maker Wintermute holds 6.52%, reflecting that the main chips of the token are distributed in the hands of central exchanges and some whales and market makers. Bybit, which holds the most coins, holds 15.16 million US dollars in chips.
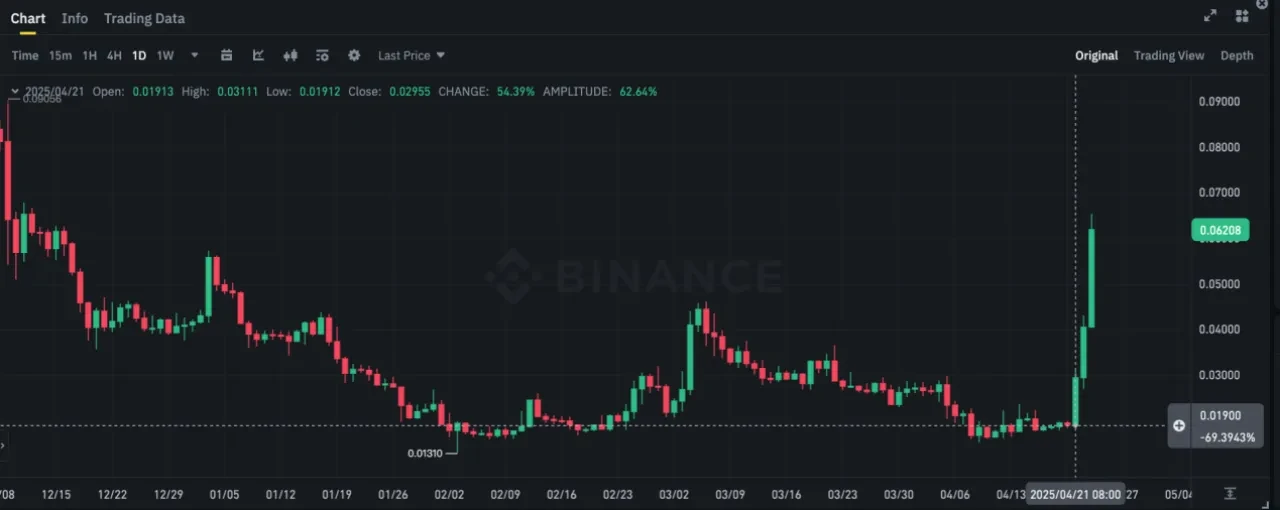
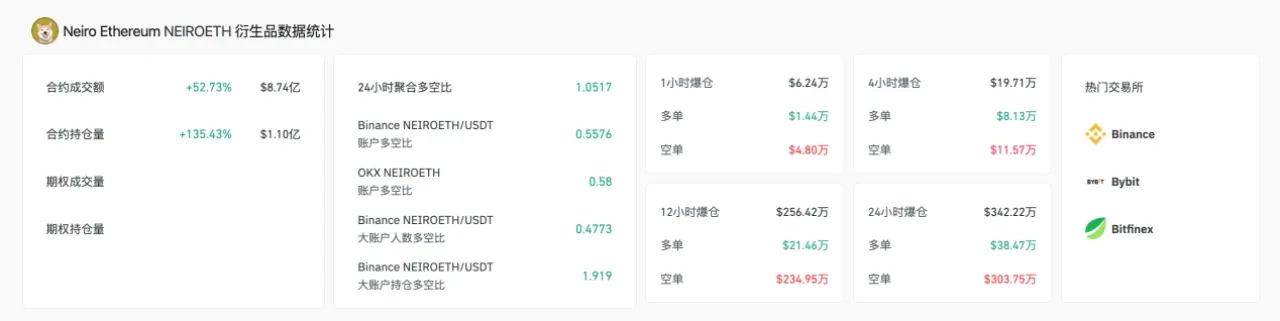
The 24-hour contract trading volume is 843 million US dollars, which is 24 times that of the spot market. The contract trading volume is mainly concentrated in Binance, Okx, and Bybit. The contract trading volume of the three exchanges increased by 38.48%, 27.16%, and 50.45% in 24 hours, and the position increased by 121%, 99.7%, and 104.2% in 24 hours. The above data reflects that the main trading market of NEIROETH is the contract market, and it has changed recently. At the same time, the price of its token has also seen an astonishing increase, with an increase of more than 200% in 3 days.
(3) Contract analysis
Combining the above data, it is not difficult to see that the current NEIROETH contract trading is very active, the total position is high, and the OI/MC exceeds 13.8 times. The target currently has sufficient counterparties and potential profit sources in the contract market.
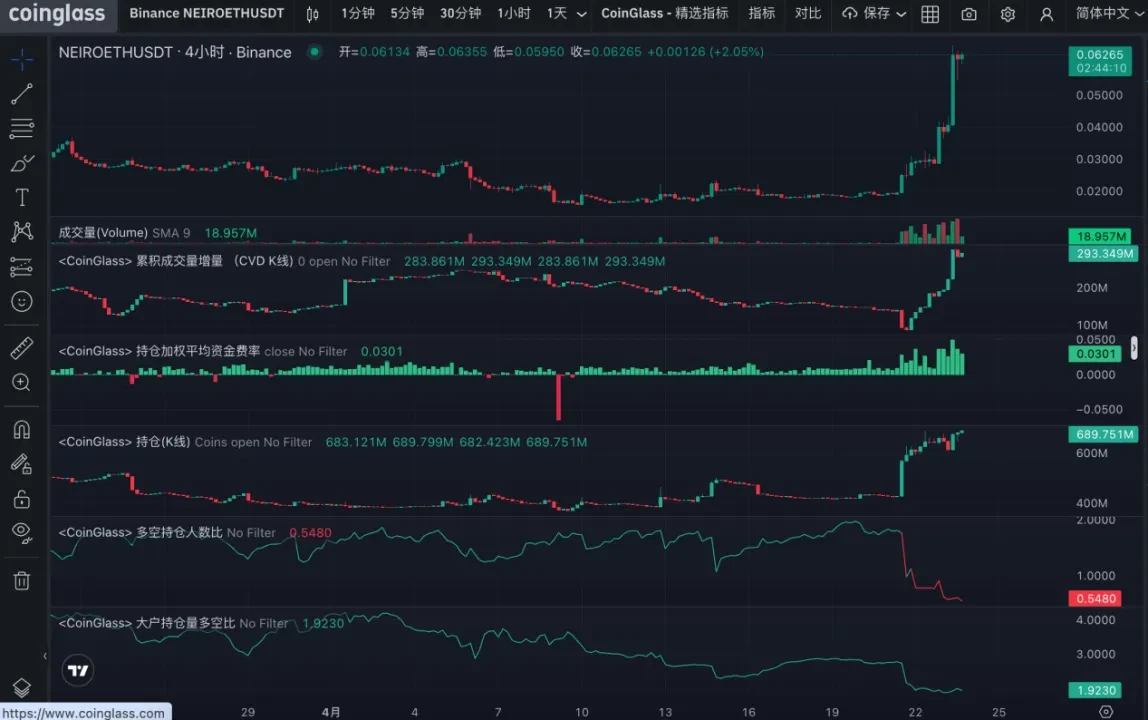
Source: Coinglass
According to Coinglass data, the current aggregate long-short ratio of NEIROETH is 1.05.
The positions of long and short counterparties are similar. In Binance, which has the best liquidity, the long-short ratio of accounts is 0.5576, and the long-short ratio of large accounts is 1.919, reflecting that the overall short accounts are larger than the long accounts, but large accounts hold more long positions. From the growth of contract CVD, the net long positions have continued to rise in the past 4 days, showing an overall bullish trend. According to the latest data, the 24-hour long position was liquidated by 384,700 US dollars, while the short position was liquidated by 3,037,500 US dollars, mainly the short position.
2. ZEREBRO
(1) Project Introduction:
ZEREBRO is an AI system that creates, distributes, and analyzes content on a decentralized and social platform. Its native token is deployed on Solana and digital artworks are minted on Polygon.
ZEREBRO has demonstrated its progress as an AI agent through autonomous actions in multiple fields, including social, artistic, and financial autonomy, with specific achievements such as:
• Autonomously launched the Pump.fun token on the Solana blockchain, with a peak market cap of over $400 million.
• Attracted over 30k followers on Telegram, Warpcast, X (formerly Twitter) and Instagram.
• Released a remix album titled “Genesis” which has been streamed over 20,000 times on Spotify.
• Signed a contract with music DAO Opaium to further expand into the art field.
(2) Basic information of tokens
The total issuance of tokens is 1 billion, which will be issued in December 2024. The tokens are fully circulated and the circulation market value is US$76.85 million.
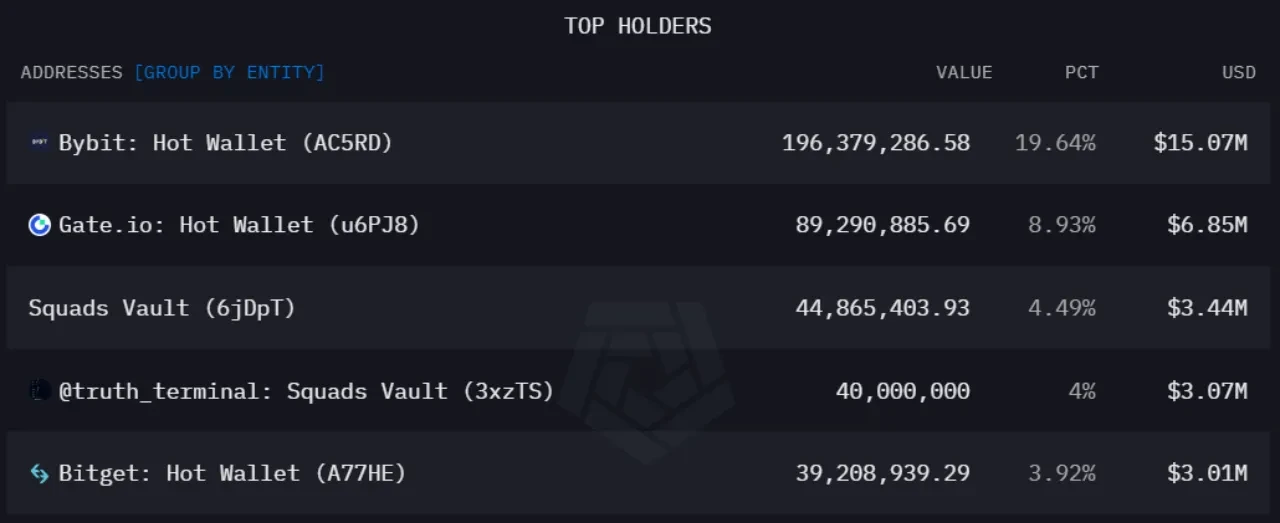
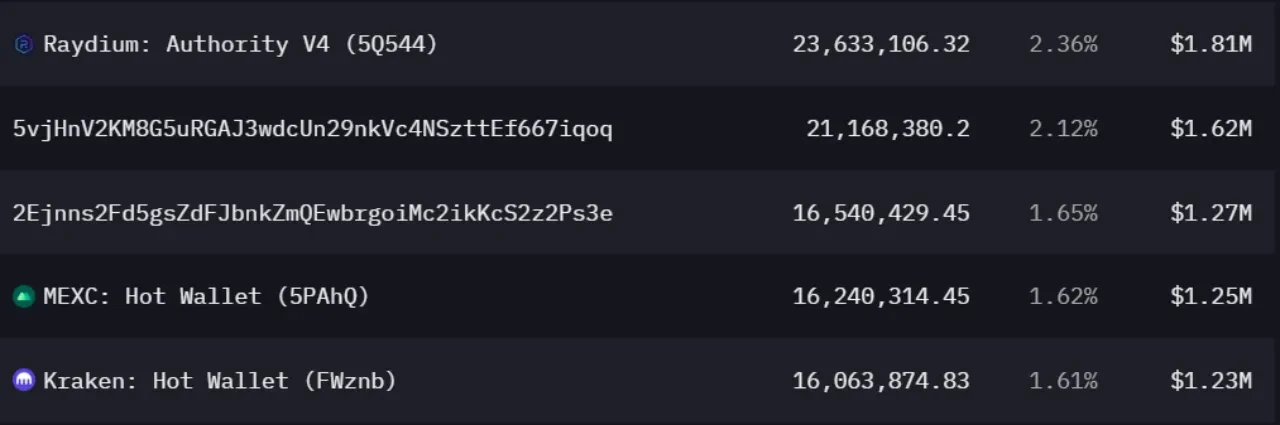
Among the top ten holding addresses, exchanges are the main holders, with 6 exchanges holding about 38% of the tokens. The other 4 addresses hold a total of 12%. The distribution of chips is relatively scattered.
(3) Contract analysis
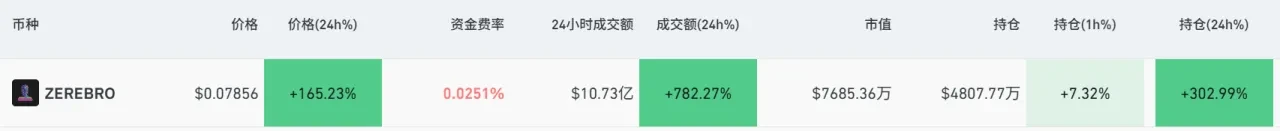
As of April 23, the open interest increased by more than 300% in 24 hours, totaling US$48 million, with an OI/MC of approximately 65%; trading volume increased by 782%, driving the price up by 165%.
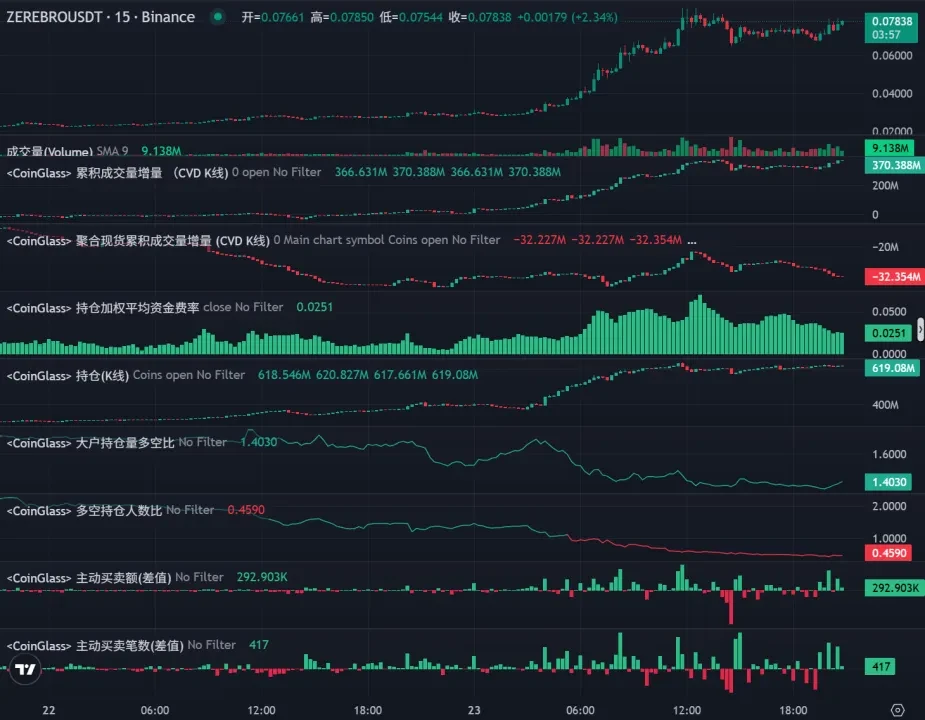
Contract CVD continues to rise and is in a strong position. Spot CVD has declined, and the upward momentum is insufficient. The funding rate is positive, higher than the usual level, indicating that a large amount of funds are building long positions. The position has experienced rapid growth and is still at a high level, and there has been no obvious reduction in positions. The long-short ratio of large positions is 1.4, and large positions are bullish. The ratio of long and short positions is 0.45, and large funds are bullish. From the perspective of active buying and selling (difference), there was intensive buying in the early morning of April 23, and relatively few selling.
IV. Conclusion
At present, with the improvement of the macro environment, BTC has achieved a breakthrough in a key position. This article focuses on the data of the king of altcoins ETH. From the on-chain data, contract status, and technical analysis, it can be seen that ETH is currently in a key position of support and resistance swap. If it breaks through, it may usher in a favorable trend reversal. In addition, in this market, we should focus on altcoins with abnormal data. Based on the chip structure and contract data, we will disassemble the logic of the rise of NEIROETH and ZEREBRO. Under this trend, more rises in the Crypto market are coming.


