


Original article fromThe Defi Report
Compiled by Odaily Planet Daily Golem ( @web3_golem )

Editors note: Bitcoins rally continued to expand this week, with a weekly increase of 10.51% and a peak of $95,768. The main reason is that Trump ended the tariff confrontation and actively negotiated with various countries (Related reading: Bitcoin breaks through the $90,000 mark, the bull market is back quickly ). The net inflow of Bitcoin spot ETFs also hit the largest single-day net inflow since Trump took office on April 22. Market sentiment generally shifted from fear to greed.
However, researchers at The Defi Report combined the on-chain momentum indicators and believed that in the short term, Bitcoin may soon usher in a correction, and the key support area is above $70,000. If the support level can hold, the bull market will continue. If it falls below $70,000, the downward trend will continue. Of course, they also believe that if the price of Bitcoin remains stable at $95,000, it will set a new record high.
However, in the long run, as the US budget deficit grows and global inflation rises, non-sovereign hard currencies such as gold and Bitcoin will become the first choice for investors. Odaily Planet Daily compiles its views on the short-term and long-term prospects of Bitcoin and the crypto market as follows, enjoy~
Momentum Indicators and On-Chain KPIs
After falling to a “death cross” on April 7, Bitcoin has now broken through all key moving averages. How Bitcoin performs from here will provide some key information, allowing us to judge whether we are now entering the long-term bull cycle that everyone is looking forward to, or whether the long-term downward trend will continue.
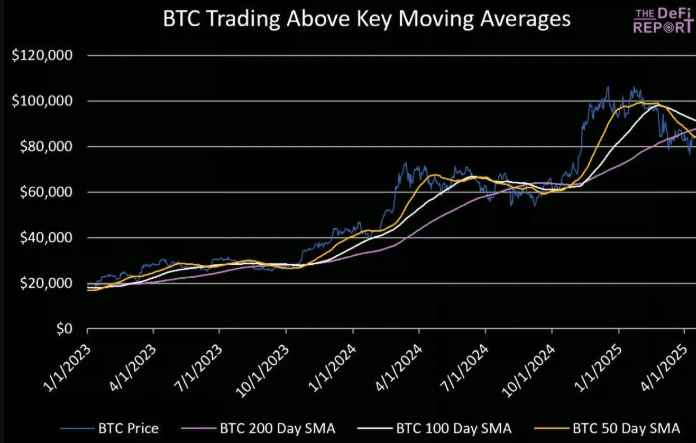
We expect the price of Bitcoin to still pull back at some point. At that point, we expect Bitcoin to fall to a slightly higher low than the previous low (above $76,000), and if Bitcoin falls to a lower low (below $76,000), we expect support above $70,000. If the support level holds, the bull run will continue. If it falls below $70,000, it will further confirm that Bitcoin is in a left cycle and the downtrend will continue.
If the price of Bitcoin breaks through $95,000 and remains stable, it will set a new all-time high.
In order to determine what the next market situation will be, we delve into the Bitcoin KPI data to see if we can find some clues to predict the next trend of Bitcoin.
ETF Inflows
In February and March, Bitcoin spot ETFs saw net outflows of $3.8 billion, and another $600 million in the first three weeks of April. However, there was a sharp reversal of trend on April 22, with net inflows exceeding $1.54 billion, the largest single-day net inflow since Trump took office. We are watching to see if this trend can continue, as Bitcoin cannot return to its all-time highs without the participation of the U.S. market and ETF inflows.
Spot Trading Volume
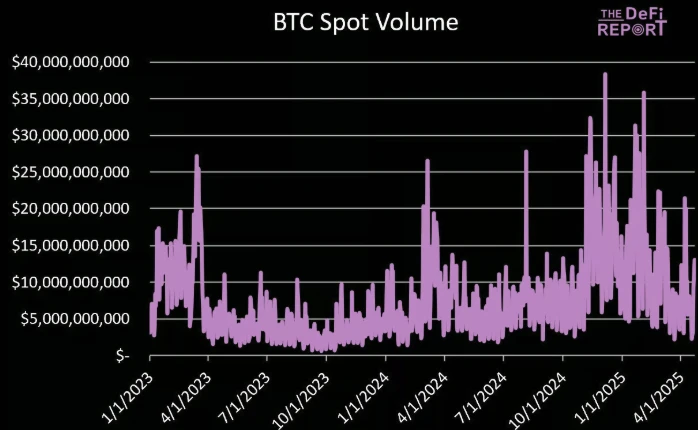
Data: Glassnode, DeFi Report
Bitcoins average daily trading volume in April was $8.7 billion, comparable to the level at the start of the bull run in early 2023. During the rally on April 22, trading volume reached $13 billion, but it was still less than half of the high-volatility daily volume. In addition, the average number of active addresses in April fell by 22% compared to November and December last year.
That being said, investors should recognize that Bitcoin and cryptocurrency markets in general are reflexive in nature. Prices tend to move first, and on-chain activity moves later, so on-chain activity can change quite suddenly.
Short-term holders are selling
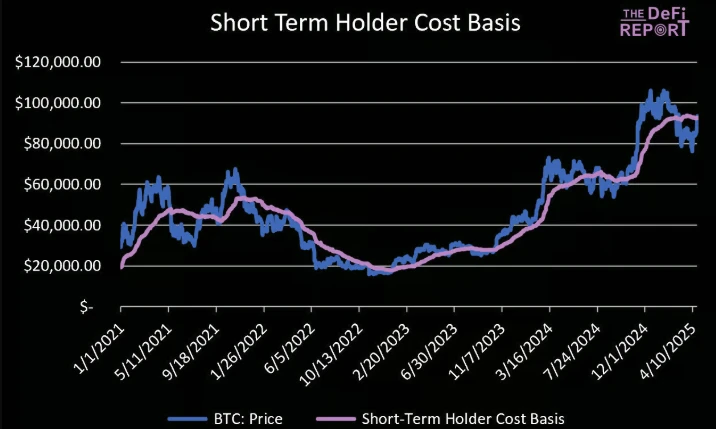
As shown in the above chart, Bitcoin has hit the cost base for short-term holders ($92,500). This is a key support level that coincides with Bitcoin’s key moving averages.
Long-term holders created support and set the stage for new all-time highs, but short-term holders are largely responsible for late-cycle volatility. Therefore, we are closely watching the on-chain behavior of this group as their holdings recover and become profitable.
Since the beginning of February, short-term holders have seen a 11.4% decline in their Bitcoin holdings. In the chart below, we can see a significant rise in the amount transferred to exchanges on April 22 and 23, totaling $4.4 billion. This is not a good sign, as it suggests that “paper hands” are selling. This situation is similar to the early days of the bear market in March 2022, when the price of Bitcoin briefly recovered to the cost basis level of short-term holders (after selling off from the high of $69,000). Therefore, this is a sign that the bear market may continue until the end of the year.
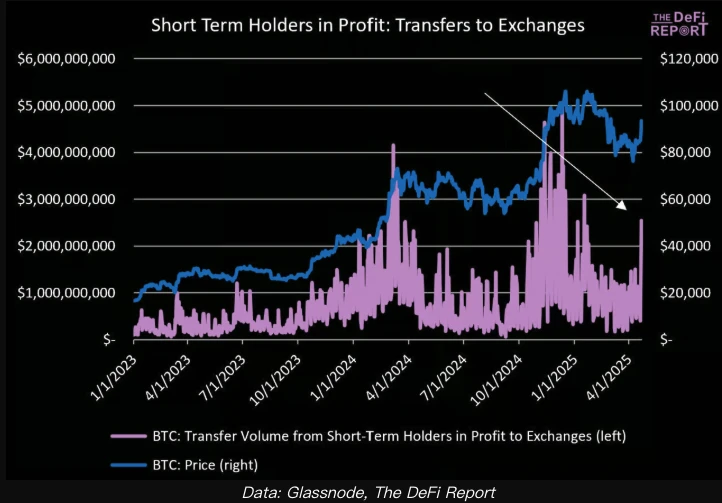
Data: Glassnode, DeFi Report
Long-term holders are still buying
Can long-term holders withstand the selling pressure of paper hands? In the figure below, we can see that long-term holders are returning to the market as buyers. They currently control 69% of the Bitcoin supply in the market, up from a low of 66% on February 1, 2025.
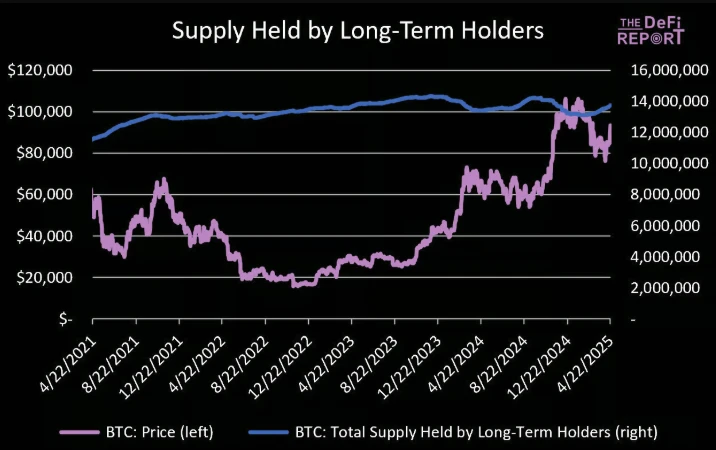
Looking back at history, the changes in the proportion of Bitcoin long-term holders are as follows:
At the peak of the 2017 bull run, long-term holders held 51.6% of the Bitcoin supply;
At the bottom of the 2018 bear market, long-term holders held 67.3% of the Bitcoin supply.
At the peak of the 2021 bull run, long-term holders held 69% of the Bitcoin supply (the second peak), and at the first peak, this proportion was 58.9%;
At the trough of the 2022 bear market, long-term holders held 69.5% of the Bitcoin supply;
At the peak in December 2024, long-term holders held 67.3% of the Bitcoin supply.
Our interpretation of this is that the current increase in long-term holder concentration is building a solid foundation for the market. That being said, we believe that these data are always influenced by ETFs, as many retail investors are buying Bitcoin through ETFs.
Supply ratio of long-term holders to short-term holders
It is clear that short-term holders are selling their Bitcoin to long-term holders. In the chart below, we can see that as the price peaked in December-January, the ratio seems to have bottomed.
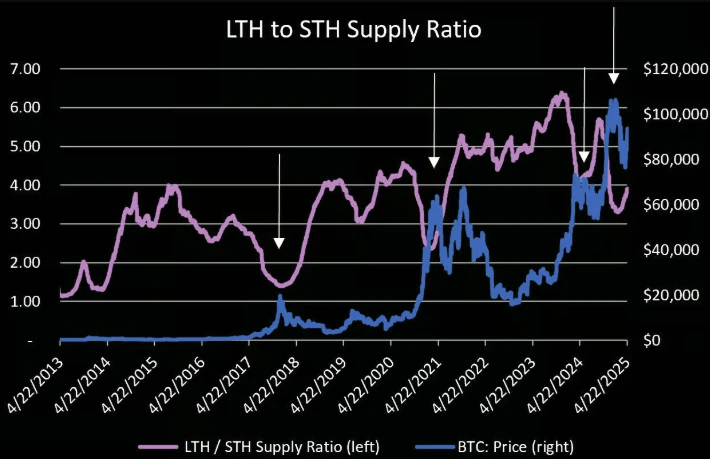
This is worrying because it often marks a (local) top in the cycle, for example in December 2017, April 2021, March 2024 and December 2024.
That being said, Bitcoin did see a “double top” in the last cycle, which was driven primarily by long-term holders. The ratio bottomed out at the first peak in March 2021 and topped out at the second peak in November 2021 (the second peak was driven by long-term holders).
This could also happen this year, and if so, Bitcoin’s second peak could be in the $110,000 to $130,000 range.
USDT supply has not increased significantly
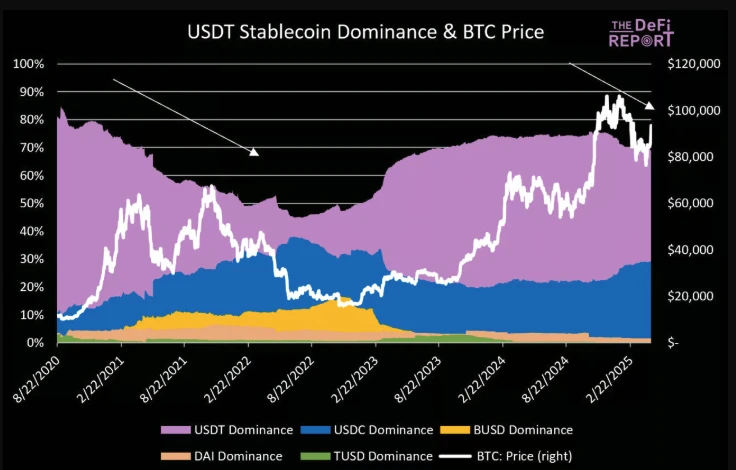
The price of Bitcoin tends to grow in direct proportion to the circulating supply of USDT (and its dominance).
It is worth noting that the supply of USDT has been hovering around $140 billion since mid-December last year. At the same time, the supply of USDC is increasing (up 47% since mid-December last year). This is similar to the situation in the previous cycle, where the supply of USDC increased significantly during the bear market and then fell back at the end of the third quarter of 2022.
Funding Rate
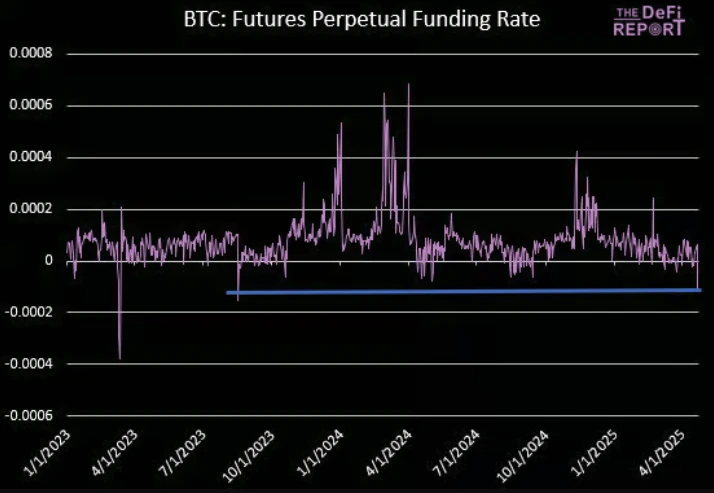
Bitcoin funding rates fell to negative values on April 22 as short sellers bet that Bitcoin will fall near $94,000. To maintain their positions, short sellers are paying the most since August 2023. This has shown the stance of traders and speculators, but a short squeeze is also possible, and Bitcoin prices could rise above $100,000 in the short term.
MVRV-Z Score Analysis
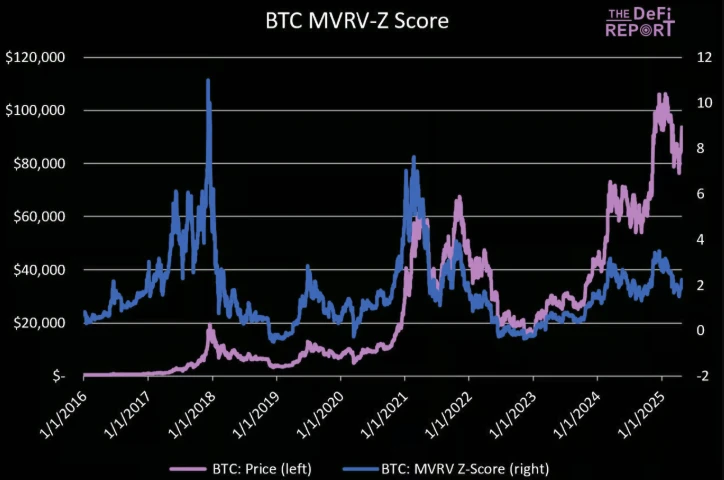
Bitcoins MVRV-Z score is currently 2.2. This analysis uses z-scores to normalize data across time periods and market structures. A z-score of 2.2 means that BTC is currently trading 2.2 standard deviations above its mean. Since January 1, 2017, it has been below this level 70% of the time and above this level 30% of the time.
We analyzed the periods when the MVRV-Z Rating fell below 2 during the uptrend and isolated the instances when it fell below that level for the third time or more in 18 months (as we are seeing now). Here are the returns for those periods.
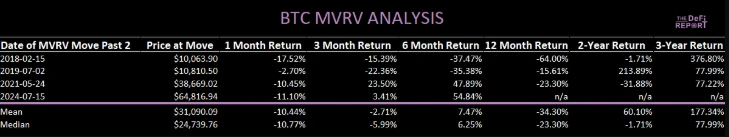
All of the above examples have negative 12-month returns. For completeness, we include all cases where the MVRV was greater than 2 since January 1, 2017:
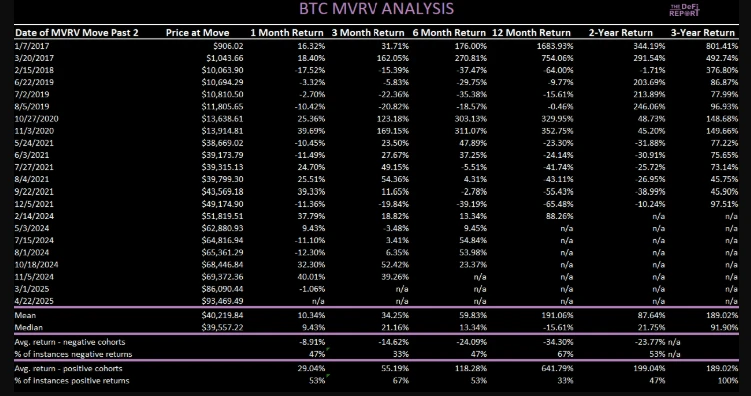
Average 1-month return: 10.34%, with positive returns in 53% of cases.
3-month average return: 34.25%, with positive returns in 55% of cases.
6-month average return: 59.83%, with positive returns in 53% of cases.
Average 12-month return: 191% (84% if January 7, 2017 is excluded), but only 33% of cases have positive returns.
Generally speaking, buying when the MVRV-Z score breaks out above 2 can yield strong returns, but historically these results have typically occurred at the beginning of the cycle (early 2017, late 2020).
Summary: The bull market trend is still unclear
On-chain activity has been trending downward over the past three months. This is not only true for Bitcoin, but also for Ethereum and Solana.
In the chart below, we can see that APAC/China was the driving factor for most of this week’s moves, despite significant ETF inflows on Tuesday, April 22 (not included in the chart below). This is a positive sign, but we strongly believe that Bitcoin cannot resume its bull market structure without significant participation from the US market.
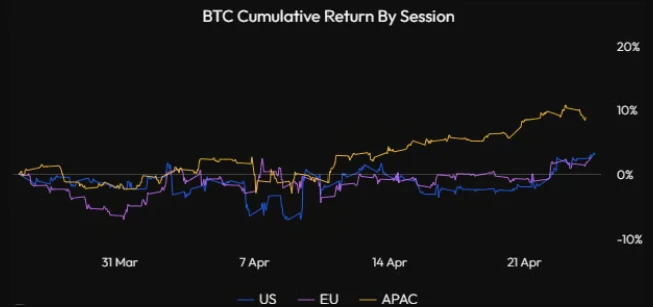
Stats: Velo
Stablecoin growth is starting to wane, with USDT supply hovering around $140 billion over the past four months. In the past, we’ve seen a correlation between slower USDT stablecoin supply growth and periods of volatility/consolidation in BTC.
The ratio of long-term holders to short-term holders is a key focus. As mentioned earlier, long-term holders tend to lay the bottom/foundation for Bitcoins trend, but strong entry by short-term holders can push prices to new all-time highs, but it is difficult for us to see this happening at the moment. A longer period of shock/consolidation will create a healthier environment for a new wave of funds to flow into Bitcoin.
MVRV-Z score analysis shows mixed short-term return results, but the outlook is more positive over the next two to three years. We prefer to buy Bitcoin when the score approaches 1, not now.
We acknowledge that our analysis is based on the past, and investors should understand that due to the reflexive nature of the cryptocurrency market (prices tend to move first, driving narratives and on-chain activity), the market is changing rapidly. Finally, please note that our on-chain data analysis does not include ETFs or Bitcoin on centralized exchanges (~18.7% of supply).
The market will fall in the short term
As global capital withdraws from the US market, there has been a lot of discussion about Bitcoin decoupling. We do not agree with this statement, but not because we do not think Bitcoin will decouple, but because Bitcoin and the Nasdaq are generally uncorrelated (since January 1, 2017, the average correlation coefficient is 0.22 and the median is 0.23).
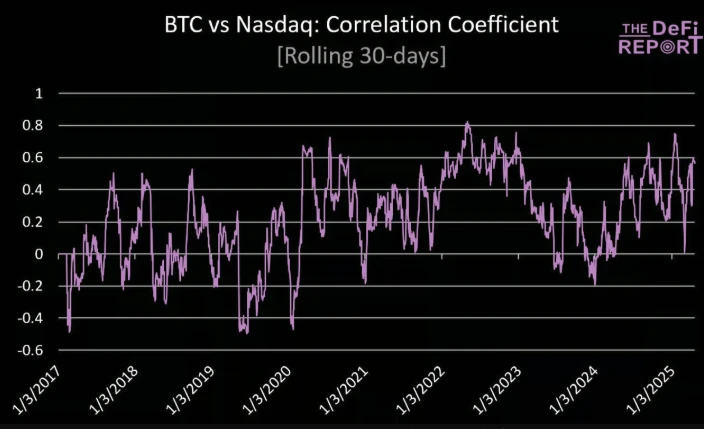
Bitcoin and Nasdaq correlation coefficient
That said, Bitcoin’s correlation with the Nasdaq is still up this year (0.47), and the correlation tends to rise when the Nasdaq is under pressure (since 2017, the correlation has jumped to 0.4 when the Nasdaq has fallen 2% or more). This may not change as the Nasdaq continues to fall.
Despite the continued pullout of risk assets, the market is still trading at 19 times forward earnings. Here’s how it compares to the troughs of the past four major corrections:
1. 2022 bear market: 15x. Equivalent to the SP index of 4,248 today.
2. COVID-19: 13 times. Equivalent to the SP index of 3,682 today.
3. Financial crisis: 17.1 times. Equivalent to the SP 500 index of 4,815 today.
4. Internet bubble: 20 times. Equivalent to the SP 500 index of 5,665 today.
Analysts cut earnings estimates by 2.2% during the pandemic, 4.2% during the 2022 bear market, 64% during the global financial crisis, and 38% during the dot-com bust. So far, however, earnings estimates have been cut by just 0.3%.
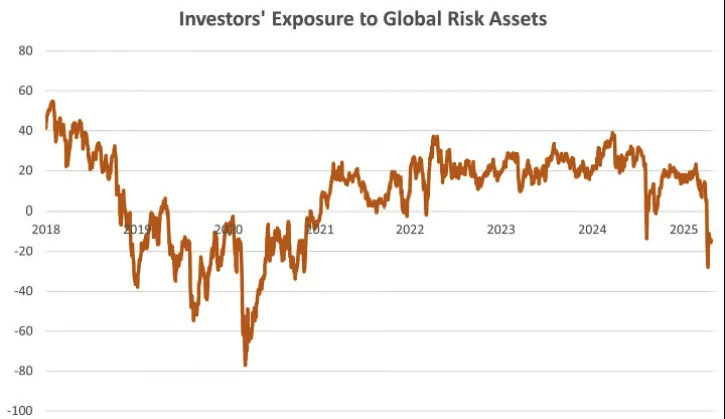
Data: Cross-border capital
But the current situation in the United States is no better than before:
Premature layoffs in the US have surpassed levels seen during the financial crisis (mostly government layoffs), which have not yet been reflected in labour market data;
The survey showed that soft data such as the Philadelphia Fed Manufacturing Index, Housing Starts, Philadelphia Fed New Orders, Container Ship Bookings, and Los Angeles Port Trade were all weak;
The Atlanta Fed predicts negative growth in the first quarter;
The Fed remains on hold (5% chance of a rate cut in May);
Tariff negotiations are complex, will take longer than the market expects, and could further escalate tensions/increase rhetoric.
In summary, we think the Trump administration is doing everything in its power to gradually push down the stock market (to push down the dollar and interest rates), and the economy has probably already been hurt. Therefore, we think the next leg down is likely to come when hard data starts to come out.
On the other hand, markets have the potential to weather uncertainty if the following conditions are met:
The tariff agreement is progressing faster than expected;
The bond market remains stable with no serious problems;
The Trump administration has successfully redirected the markets attention to the tax cuts and deregulation they are currently pursuing.
Bitcoin’s long-term outlook remains positive
But in the long term, the outlook for Bitcoin and cryptocurrencies as a whole is very positive.
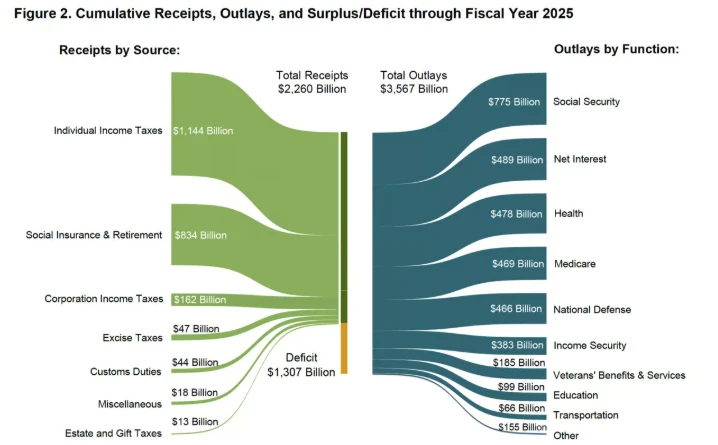
Data: U.S. Treasury. Fiscal 2025 deficit is $1.3 trillion as of March and is expected to rise to $1.9 trillion
The US budget deficit is growing, not slowing down. With Elon Musk announcing he will leave the White House in May, it’s clear that the Government Efficiency section (DOGE) is just a political farce targeting small fry.
Treasury departments will likely continue to play a major role in providing liquidity, and not just in the US (as we have seen over the past few years), but also in Europe where fiscal spending is increasing to pay for defense and infrastructure. We think the Fed will start expanding its balance sheet again in Q3/Q4.
As the situation becomes clearer, we expect to see monetary repression/yield curve control around the world and rising inflation. In this environment, investors will favor non-sovereign hard currencies such as gold and Bitcoin over stocks.
Risk Management and Conclusion
We like to wait for the “big pies” that fall from the market, and we are happy to hold cash until we see them.
Buying Bitcoin and other assets (such as SOL) at the low point in 2022 is a falling pie. Increasing investment in Bitcoin (including Meme configuration) before the interest rate cut and expected Trumps victory in September last year was also a pie. We also believe that changing the portfolio to cash-based in December-January last year was also a pie. (Odaily Note: Bitcoin broke through $100,000 in January 2025 to set a record high, and then fell)
So, is it a big pie opportunity to buy cryptocurrencies at the bottom now? For us, the answer is no. Although we are still optimistic about the long-term trend of Bitcoin, we also like to keep it simple.
If you believe we are in the midst of a structural reset of the global trade and monetary system (as we do), then you can ignore Trump’s rhetoric and try to find buy signals amid the noise from Bessant et al. But we think it will take a long time to see the results, and at this point we are not even through the end of the first inning.
The Fed is currently doing nothing, so we can safely hold long-term Bitcoin while maintaining sufficient cash reserves. We may miss some upside opportunities in the short term, but we dont mind.
Everyone needs to act within their comfort zone and risk tolerance. Cash is also a position, and given the ample opportunities in the cryptocurrency space, we can be patient.


