


Preface
This quantitative biweekly report (April 25 to May 12) analyzes the market trends of Bitcoin and Ethereum, and comprehensively uses indicators such as long-short ratio, contract holdings, and funding rates. The quantitative section discusses the application of the moving average intensive breakthrough strategy in the ETH/USDT market, covering its logical architecture and signal determination mechanism. Through systematic parameter optimization and backtesting, the strategy is robust in trend identification and risk control, with clear execution discipline, and is overall better than simply holding ETH, providing a practical framework for quantitative trading.
summary
• In the past two weeks, BTC and ETH have risen simultaneously, with BTC increasing by about 34% and ETH increasing by more than 60%.
• The long-short ratio of ETH fluctuates violently, indicating that the rise of ETH is accompanied by strong short-term trading and market speculation, and the shorts have not obviously exited the market.
• The increase in BTC contract open interest was relatively slow, while ETH saw a stronger rise in early May.
• The overall contract market short positions were liquidated in early May, and long positions were liquidated on May 12, reflecting the intensification of market divergence under high leverage.
• The quantitative analysis adopts the “moving average intensive breakthrough strategy”, and under the optimal parameter selection, the yield rate is as high as 127%.
Market Overview
1. Analysis of price volatility of Bitcoin and Ethereum
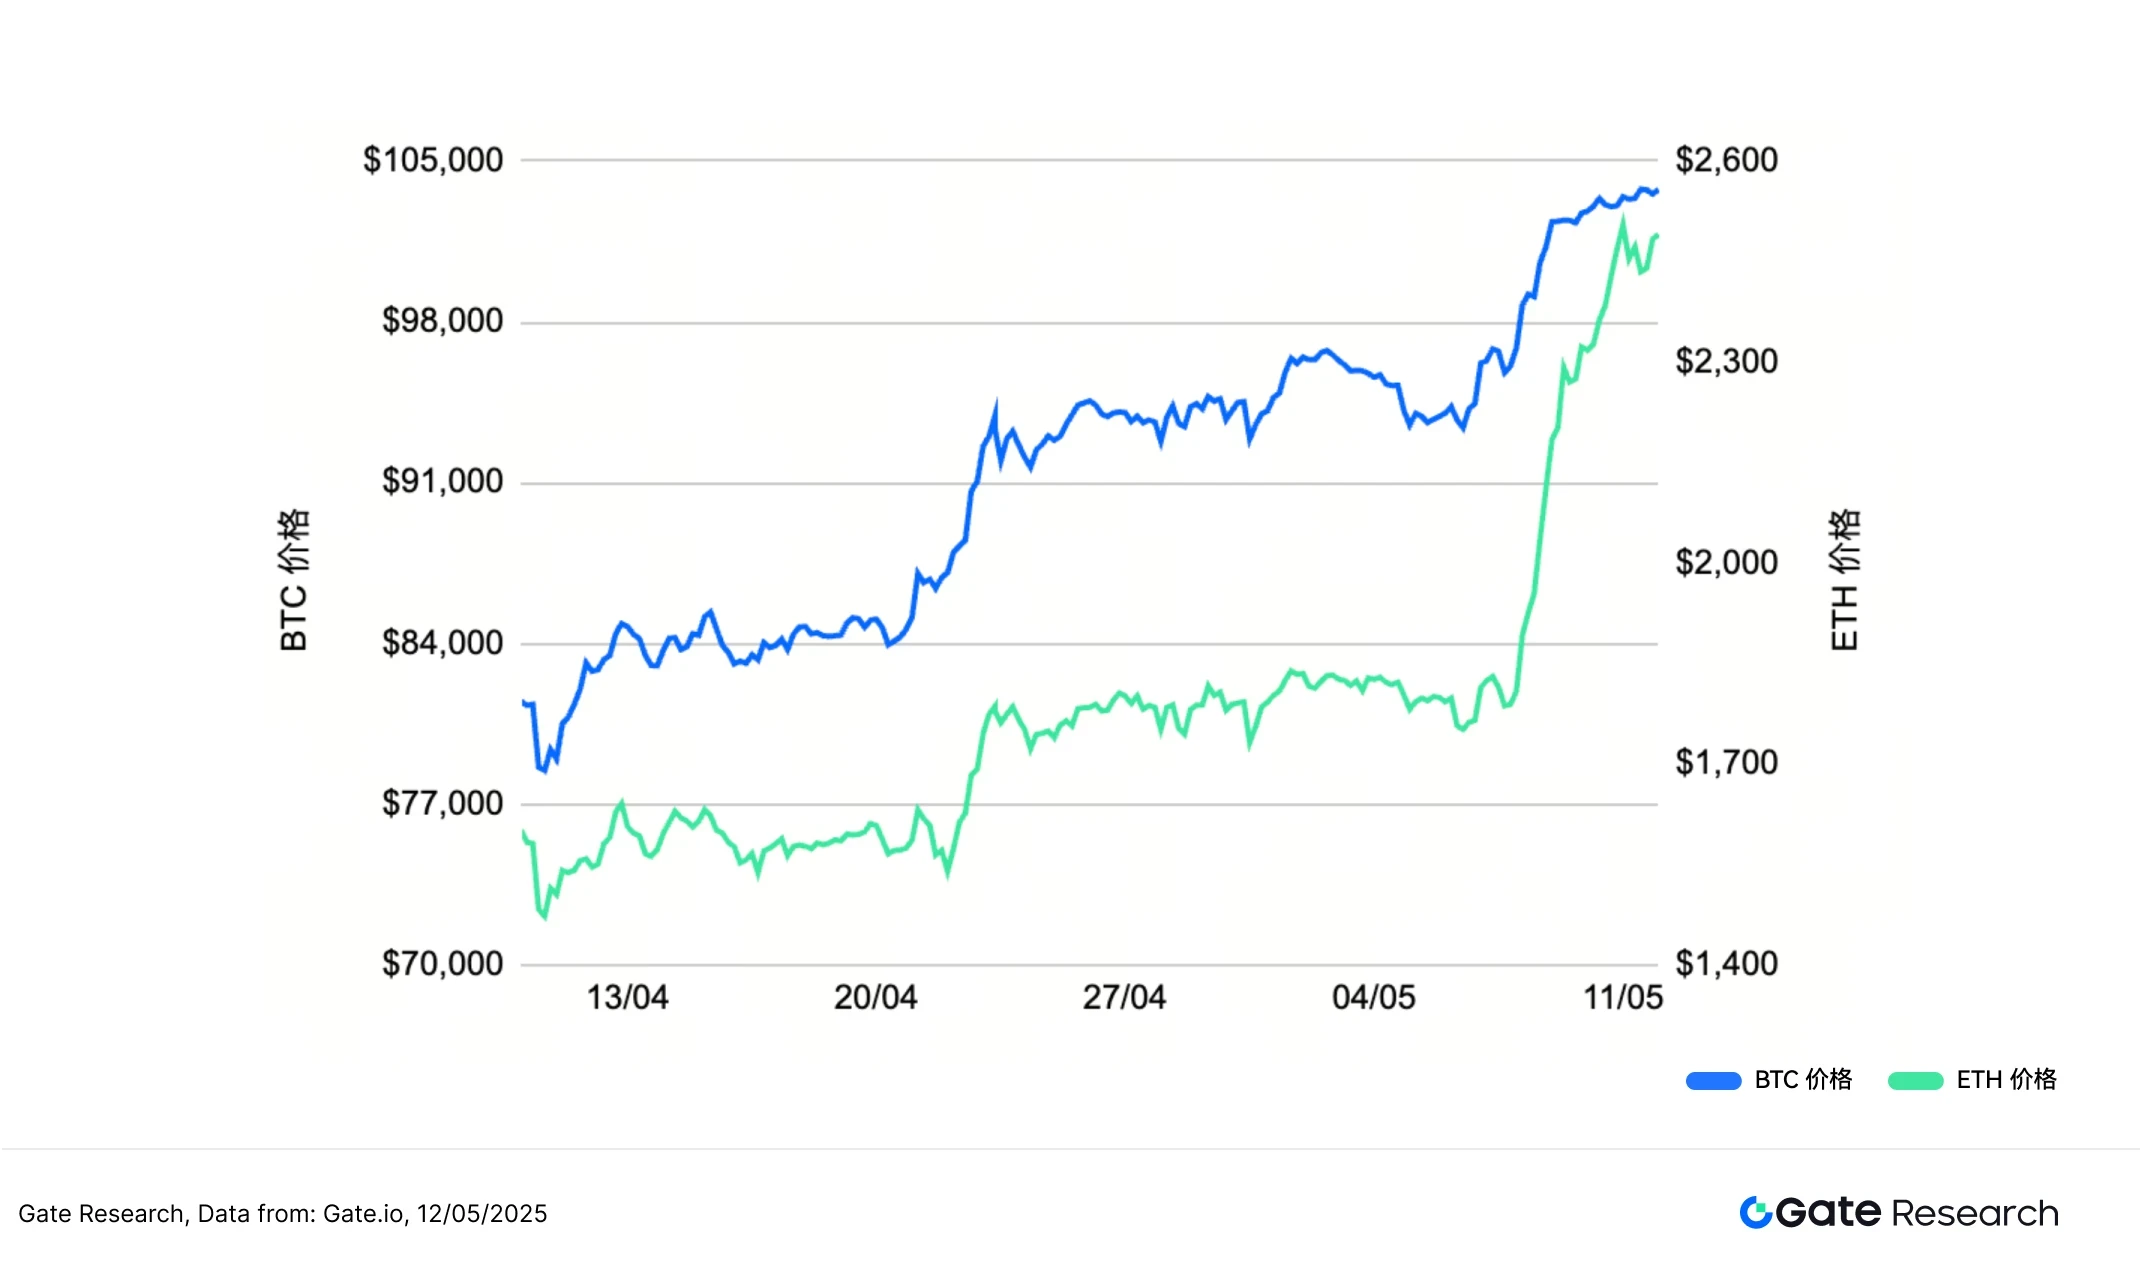
BTC and ETH have been showing a steady upward trend since mid-April, and have maintained a relatively consistent upward rhythm until early May. During this period, BTC rose from about 78,000 USDT to nearly 105,000 USDT, while ETH rose sharply from about 1,600 USDT to around 2,600 USDT. It can be seen that ETHs increase is significantly higher than BTC, showing stronger price elasticity, especially in early May, when both of them jumped simultaneously. It is possible that with the easing of tariff policies, BTC has also experienced a wave of recovery. BTC has a higher price, smaller volatility, and a relatively stable trend; ETH has a larger increase and a faster reaction. The market originally lacked positive expectations for ETH and its performance was relatively lagging behind, but after entering May, with the approaching Pectra upgrade and the easing of tariff policies, ETH increased in volume. This round of changes reflects the markets renewed attention to the allocation value of ETH in the short term. [1] [2]
Figure 1: BTC price rose to nearly 105,000 USDT, while ETH rose sharply to around 2,600 USDT. The increase and reaction speed were more dramatic.
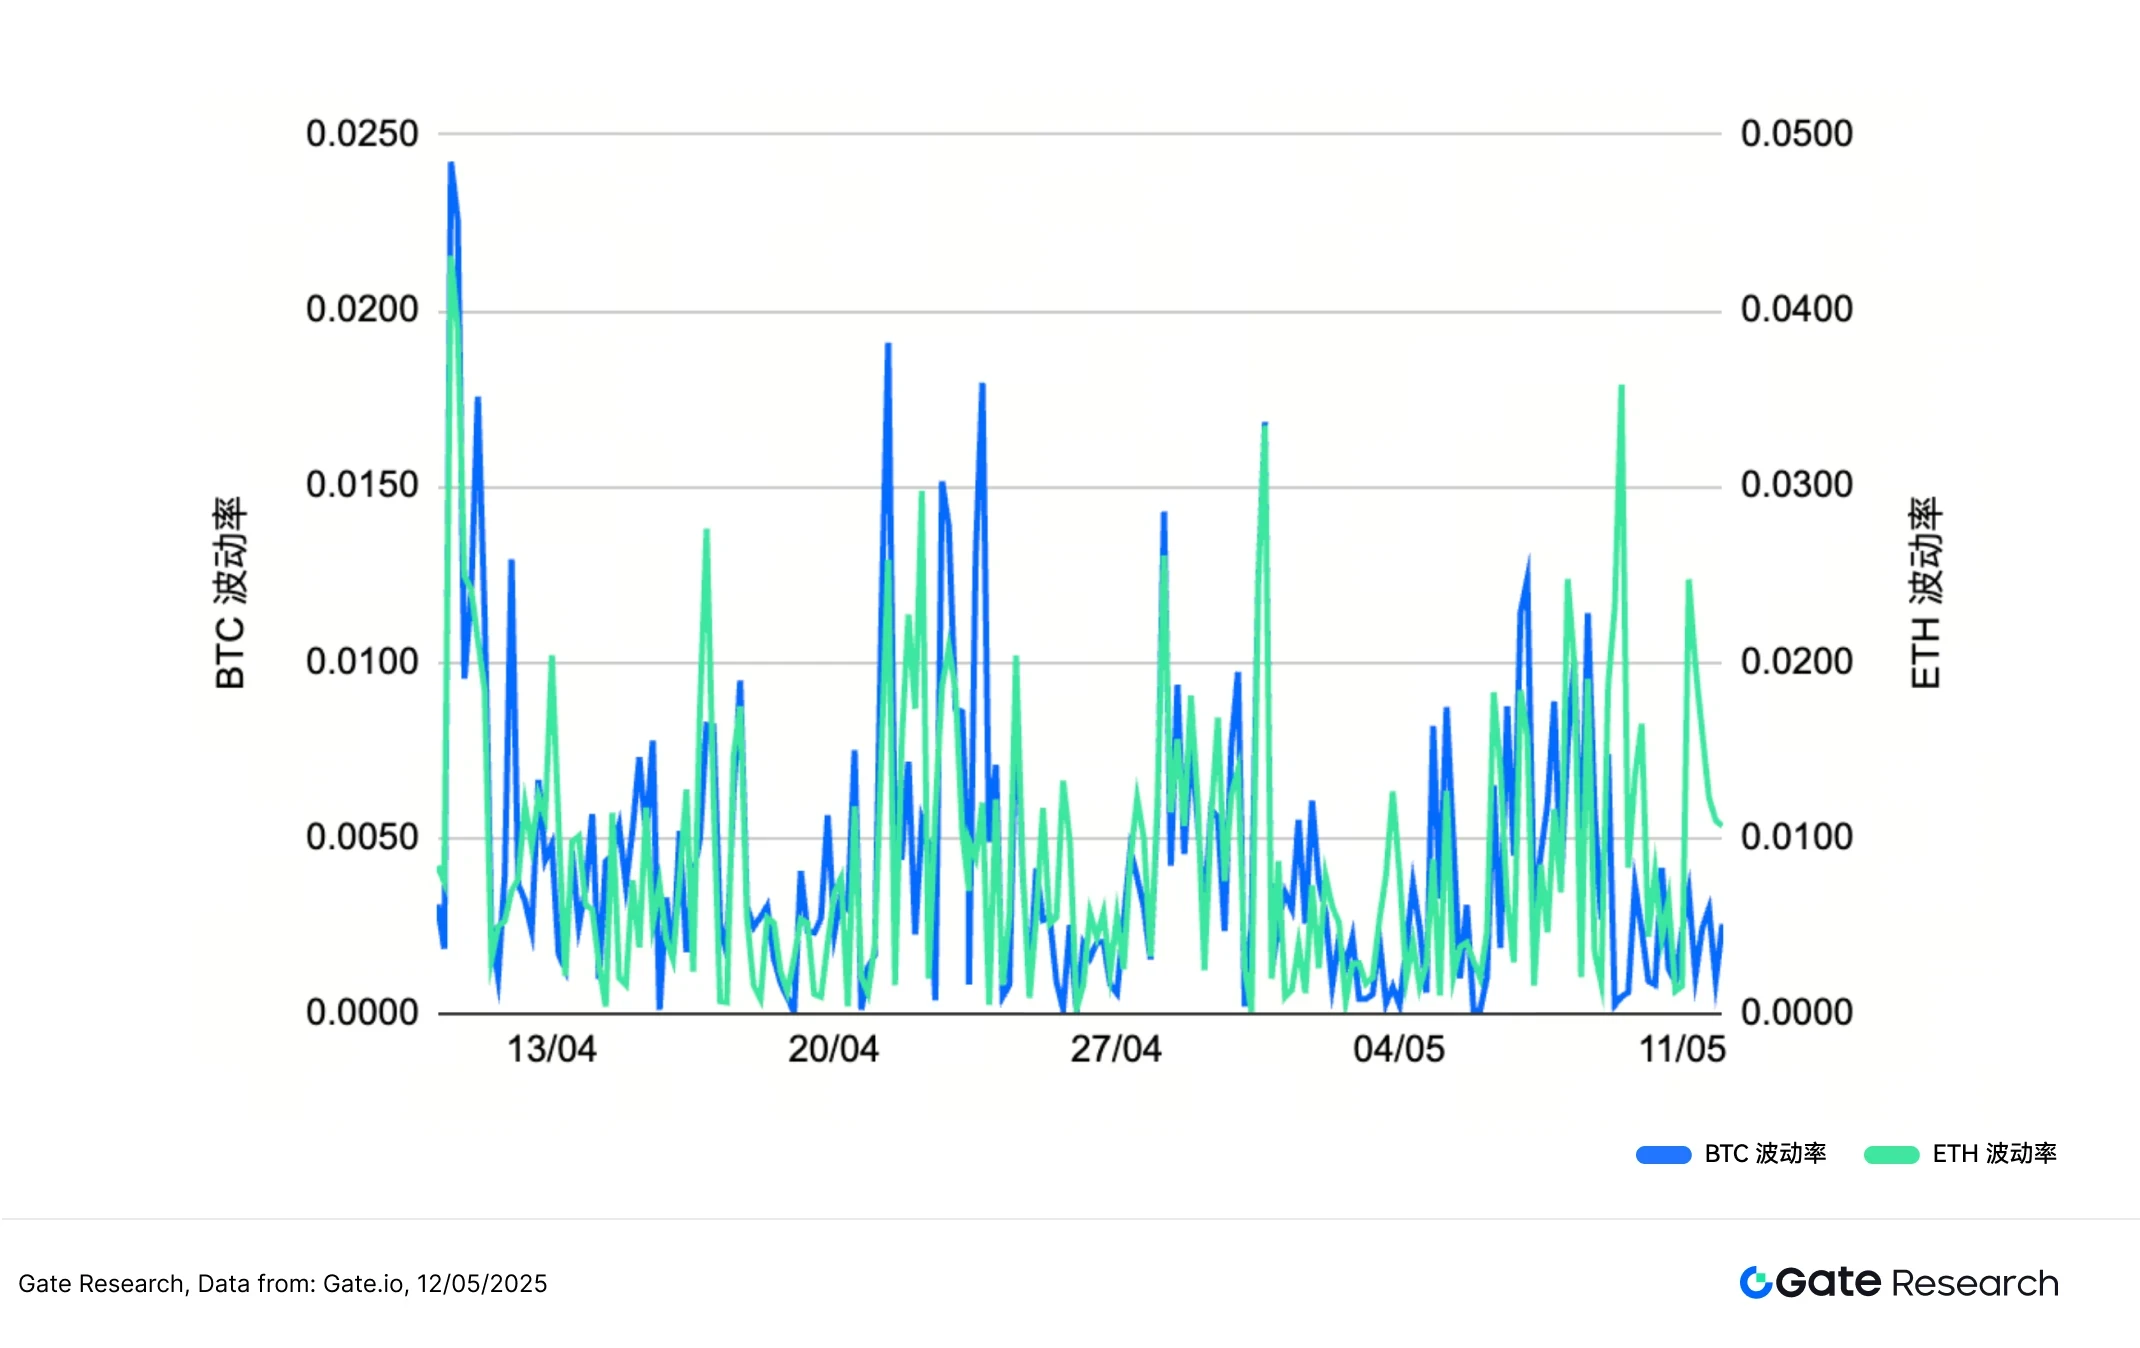
In terms of volatility, the overall volatility of BTC and ETH from early April to mid-May has changed significantly. In mid-April, BTC volatility frequently peaked, indicating that market sentiment was active and prices adjusted drastically; then in late April and early May, the overall volatility tended to converge, reflecting that the market entered a short period of stability. However, before and after the price jump, ETH volatility rose sharply several times, even surpassing BTC at one point, indicating that its rise was accompanied by stronger short-term shocks. Overall, BTCs volatility is relatively more average, while ETHs volatility is concentrated at several key points, especially before and after price breakthroughs, indicating that it is more susceptible to capital push.
Figure 2: BTC’s volatility is relatively more even, while ETH’s volatility has risen sharply several times
Overall, ETH showed a larger price increase and more concentrated volatility changes in this market, showing that it has a strong price response ability at key points; while BTC showed a relatively stable upward trend and a more dispersed volatility distribution, reflecting its relative stability in market fluctuations. Although the two jumped synchronously during the price increase, there are still significant differences in their volatility characteristics and rhythms, reflecting different market characteristics and dynamic structures. In short-term operations, we can continue to pay attention to BTCs capital flow and volatility changes as an important indicator of market risk preference.
2. Analysis of the Long-Short Trading Size Ratio (LSR) of Bitcoin and Ethereum
The Long/Short Taker Size Ratio (LSR) is a key indicator to measure the volume of long and short taker orders in the market, and is usually used to judge market sentiment and trend strength. When LSR is greater than 1, it means that the volume of active buying (taking orders to go long) in the market is greater than the volume of active selling (taking orders to go short), indicating that the market is more inclined to go long and the sentiment is bullish.
According to Coinglass data, the prices of BTC and ETH have shown a clear upward trend in the past two weeks, but in terms of LSR, the two have shown different degrees of divergence. BTCs LSR rose slightly in the early stage of the rise, but it remained around 1 overall, and even fell below 1 around May 10, showing that even if the price continued to rise, the short trading volume in the market also rose simultaneously, reflecting that some investors chose to arrange short orders or hedge operations at high levels. The market has not formed an obvious unilateral long structure, and there is a certain degree of doubt about the rise.
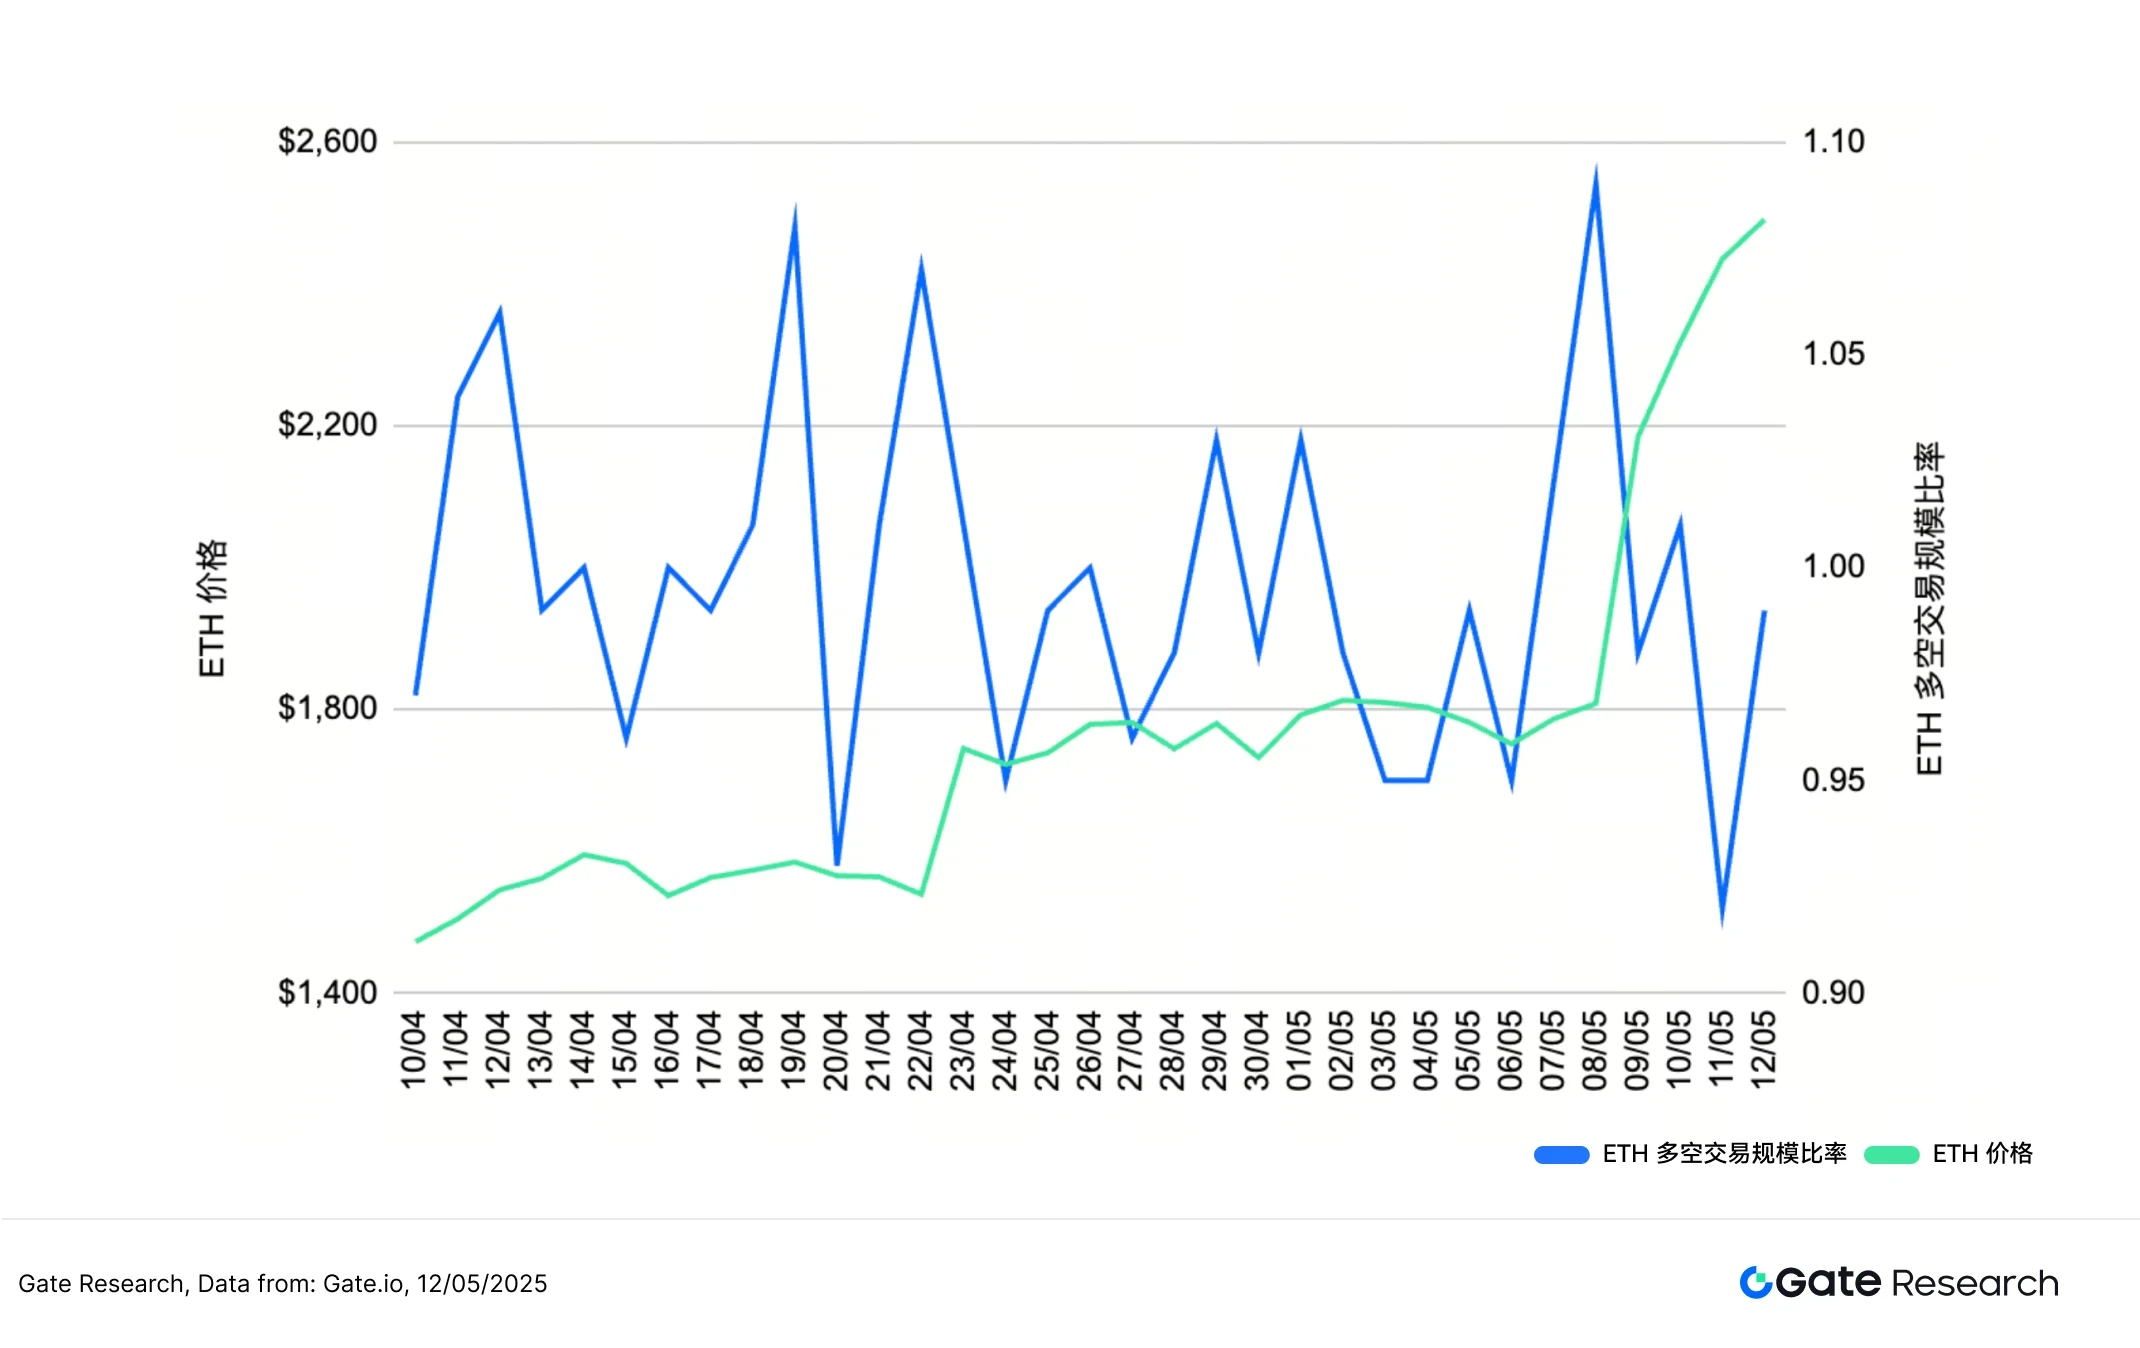
In contrast, ETHs long-short ratio fluctuated more violently. During the period when the price broke through 2,000 USDT and quickly rose to 2,600 USDT, its LSR did not rise steadily, but instead experienced several violent fluctuations, and also fell significantly around May 10. This situation shows that the rise of ETH is accompanied by strong short-term trading and market speculation, and the shorts have not obviously withdrawn, and the market sentiment is quite divergent.
Although the prices of BTC and ETH have risen simultaneously in the past two weeks, their long-short ratio has not continued to increase. Instead, it reflects that the market is generally in a wait-and-see and hedging mood at a high level, and investors are more cautious. The structural support behind the price increase still needs to be further verified. [3]
Figure 3: BTC long-short ratio fluctuates downward, indicating that the high bull momentum is weakening
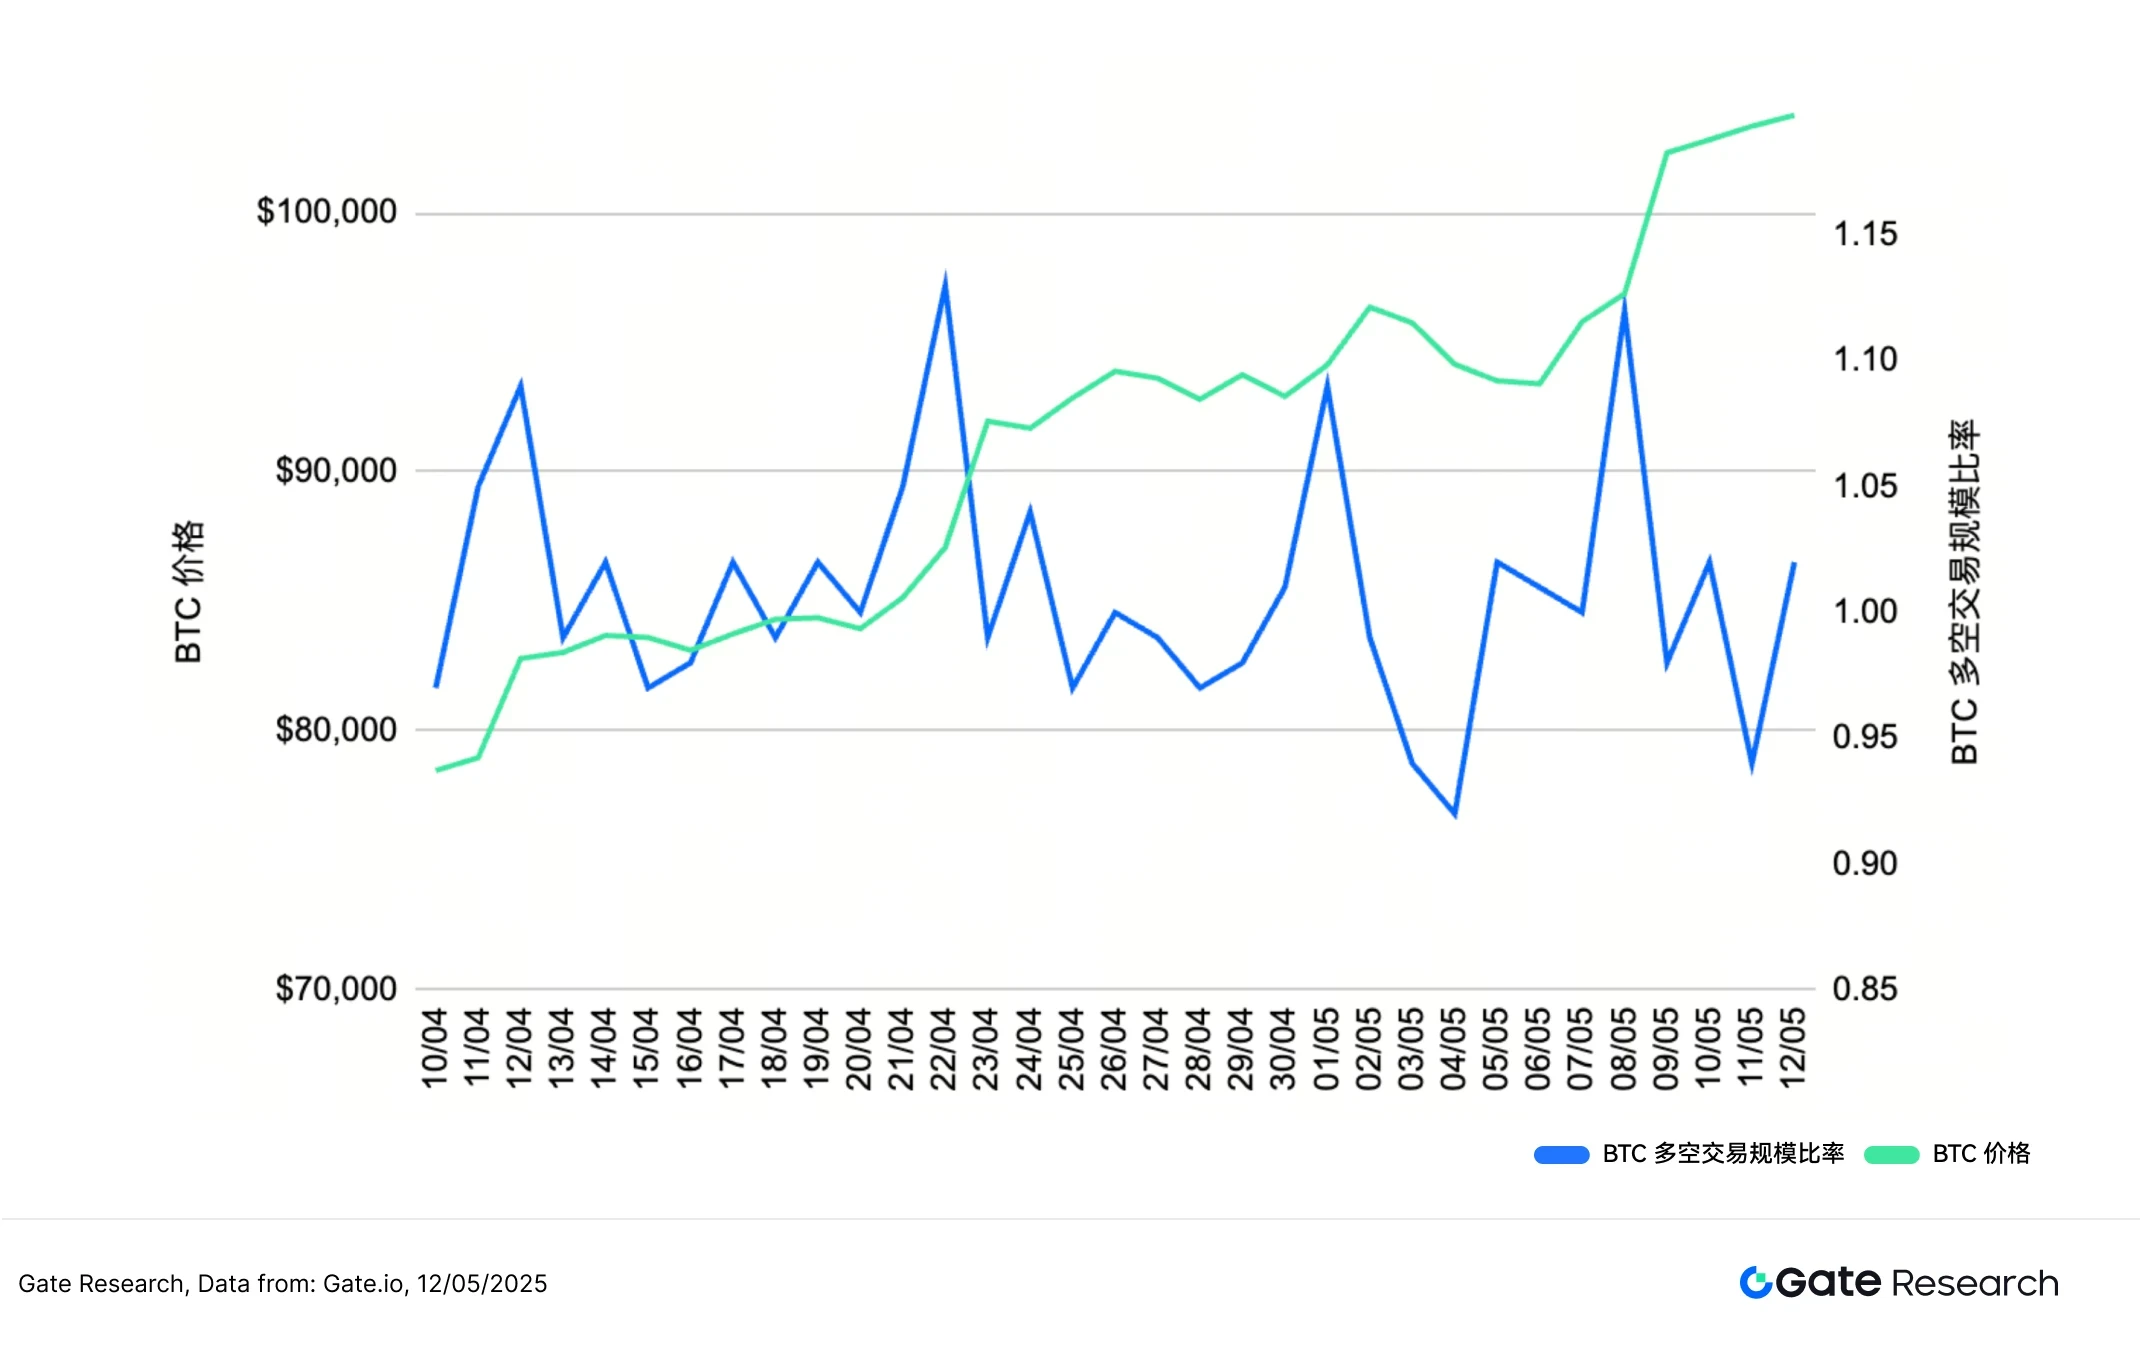
Figure 4: ETH long-short ratio fluctuates violently, and market sentiment diverges significantly
3. Analysis of contract position amount
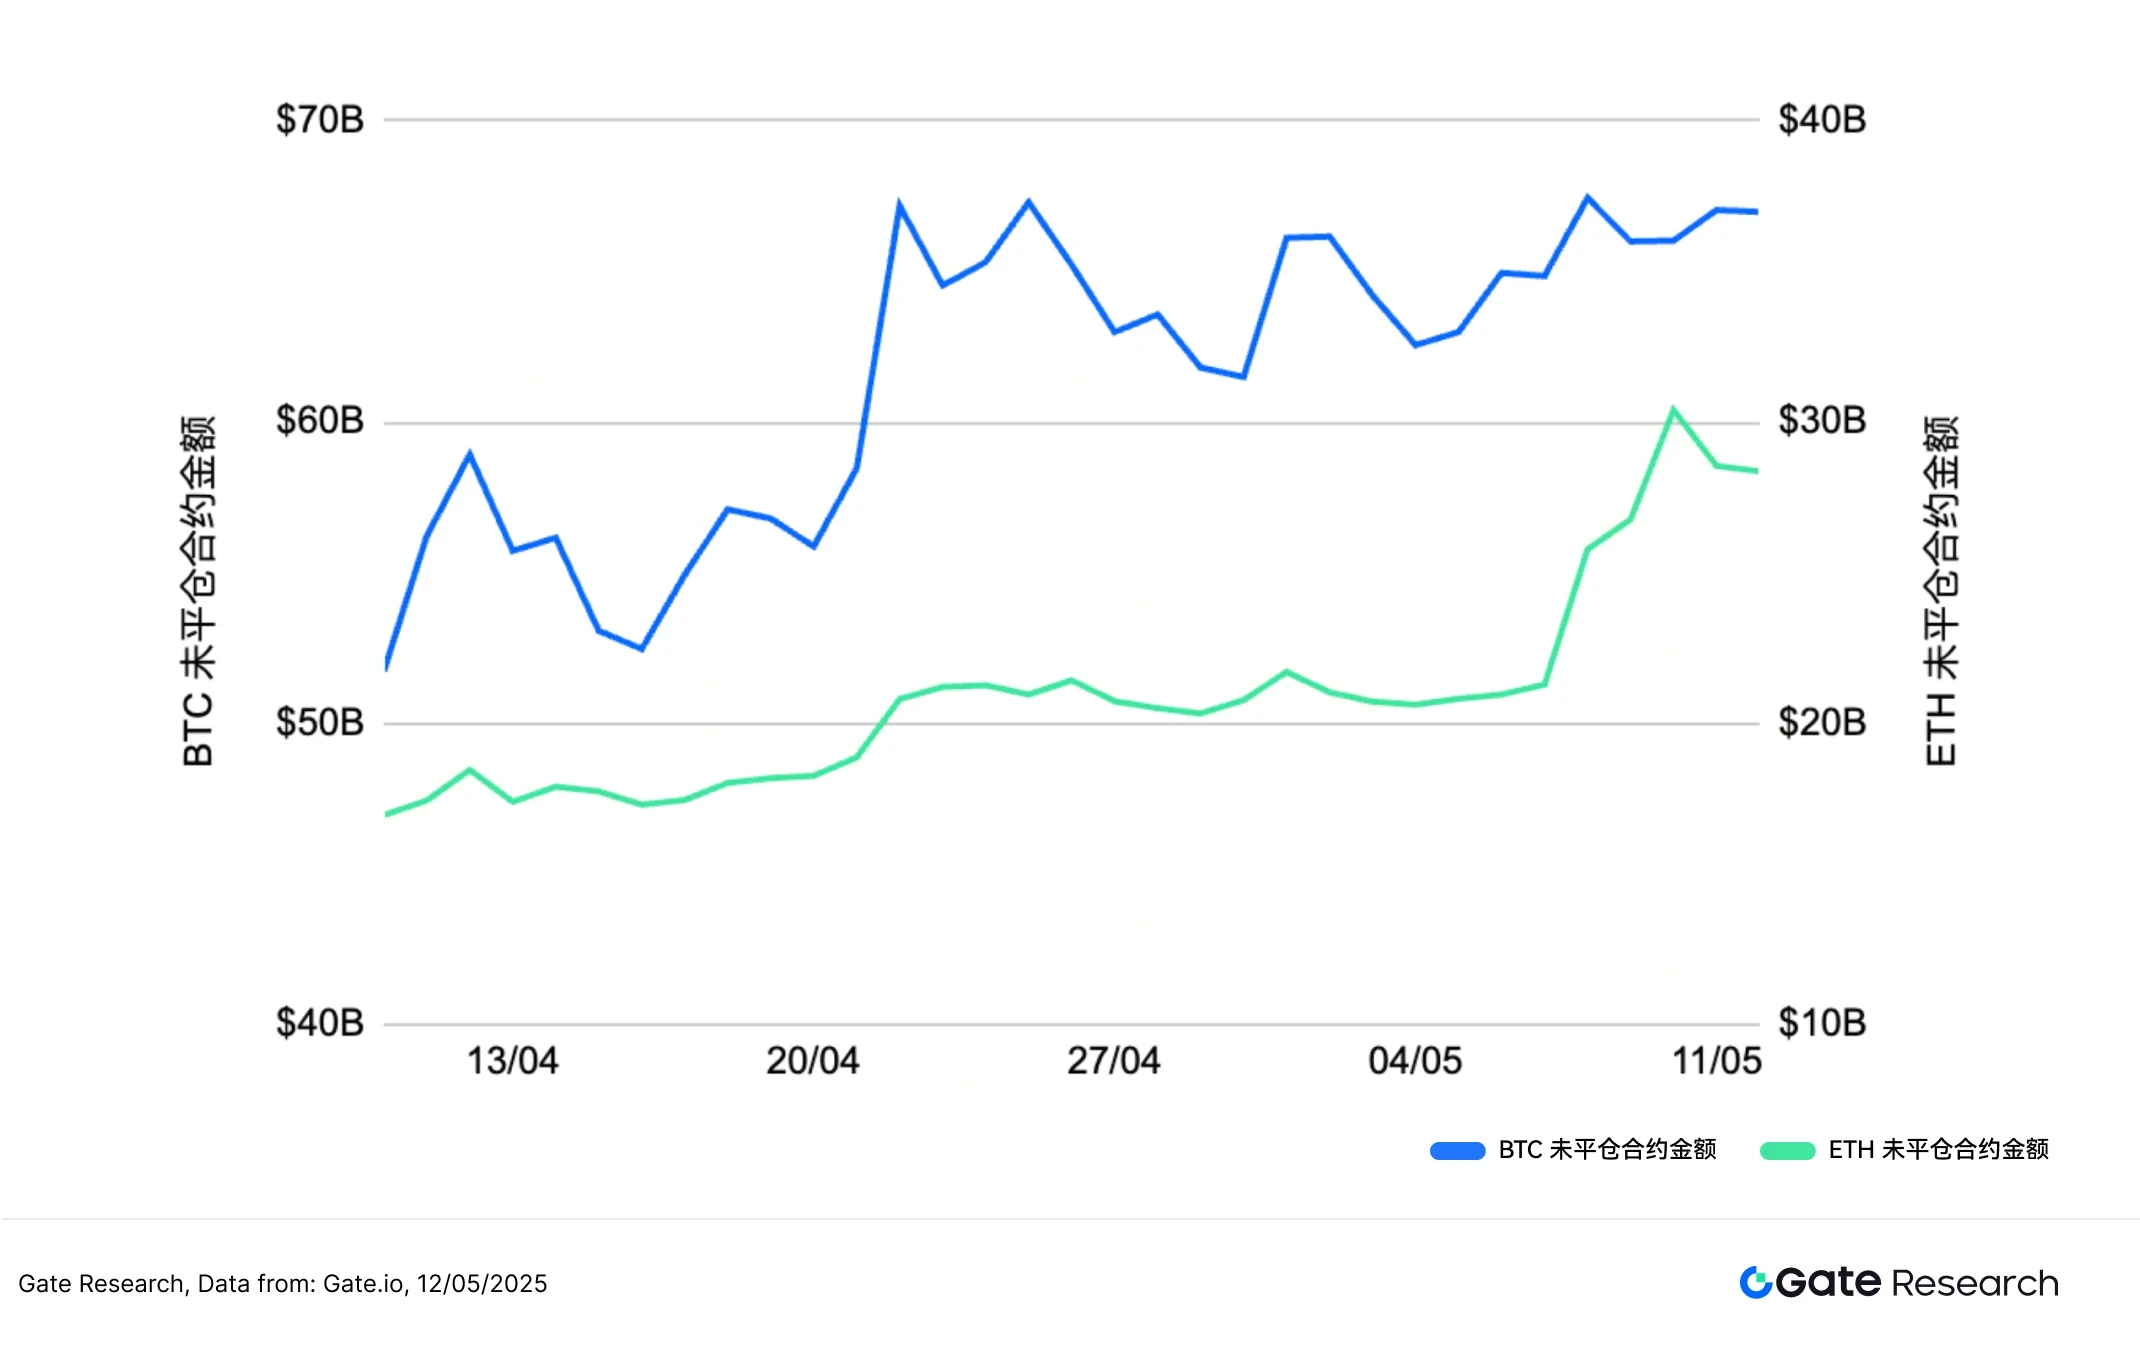
According to Coinglass data, the contract positions of BTC and ETH are on an upward trend, reflecting the continued rise in market trading enthusiasm. BTCs open interest has slowly increased from about $60 billion, and although it fluctuated afterwards, it remained high overall and stabilized after early May. ETHs open interest has increased from about $18 billion to nearly $24 billion, and its trend is basically synchronized with BTC but relatively stable, especially in early May, when there was a significant jump, indicating that funds actively entered the market during this period.
Overall, the simultaneous growth of the contract positions of the two and the price increase confirm each other, indicating that market participation and leverage usage have both increased. However, the capital inflow of BTC has stabilized since the end of April, while ETH has seen a stronger rise in early May, suggesting that ETH has attracted more contract trading interest in the short term. [4]
Figure 5: The growth of BTC contract holdings was relatively slow, while ETH saw a stronger rise in early May.
4. Funding Rate
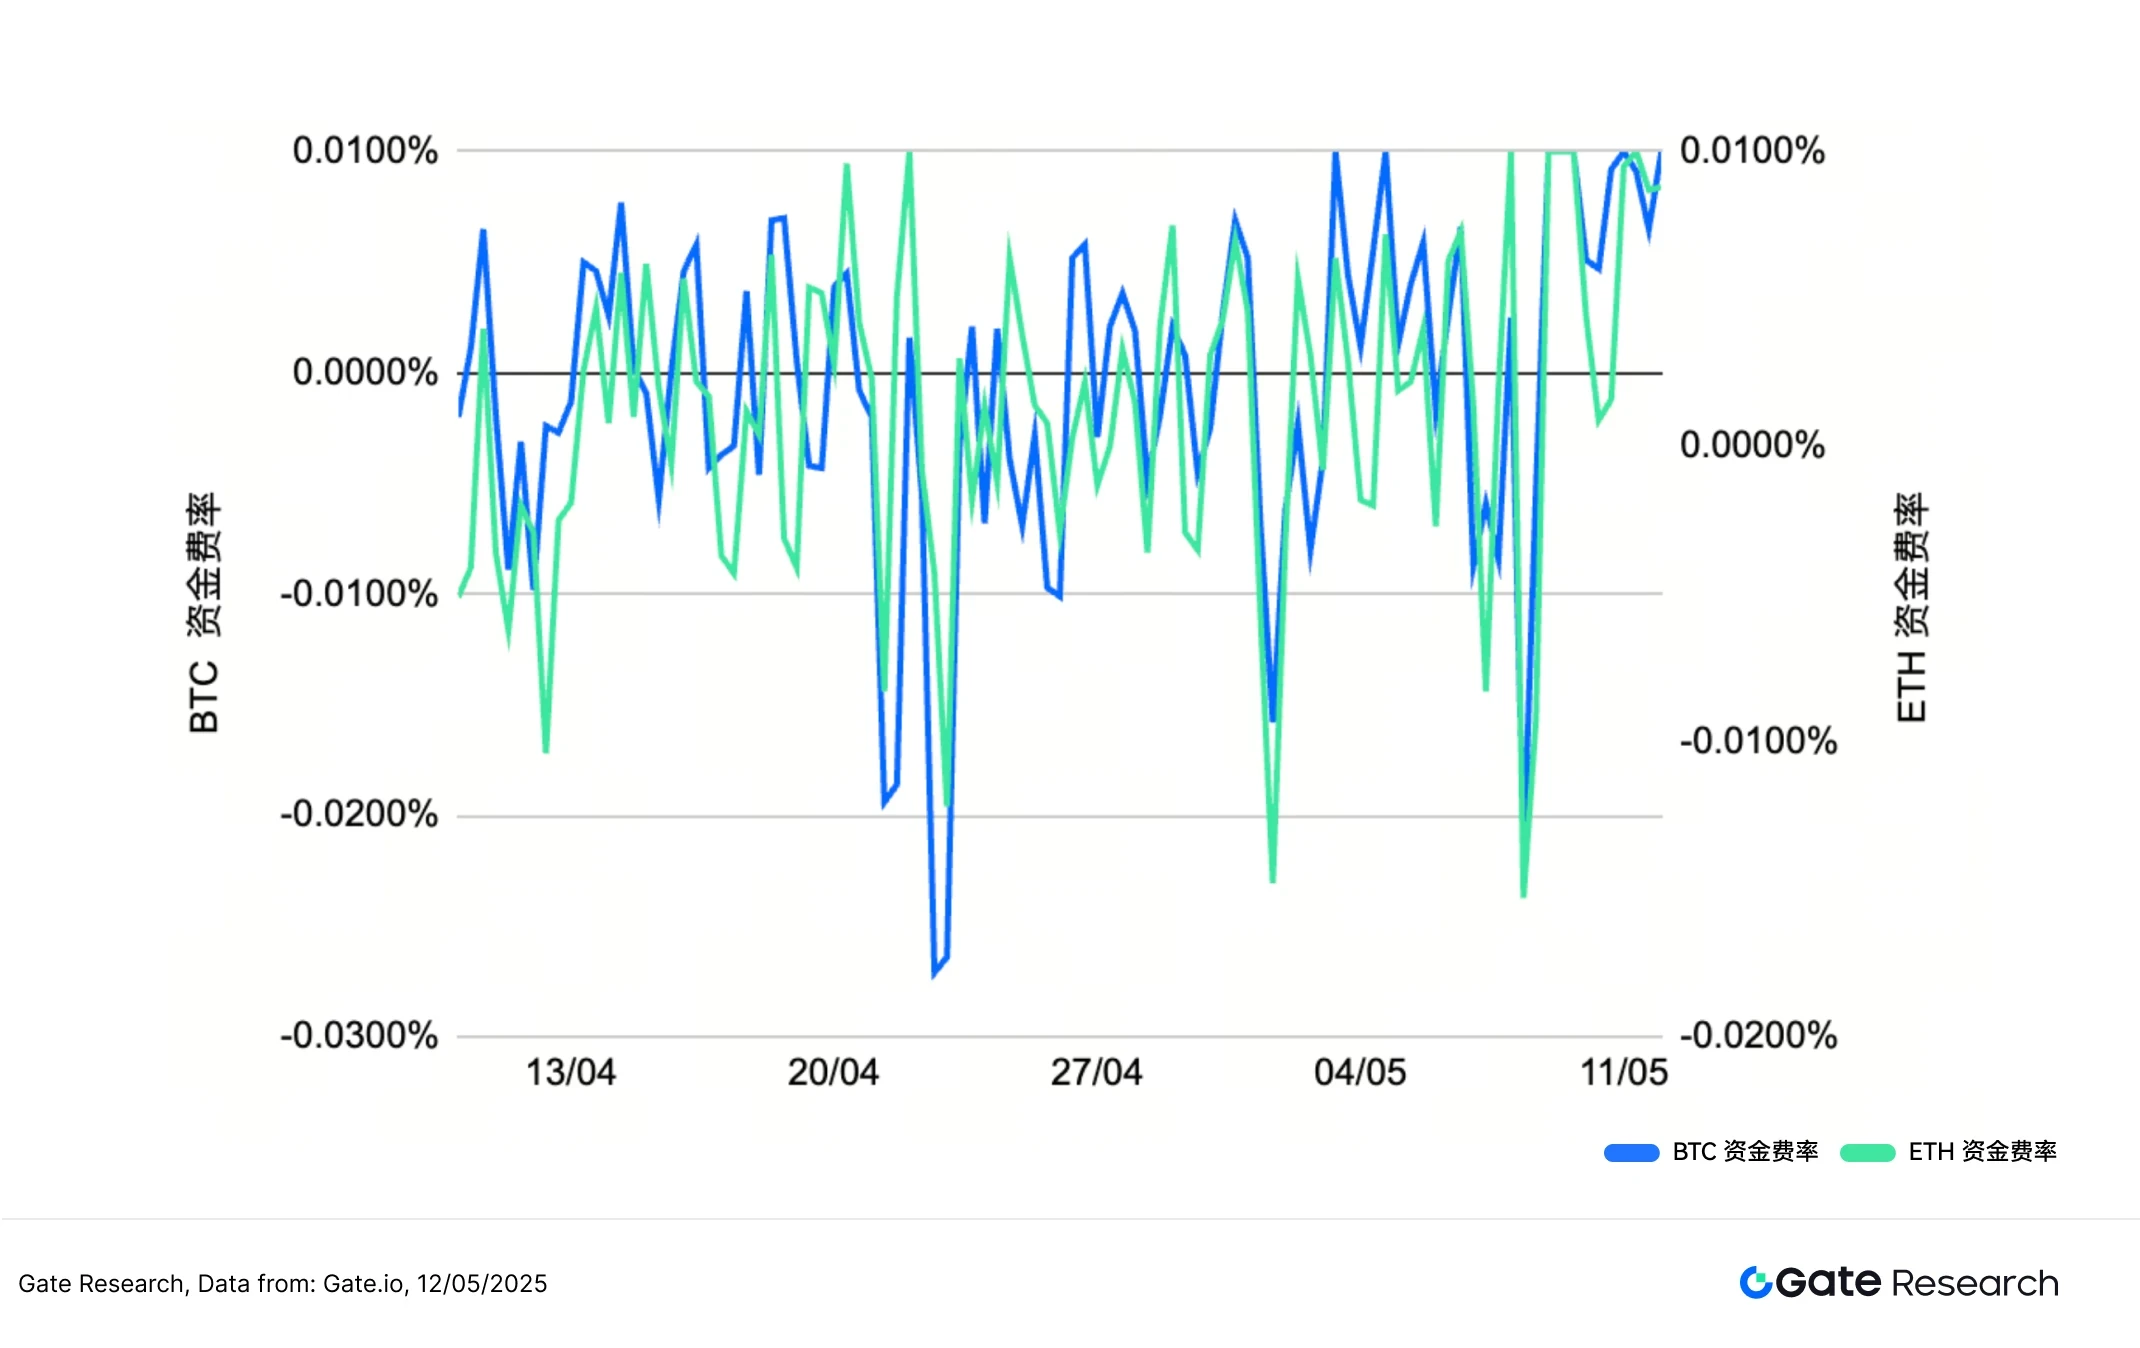
The funding rates of BTC and ETH have remained around 0% with slight fluctuations, showing frequent positive and negative switching, indicating that the markets long and short forces are relatively balanced. In mid-to-late April, BTCs funding rate turned negative several times, especially around April 20, when it once dropped to -0.025%, indicating that the market was dominated by shorts at the time, or there was large-scale short hedging. ETH also had a similar trend during the same period, but the fluctuation was slightly smaller, indicating that although the market briefly turned to short sentiment, it did not form a sustained suppression.
As prices rose and the amount of contract positions increased, the funding rates of both contracts gradually turned positive and remained between 0% and 0.01%, reflecting that bulls gradually gained the upper hand and the market tended to actively build positions. However, overall, the funding rate did not continue to soar, indicating that although the sentiment of leveraged long orders has increased, it has not overheated, and the market sentiment is still in a mildly optimistic stage. [5] [6]
Figure 6: BTC and ETH funding rates have gradually turned positive and maintained between 0% and 0.01%, reflecting that bulls are gradually gaining the upper hand and the market tends to actively build positions.
5. Cryptocurrency contract liquidation chart
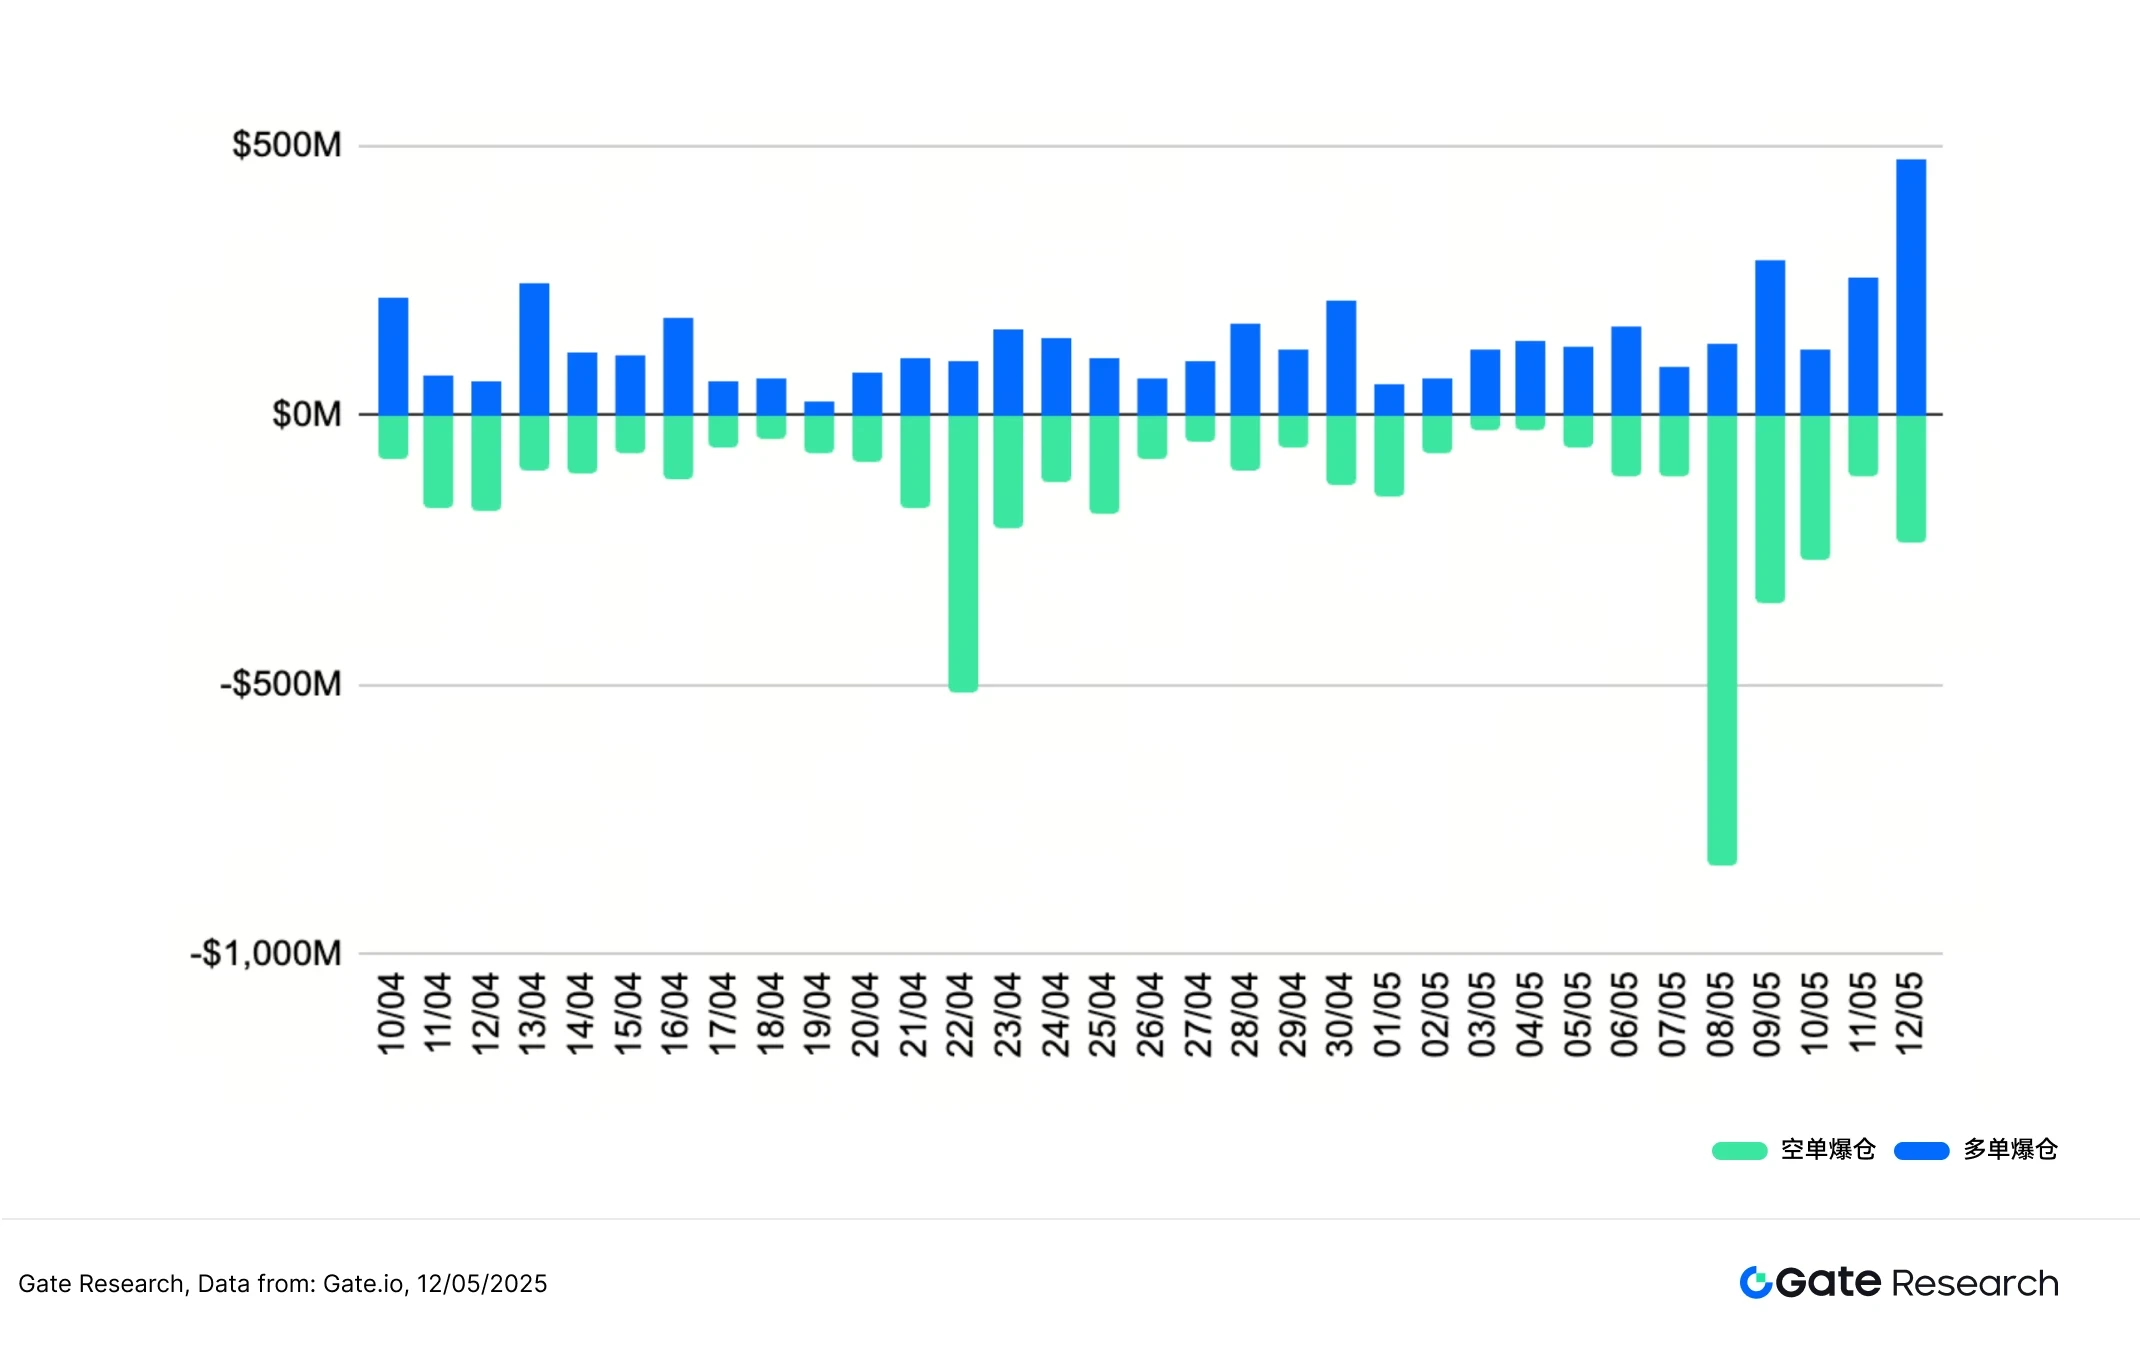
According to Coinglass data, since mid-April, the contract liquidation in the cryptocurrency market has shown a staggered trend of long and short positions, among which the amount of short position liquidation was particularly significant in early May. In particular, on May 8, the amount of short position liquidation soared sharply, reaching US$836 million in a single day, indicating that the market price rose rapidly at that time, resulting in a large number of short positions being forced to close.
On May 12, as market volatility intensified, the amount of long orders liquidated increased significantly, reaching $476 million in a single day, indicating that some high-level longs could not withstand the volatility and suffered reverse liquidation. This phenomenon shows that although the overall trend is bullish, the short-term market is still volatile, shorts and longs are frustrated at key nodes, and the contract market is still highly active and risk-concentrated.
This trend echoes the aforementioned price increase, increase in contract position amount and positive funding rate trend, reflecting that when the market breaks through the key price level, short positions are concentrated and liquidated, forming a short-term bull advantage. However, even in the rising market, long positions will still be liquidated at local highs, especially when the market volatility intensified in mid-May, long positions also faced greater risks, indicating that market volatility is still strong, and the coexistence of high leverage and risk hedging in contract transactions is still very obvious. [7]
Figure 7: On May 8, the amount of short position liquidation surged, reaching $836 million in a single day
Quantitative analysis - Moving average concentration breakthrough strategy
(Disclaimer: All forecasts in this article are based on the analysis results of historical data and market trends. They are for reference only and should not be regarded as investment advice or a guarantee of future market trends. Investors should fully consider the risks and make prudent decisions when making relevant investments.)
1. Strategy Overview
The moving average concentration breakthrough strategy is a momentum strategy that combines technical trend judgment. The strategy identifies the timing of directional fluctuations in the market by observing the convergence of multiple short-term and medium-term moving averages (such as 5-day, 10-day, 20-day, etc.) within a specific period. When multiple moving averages tend to be consistent and close to each other, it usually means that the market is in a consolidation stage and is waiting for a breakthrough. At this time, if the price clearly breaks through the moving average area upward, it is regarded as a long start signal; conversely, if the price falls below the moving average band, it is regarded as a short signal.
In order to improve the practicality of the strategy and the effect of risk control, this strategy also has a fixed ratio of profit-taking and stop-loss mechanism to ensure timely entry and exit when the trend appears, taking into account both rewards and risk control. The overall strategy is suitable for capturing short-term and medium-term trend markets and has a certain degree of discipline and operability.
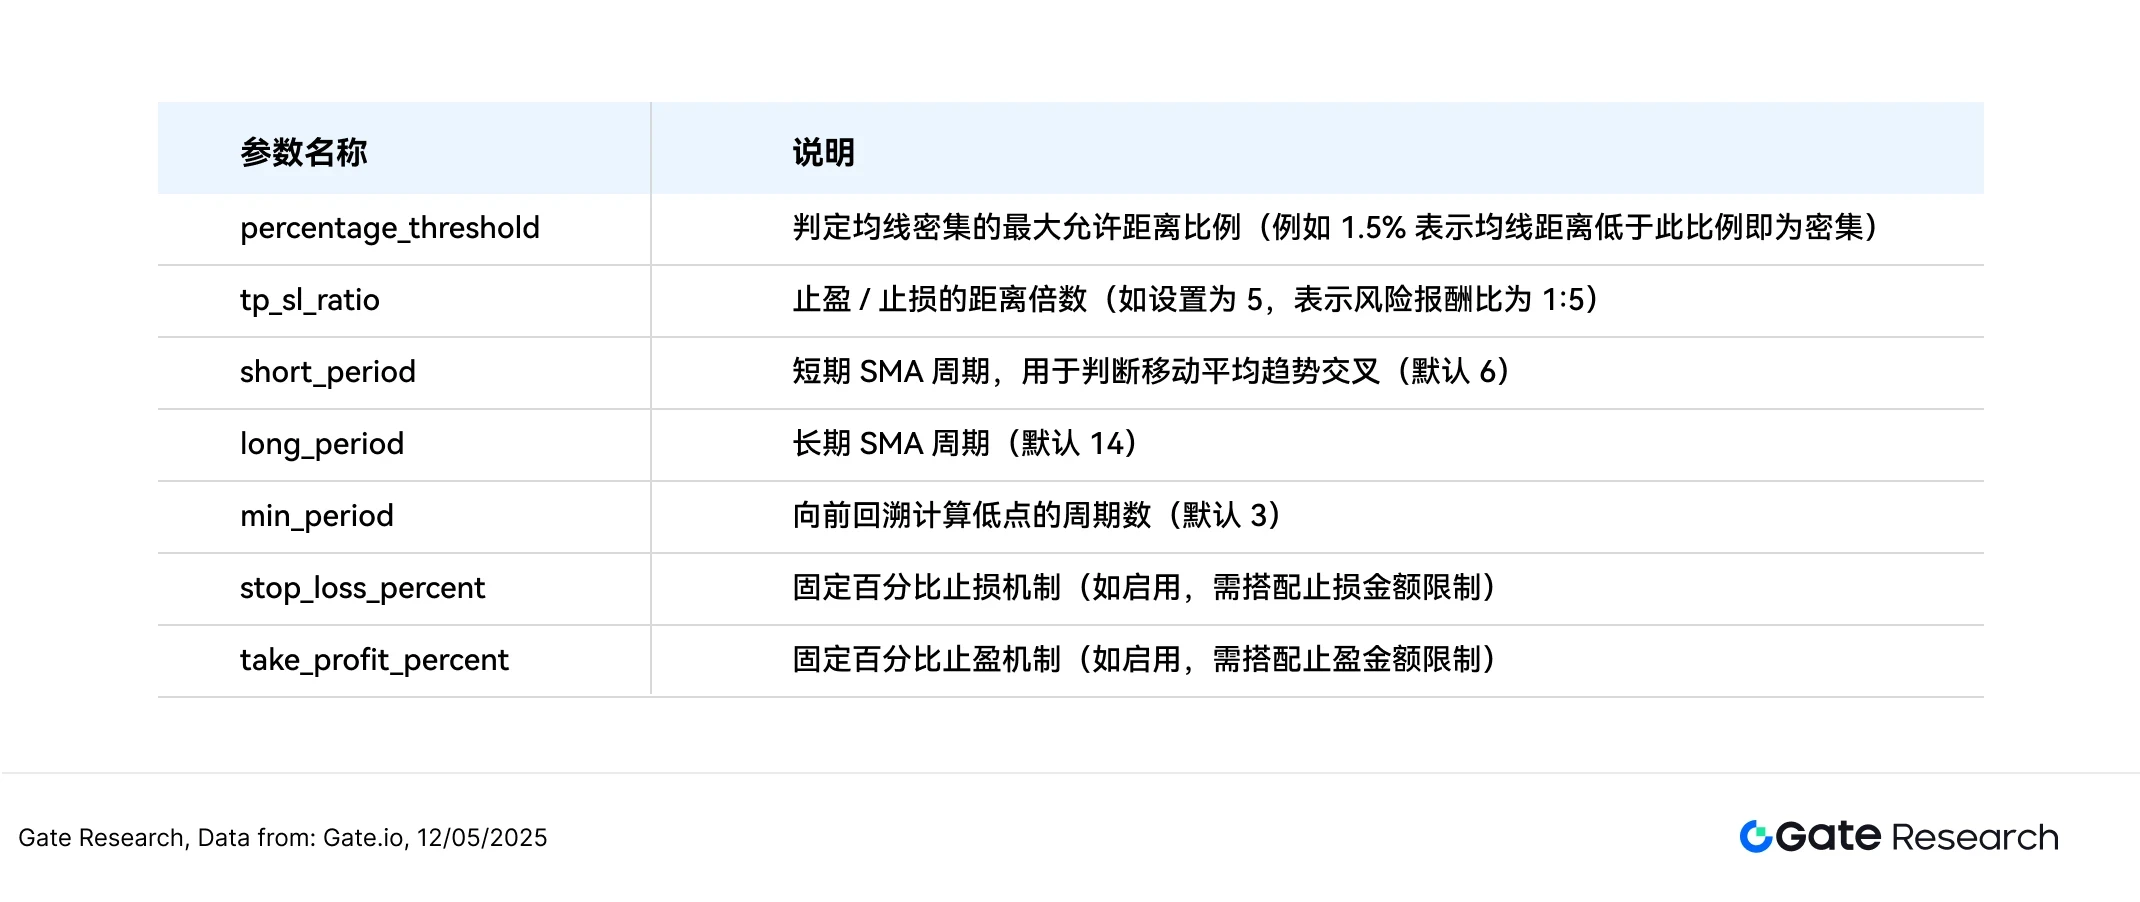
2. Core parameter settings
3. Strategy logic and operation mechanism
Entry conditions
• Determination of moving average density: Calculate the difference between the maximum and minimum values of the six moving averages, SMA 20, SMA 60, SMA 120, EMA 20, EMA 60, and EMA 120 (called the moving average distance). When the distance is lower than the set threshold (for example, 1.5% of the price), it is considered as moving average density.
Threshold is a critical value, which refers to the lowest or highest value that an effect can produce.
• Price breakthrough judgment:
○ When the current price crosses the highest value among the six moving averages, it is regarded as an upward breakthrough signal, triggering a buy operation
○ When the current price breaks below the lowest value among the six moving averages, it is regarded as a downward breakthrough signal, triggering a sell operation
Exit conditions: dynamic take-profit and stop-loss mechanism
• Long order exit:
○ If the price falls below the lowest moving average at the time of opening a position, the stop loss will be triggered;
○ Or the price rises by more than the distance between the opening price and the lowest moving average × the profit and loss ratio, triggering the stop profit.
• Short position exit:
○ If the price rises above the highest moving average at the time of opening the position, the stop loss will be triggered;
○ Or the price drops by more than the distance between the opening price and the highest moving average × the profit and loss ratio, triggering the stop profit.
Actual combat example diagram
• Trading signal triggering
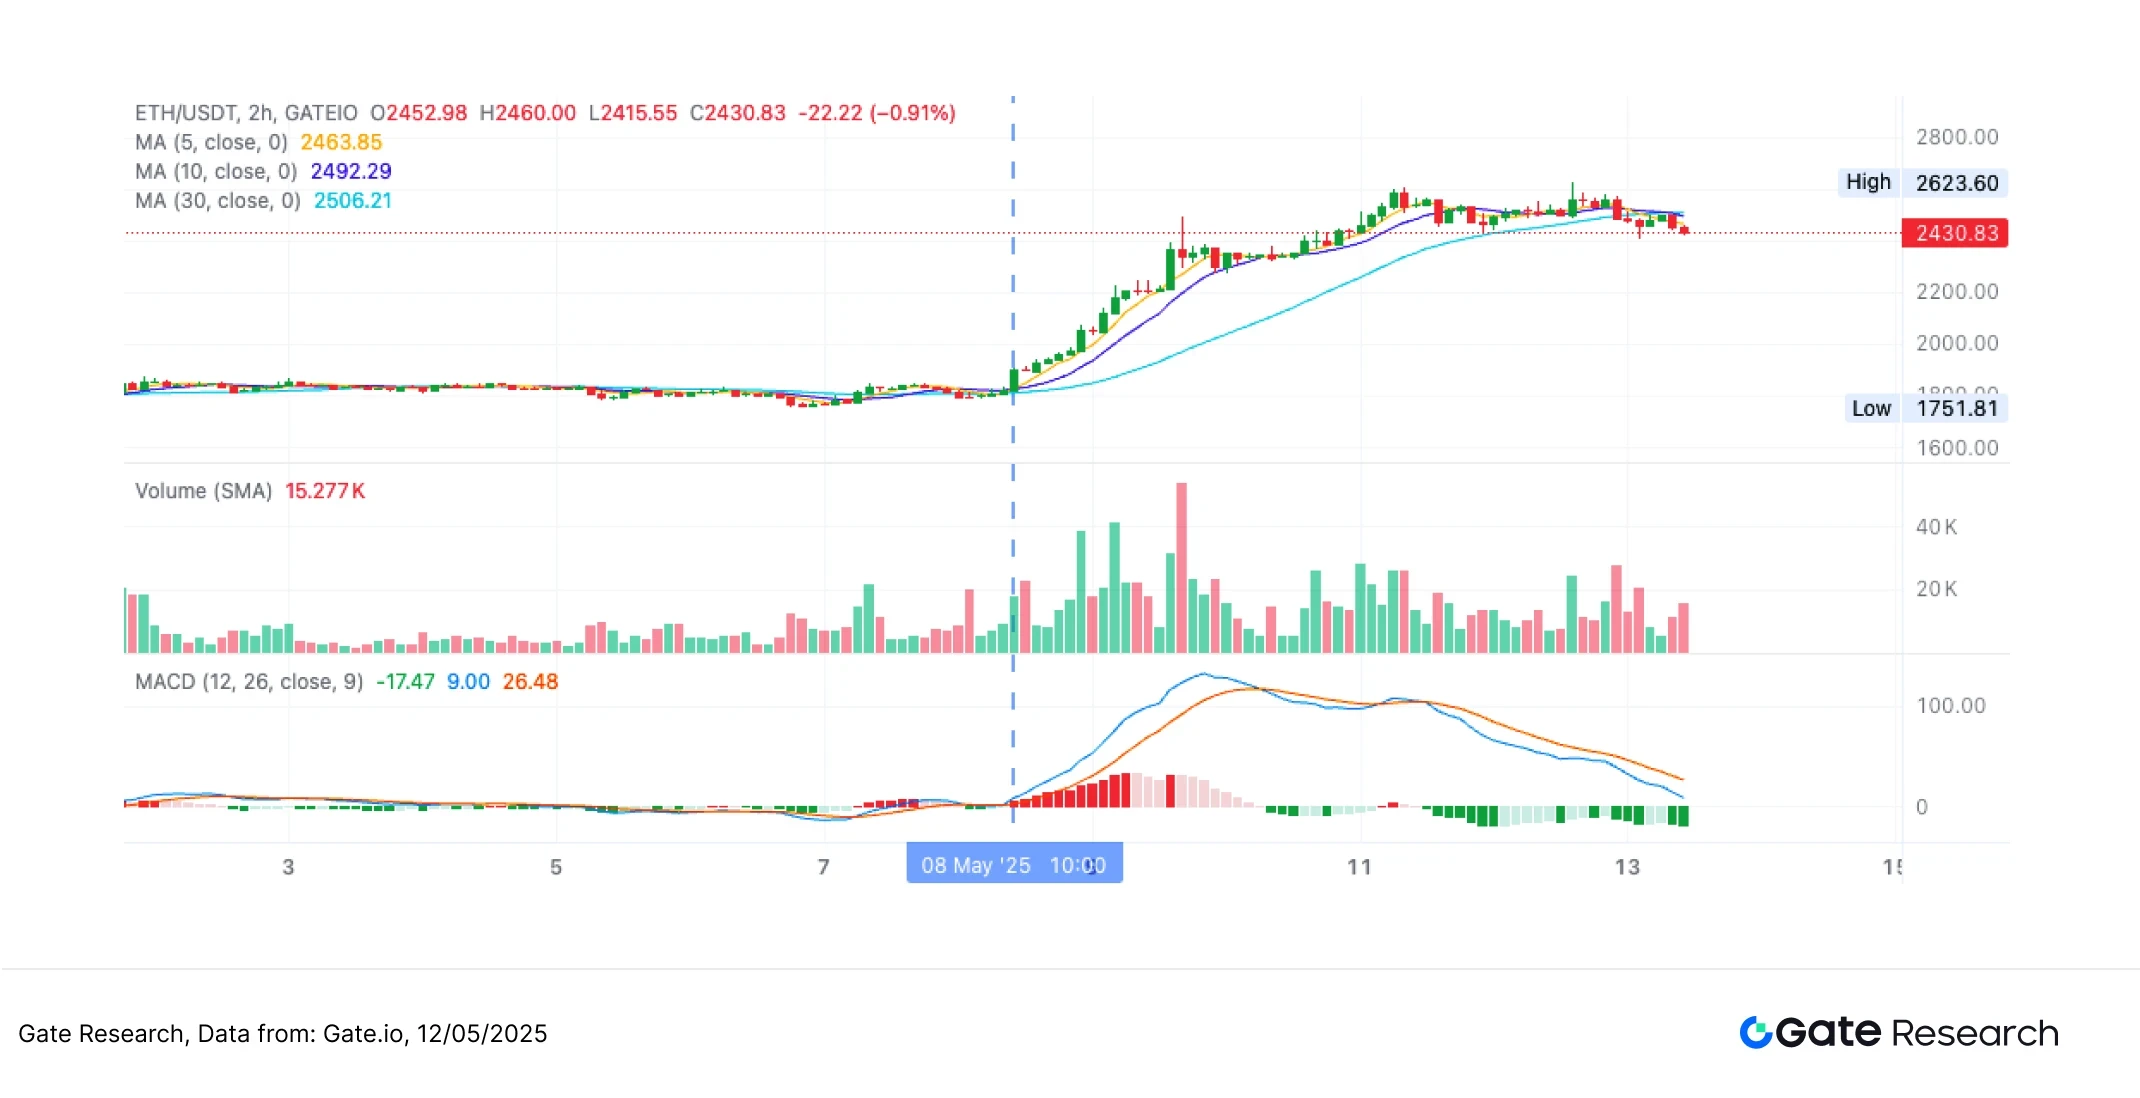
The following figure is the ETH/USDT 2-hour K-line chart when the strategy was last triggered on May 8, 2025. It can be seen that the price broke upward after the six moving averages were highly concentrated, which met the entry conditions set by the strategy. The system executed a buy operation at the current price breakthrough and successfully captured the starting point of the subsequent upward trend.
Figure 8: Schematic diagram of the actual entry position when the ETH/USDT strategy conditions are triggered (May 8, 2025)
• Trading actions and results
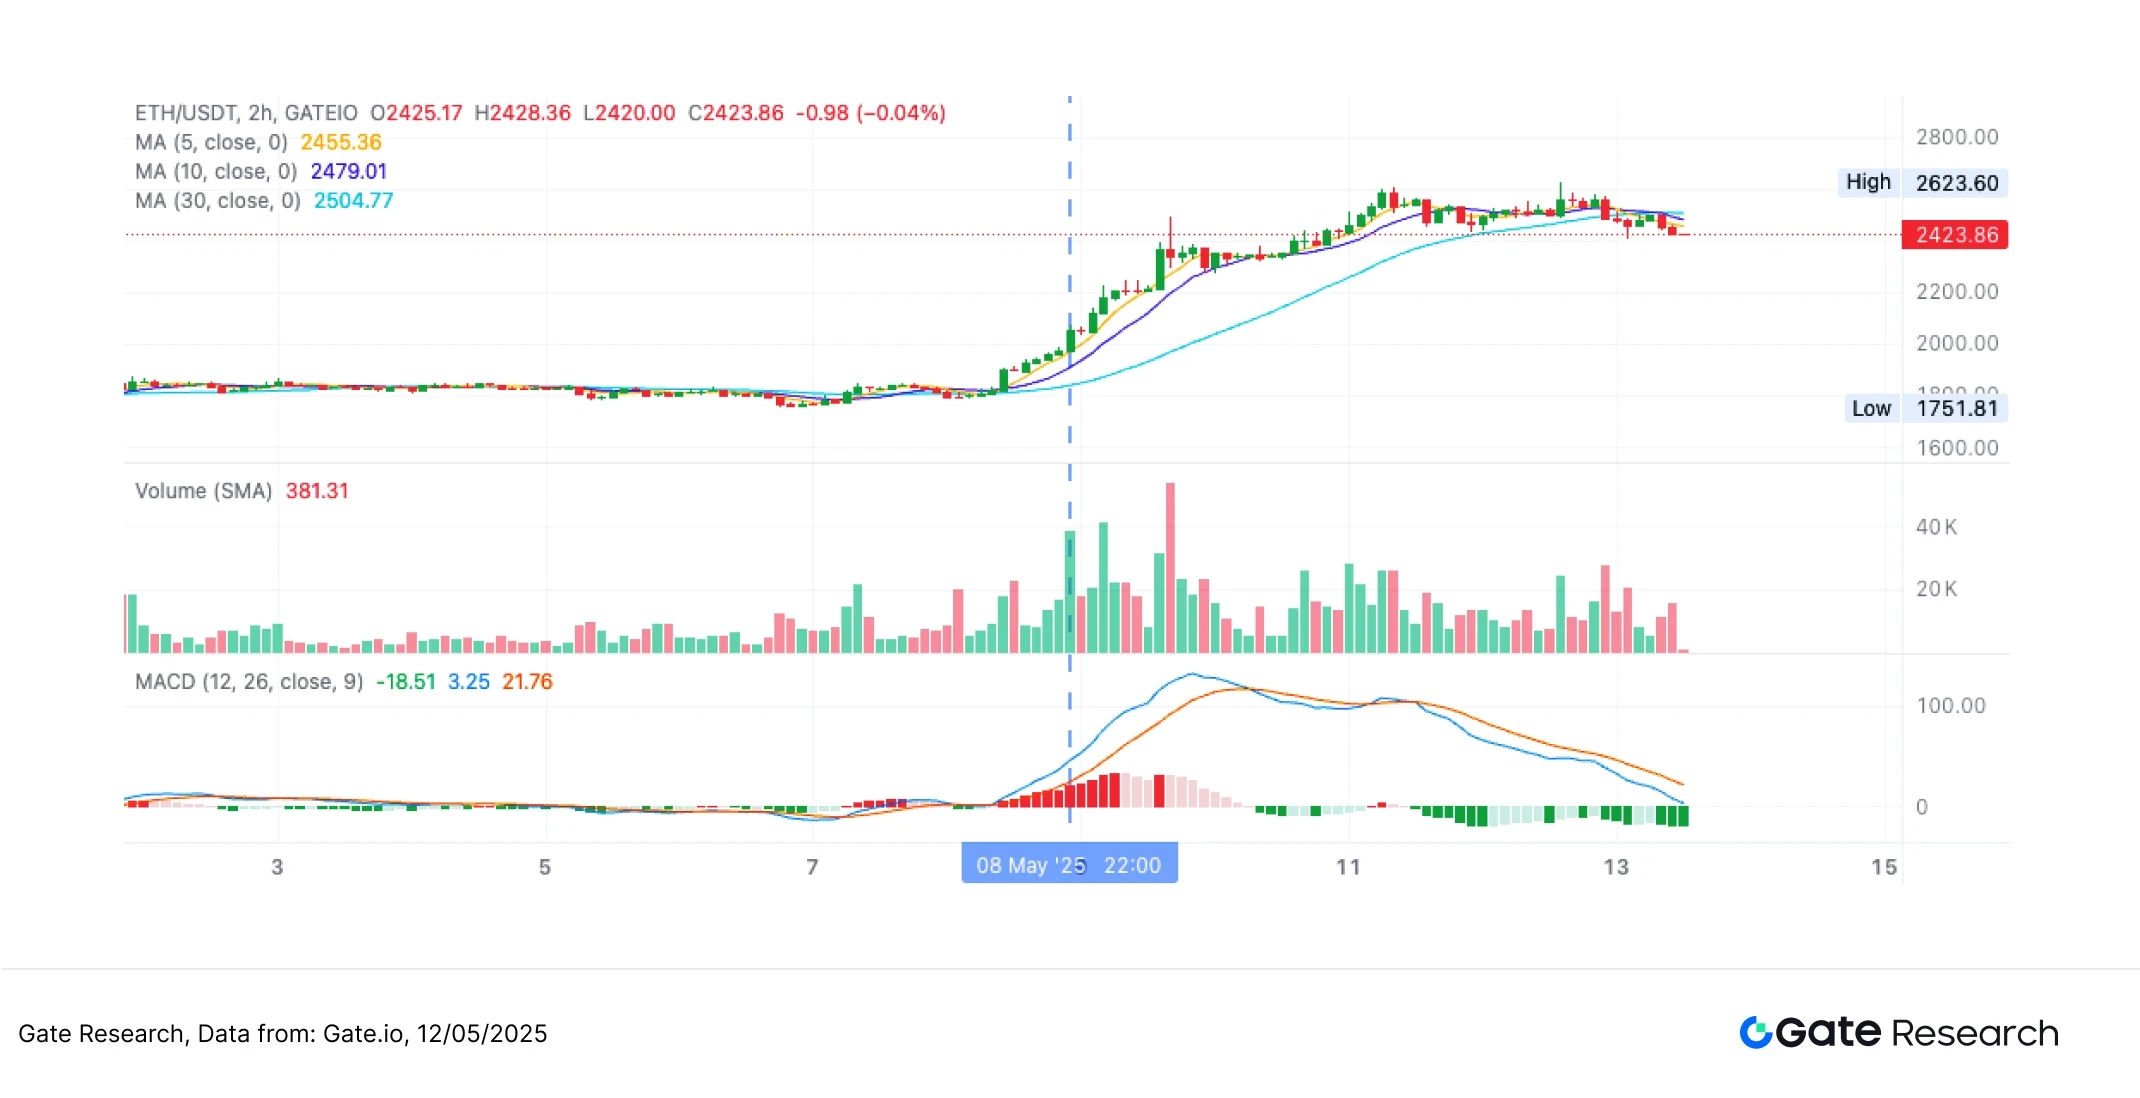
The system uses a dynamic stop-profit mechanism to automatically exit the market after reaching the preset profit-loss ratio, effectively locking in the main wave gains. Although there is still room for further growth that has not been included, the overall operation follows the strategic discipline, showing good risk control and execution stability. If it is combined with a moving stop-profit or trend tracking mechanism in the future, it may further extend the profit space in a strong market.
Figure 9: ETH/USDT strategy exit position diagram (May 8, 2025)
Through the above practical examples, we intuitively present the entry logic and dynamic stop-profit mechanism of the strategy when the moving average is dense and the price breaks through the conditions. The strategy accurately captures the trend starting point through the linkage between the price and the moving average structure, and automatically exits the market in the subsequent fluctuations, locking in the main profit range under the premise of controlling risks. This case not only verifies the practicality and execution discipline of the strategy, but also reflects its stability and risk control ability in the real market, laying the foundation for subsequent parameter optimization and strategy summary.
4. Practical application examples
Parameter backtesting settings
To find the best parameter combination, we perform a systematic grid search over the following ranges:
• tp_sl_ratio: 3 to 14 (in steps of 1)
• threshold: 1 to 19.9 (in steps of 0.1)
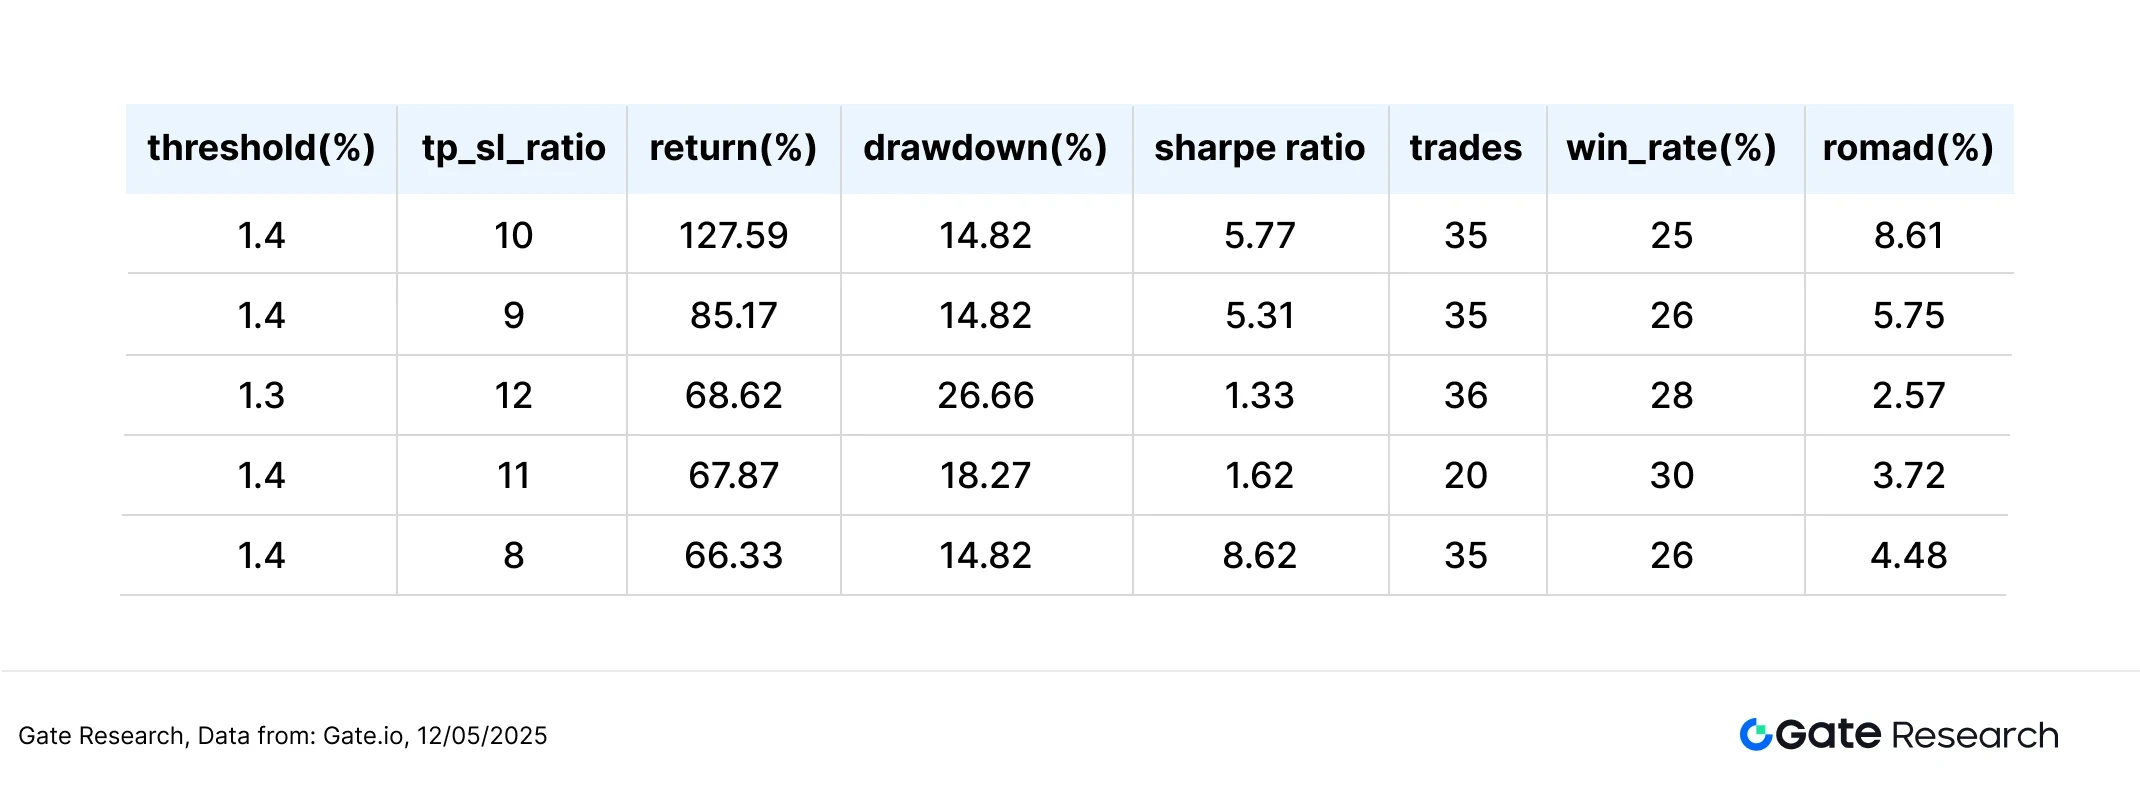
Taking ETH/USDT as an example, in the backtest data of the 2-hour K-line in the past year, the system tested a total of 23,826 sets of parameter combinations, and screened out the five sets with the best cumulative yield performance. The evaluation criteria include annualized return rate, Sharpe value, maximum drawdown and ROMAD (return to maximum drawdown ratio), which are used to comprehensively measure the performance of the strategy.
Figure 10: Performance comparison of five optimal strategies
Strategy logic description
When the system detects that the distance between the six moving averages converges to within 1.4%, and the price breaks through the upper edge of the moving average from bottom to top, a buy signal is triggered. This structure intends to capture the moment when the price is about to break through, enter the market at the current price, and use the highest moving average at the moment of breaking through as a reference benchmark for dynamic profit-taking, thereby improving the ability to control returns.
This strategy uses the following settings:
• percentage_threshold = 1.4 (maximum spacing limit for the six moving averages)
• tp_sl_ratio = 10 (dynamic take profit range setting)
• short_period = 6, long_period = 14 (moving average observation period)
Performance and results analysis
The backtest period is from May 1, 2024 to May 12, 2025. This set of parameters performed well during this period, with an annualized return rate of 127.59%, a maximum drawdown of less than 15%, and a ROMAD of up to 8.61%, showing that the strategy not only has stable capital appreciation capabilities, but also effectively compresses downside risks.
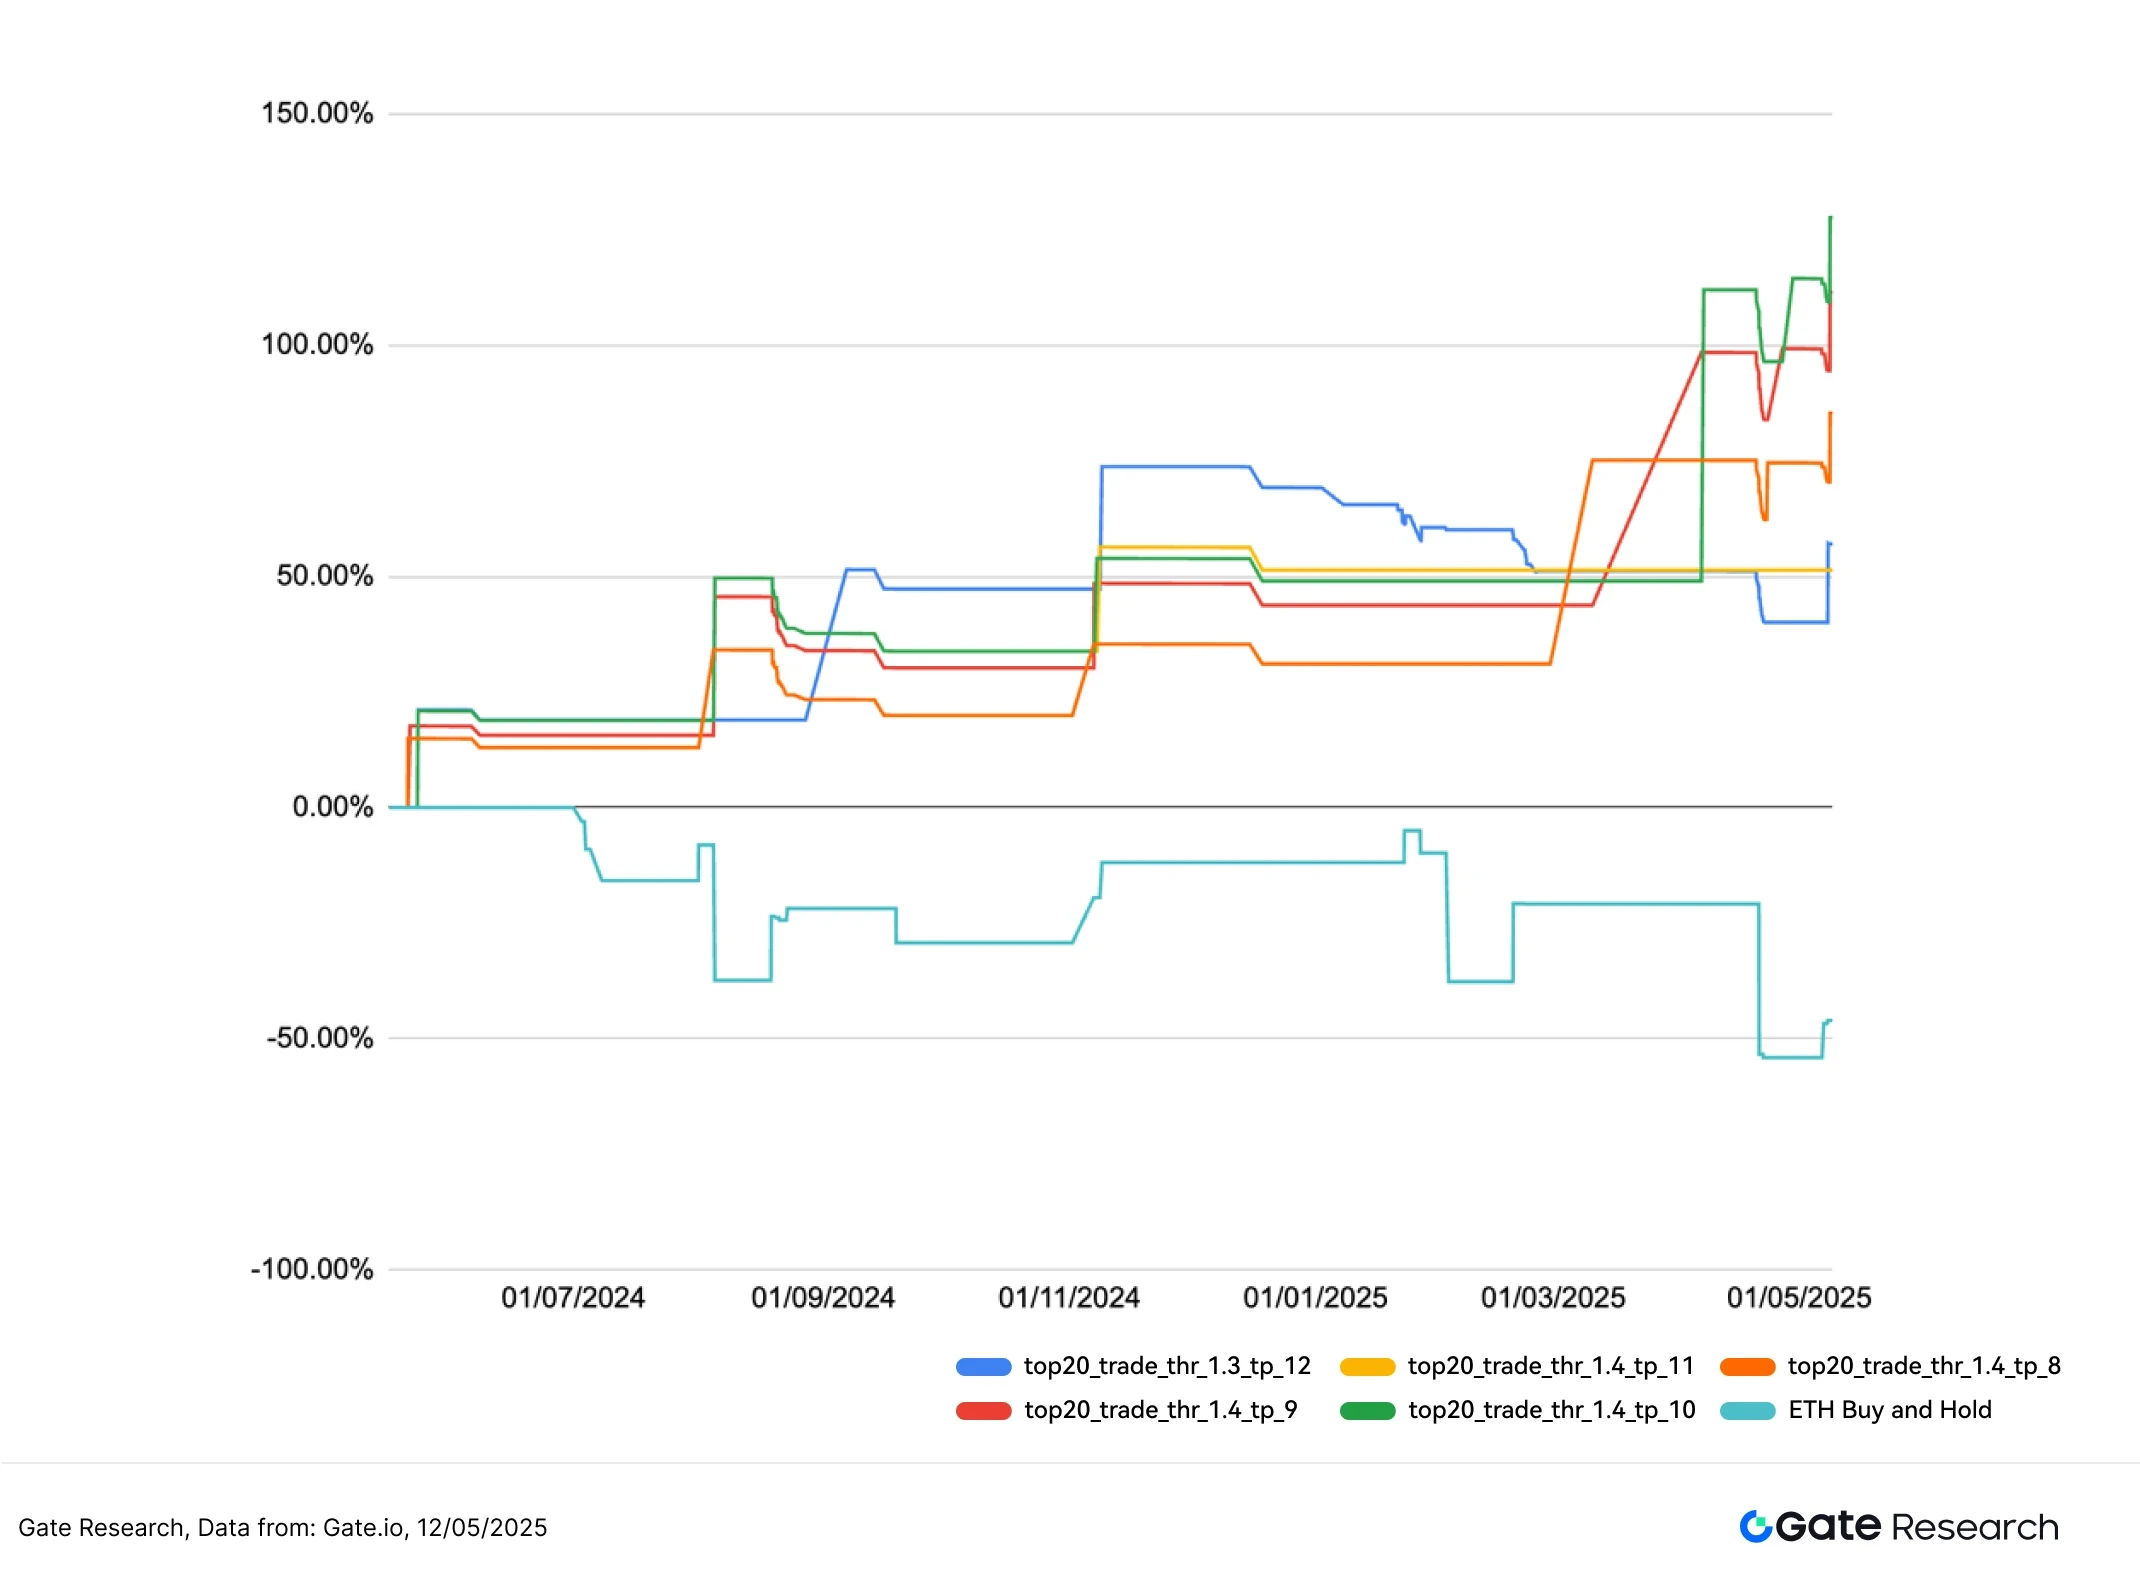
As shown in the figure, the overall performance of the strategy in the past year was significantly better than that of the Buy and Hold strategy of ETH (-46.05%), especially when market volatility intensified or trend reversed, it showed a good profit-taking and re-entry mechanism, and the drawdown control was significantly better than passive holding.
We also compared the five best performing parameters horizontally. The current combination has achieved the best balance between return and stability, and has strong practical application value. In the future, we can further combine the dynamic threshold adjustment mechanism, or add volume and volatility screening logic to improve adaptability in volatile markets, and expand to multi-currency and multi-period strategy deployment.
Figure 11: Comparison of the cumulative returns of the five optimal parameter strategies and the ETH holding strategy in the past year
5. Trading strategy summary
The Moving Average Concentrated Breakout Strategy is a trend-based momentum strategy designed based on the dynamic aggregation of multiple medium- and short-term moving averages. It detects the convergence of moving averages and price breakthroughs to capture key turning points before the market starts. This strategy integrates price structure judgment and dynamic profit-taking mechanism, and can effectively participate in medium- and short-term trend bands while controlling retracements.
In this backtest, we used ETH/USDT as the benchmark and used 2-hour K-line data for systematic grid parameter optimization, covering 23,826 parameter combinations. The backtest period was from May 1, 2024 to May 12, 2025. Finally, five sets of parameters with the best performance in terms of return and risk control were selected, and performance was analyzed based on their annualized return rate, maximum drawdown, Sharpe ratio and ROMAD. The best strategy combination is: percentage_threshold = 1.4, tp_sl_ratio = 10, with an annualized return rate of up to 127.59%, a maximum drawdown of less than 15%, and a ROMAD of 8.61%. The risk-adjusted performance is much better than the ETH Buy and Hold benchmark (-46.05% during the same period).
From the parameter distribution, the best performance is mostly concentrated in the range of low threshold value and medium-high tp_sl_ratio, which shows that detecting the dense moving average structure in the early stage of the market and moderately relaxing the take-profit space can help capture the complete band market. Relatively speaking, when the threshold is set too high or the take-profit ratio is low, the strategy is more likely to fall into the problem of frequent entry and exit and premature exit, thereby lowering the overall return rate.
Overall, this strategy shows extremely high returns and risk control efficiency in the medium-term volatility structure of ETH. The strategy logic is stable and has flexible parameters, and has high practical potential. The distribution characteristics of the backtest parameters show that the combination of threshold between 1.3 and 1.5 and tp_sl_ratio between 9 and 11 shows more stable returns and risk control performance in various performance indicators, which also reflects that the strategy is strong in capturing the initial momentum of the trend and continuing the band profit. In addition, combined with the volume screening and shock filtering mechanism, it is expected to further enhance the adaptability and robustness of the strategy under different market conditions and expand its space for cross-market deployment.
Summarize
From April 25 to May 12, the cryptocurrency market showed the structural characteristics of strong upward price, but still cautious sentiment. BTC and ETH rose simultaneously, with ETH rising more and fluctuating more violently. The long-short ratio and funding rate were not significantly overweight, indicating that the markets willingness to chase the rise was limited. Contract positions continued to rise, with short positions concentrated in early May, and then long positions encountered reverse liquidation on May 12, reflecting the intensification of market divergence under high leverage. Overall, although prices have strengthened, market sentiment and capital momentum have not yet formed a consensus, and risk control and rhythm control are still the key to operation.
The quantitative analysis uses the moving average intensive breakthrough strategy for systematic parameter optimization and performance evaluation. In the 2-hour data of ETH/USDT, the annualized rate of return of the strategy is as high as 127.59%, which is much better than the -46.05% of the ETH Buy and Hold strategy in the same period. The strategy shows good trend-following ability and retracement control effect through momentum structure and trend filtering. However, in actual operation, it may still be affected by factors such as market fluctuations, extreme market conditions or signal failure. It is recommended to combine other quantitative factors and risk control mechanisms to improve the stability and adaptability of the strategy, and make rational judgments and respond cautiously.
References:
1. Gate.io, https://www.gate.io/trade/BTC_USDT
2. Gate.io, https://www.gate.io/trade/ETH_USDT
3.Coinglass, https://www.coinglass.com/LongShortRatio
4.Coinglass, https://www.coinglass.com/BitcoinOpenInterest?utm_source=chatgpt.com
5. Gate.io, https://www.gate.io/futures_market_info/BTC_USD/capital_rate_history
6. Gate.io, https://www.gate.io/futures/introduction/funding-rate-history?from=USDT-Mcontract=ETH_USDT
7.Coinglass, https://www.coinglass.com/pro/futures/Liquidations
8.Glassnode, https://studio.glassnode.com/charts/ba1ec93d-85 f 4-41 fe-5606-798 a 2 f 3001 3a? s= 1679144783u= 1742303183
Gate Research Institute is a comprehensive blockchain and cryptocurrency research platform that provides readers with in-depth content, including technical analysis, hot spot insights, market reviews, industry research, trend forecasts, and macroeconomic policy analysis.
Disclaimer
Investing in the cryptocurrency market involves high risks. Users are advised to conduct independent research and fully understand the nature of the assets and products purchased before making any investment decisions. Gate.io is not responsible for any losses or damages resulting from such investment decisions.


