


CoinW Research Weekly Report (Issue: March 16, 2026 - March 22, 2026)

CoinW Research Institute
Key Takeaways
The total global cryptocurrency market capitalization is $2.41 trillion, down approximately 5.12% from $2.54 trillion last week. As of press time, the cumulative total net inflow for U.S. Bitcoin spot ETFs is approximately $56.23 billion, with a net inflow of $95.18 million this week; the cumulative total net inflow for U.S. Ethereum spot ETFs is approximately $11.73 billion, with a net outflow of $59.94 million this week.
The total stablecoin market capitalization is $309.1 billion, remaining almost flat compared to last week. Among them, the market cap of USDT is $184.15 billion, accounting for 59.57% of the total stablecoin market cap, nearly unchanged from last week. Next is USDC with a market cap of $78.9 billion, accounting for 25.52% of the total stablecoin market cap, down about 1.01% from $79.1 billion last week. The market cap of DAI is $5.36 billion, accounting for 1.75% of the total stablecoin market cap, almost flat compared to last week.
According to data from DeFiLlama, the total DeFi TVL this week is $92.973 billion, down about 4.0% from $96.847 billion last week. Segmented by public chain, the three chains with the highest TVL are Ethereum, accounting for 58.57%; Solana, accounting for 7.02%; and BNB Chain, accounting for 5.80%.
On-chain data this week shows a trend of "diverging trading activity, overall decline in capital and users": In terms of daily on-chain DEX volume, Ethereum ($1.21B, +48.83%), Aptos ($0.024B, +46.62%), and TON saw growth, while Solana ($1.057B, -7.52%), BNB Chain ($0.653B, -17.03%), and Sui ($0.041B, -37.33%) declined. Transaction fees remained generally low, with most public chains around $0.01 or below, with Solana and Sui dropping to approximately $0.001. User and capital metrics generally weakened: Daily active addresses declined for Solana (3.584M, -17.41%) and Aptos (812K, -24.16%), with only TON showing slight growth (113K, +1.76%). TVL saw a broad pullback, with declines for Ethereum ($54.52B, -4.72%), Solana ($6.66B, -6.44%), BNB Chain ($5.41B, -7.72%), and others.
New Projects to Watch: Genpaid is a stablecoin payment and financial infrastructure platform for merchants and payment service providers, featuring a multi-chain (EVM, Solana, etc.) and non-custodial architecture where users always control their asset private keys and fund settlement. Current is a fintech company primarily providing mobile-based digital banking services, partnering with licensed banks to offer users account management, payments, debit cards, credit building, and early wage access. Myriad Markets is a blockchain-based decentralized prediction market platform that allows users to engage in "probability trading" around real-world events like crypto, politics, and sports, expressing expectations and earning returns by buying and selling shares of different outcomes.
I. Market Overview
1. Total Cryptocurrency Market Cap / Bitcoin Dominance
The total global cryptocurrency market cap is $2.41 trillion, down approximately 5.12% from $2.54 trillion last week.
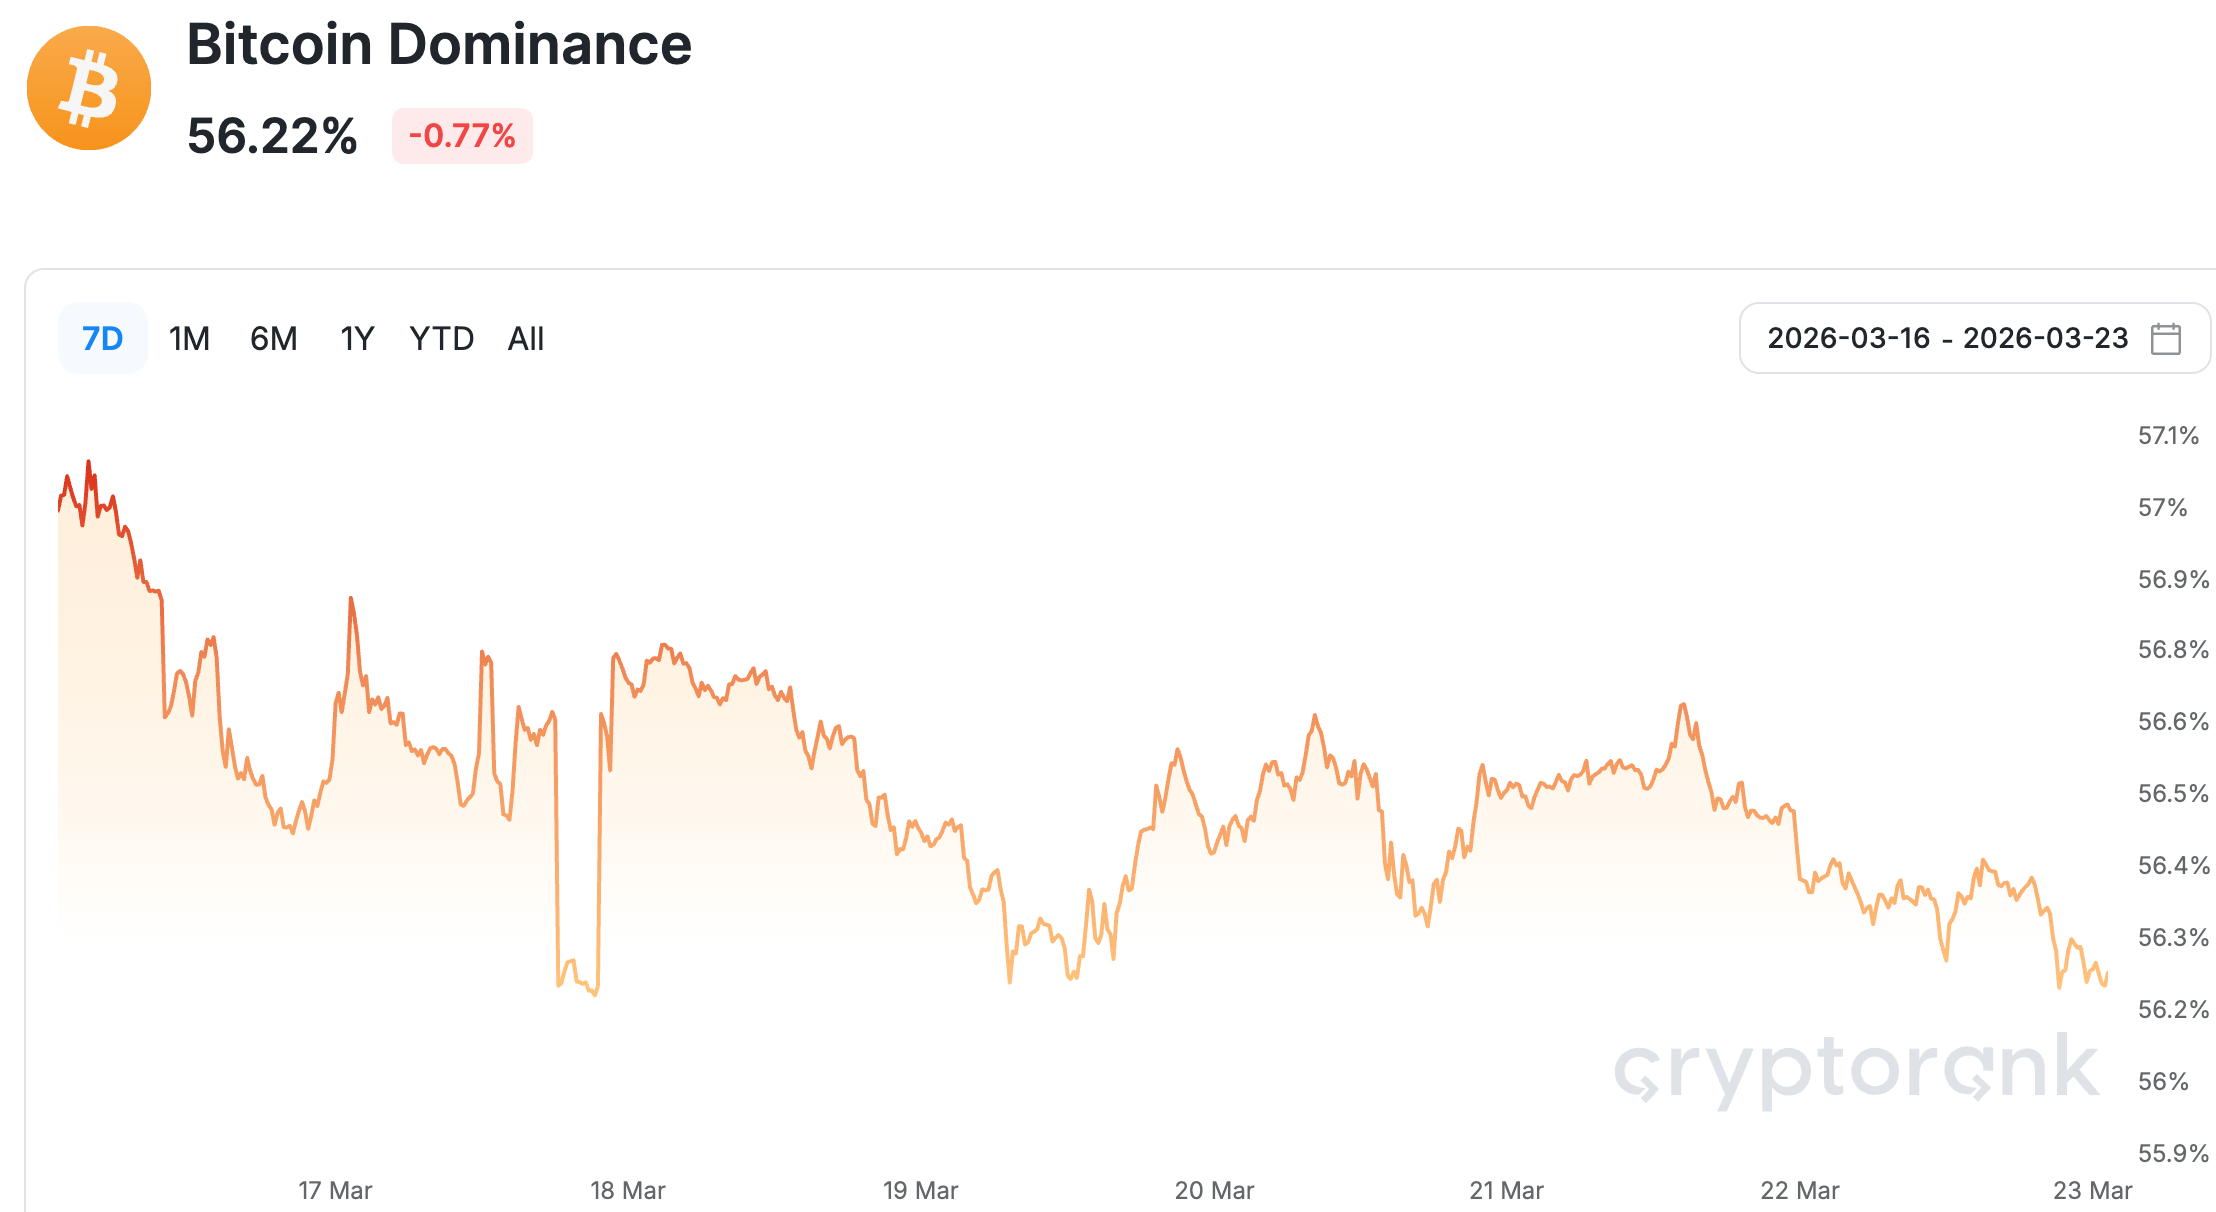
Data Source: Bitcoin dominance from cryptorank, https://cryptorank.io/charts/btc-dominance
Data as of March 22, 2026
As of press time, the market cap of Bitcoin is $1.35 trillion, accounting for 56.02% of the total cryptocurrency market cap. Meanwhile, the stablecoin market cap is $309.1 billion, accounting for 12.83% of the total cryptocurrency market cap.
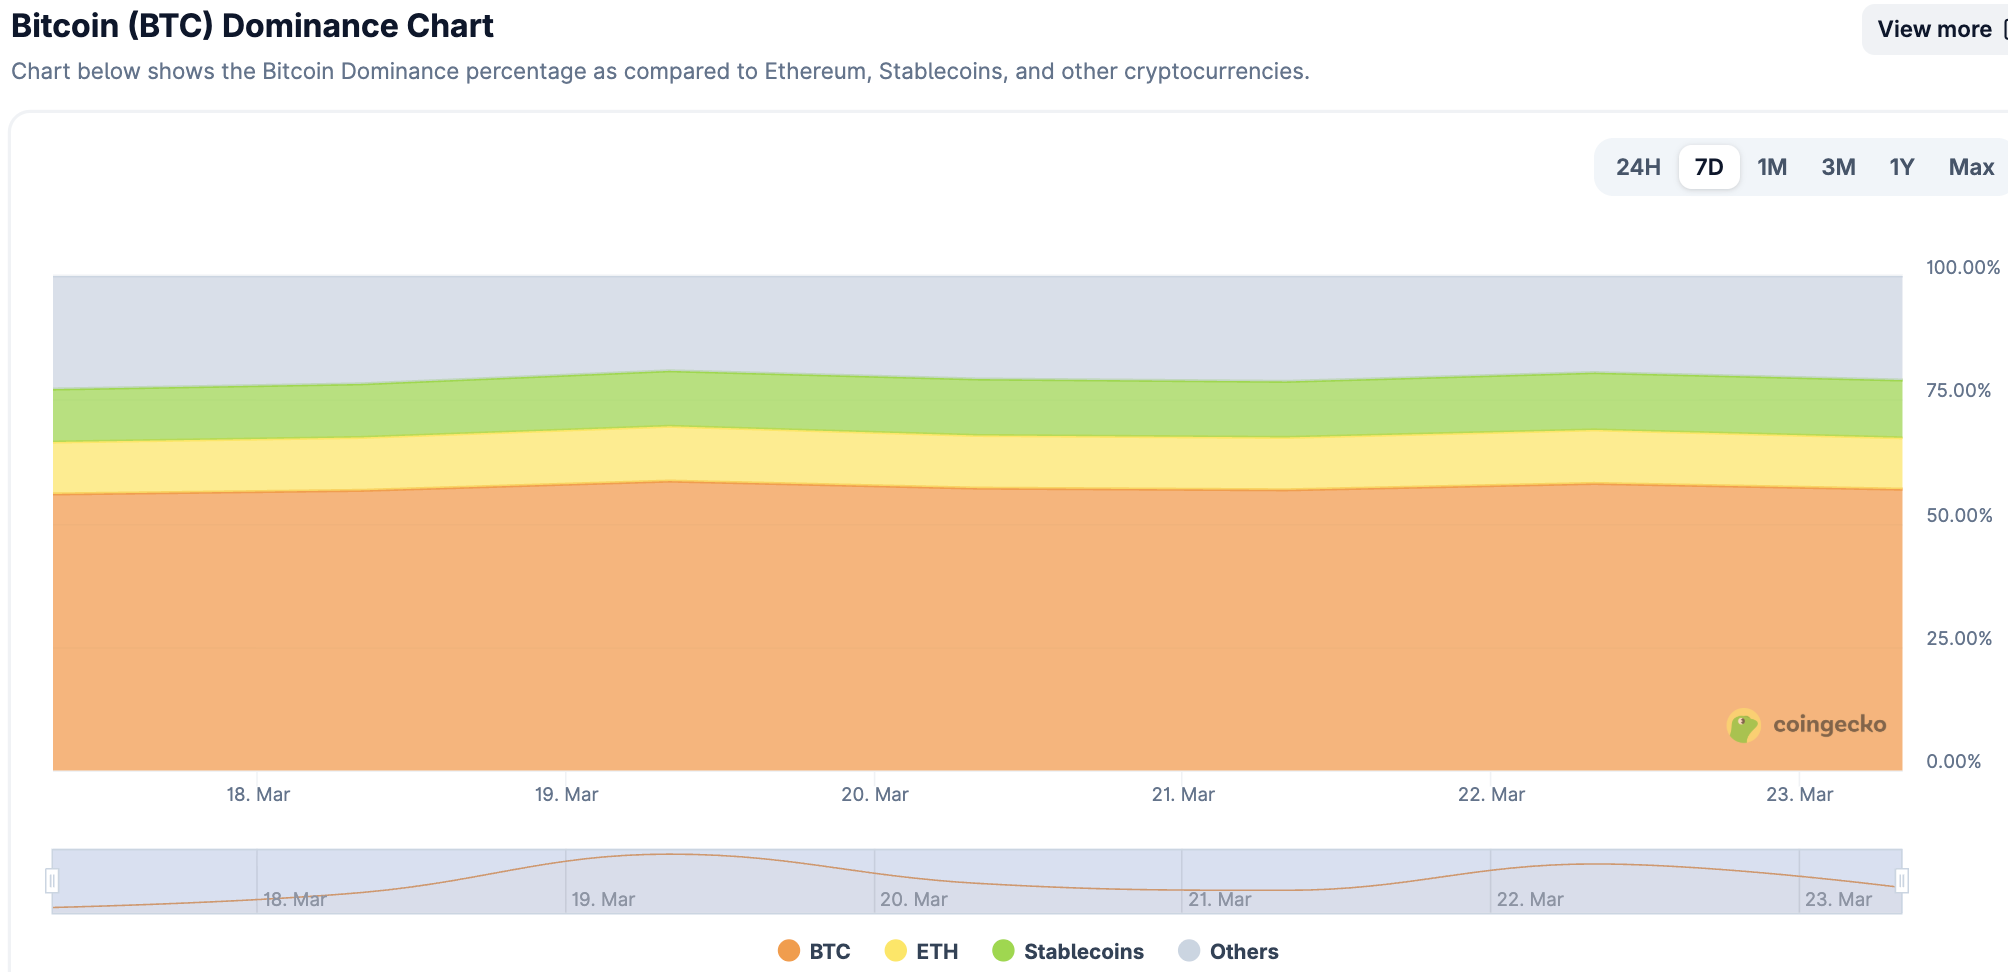
Data Source: coingecko, https://www.coingecko.com/en/charts
Data as of March 22, 2026
2. Fear & Greed Index
The Cryptocurrency Fear & Greed Index is 9, indicating Extreme Fear.
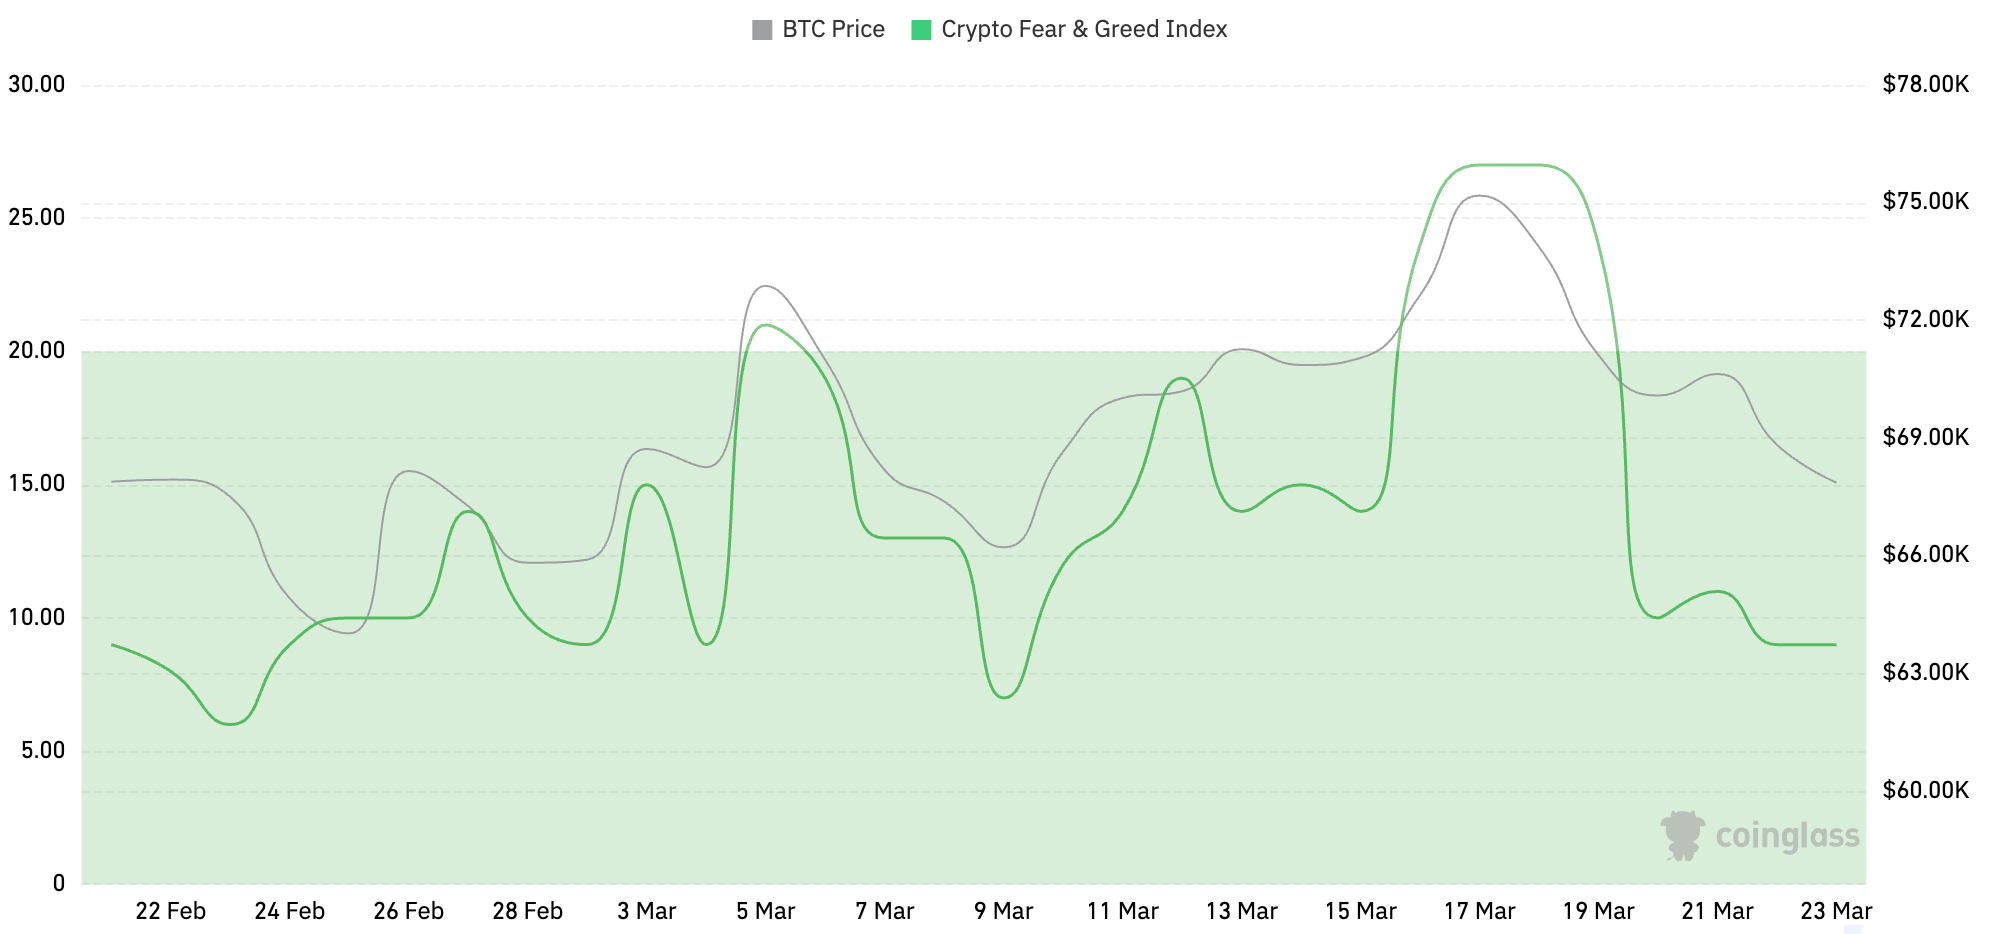
Data Source: coinglass, https://www.coinglass.com/pro/i/FearGreedIndex
Data as of March 22, 2026
3. ETF Inflow/Outflow Data
As of press time, the cumulative total net inflow for U.S. Bitcoin spot ETFs is approximately $56.23 billion, with a net inflow of $95.18 million this week; the cumulative total net inflow for U.S. Ethereum spot ETFs is approximately $11.73 billion, with a net outflow of $59.94 million this week.
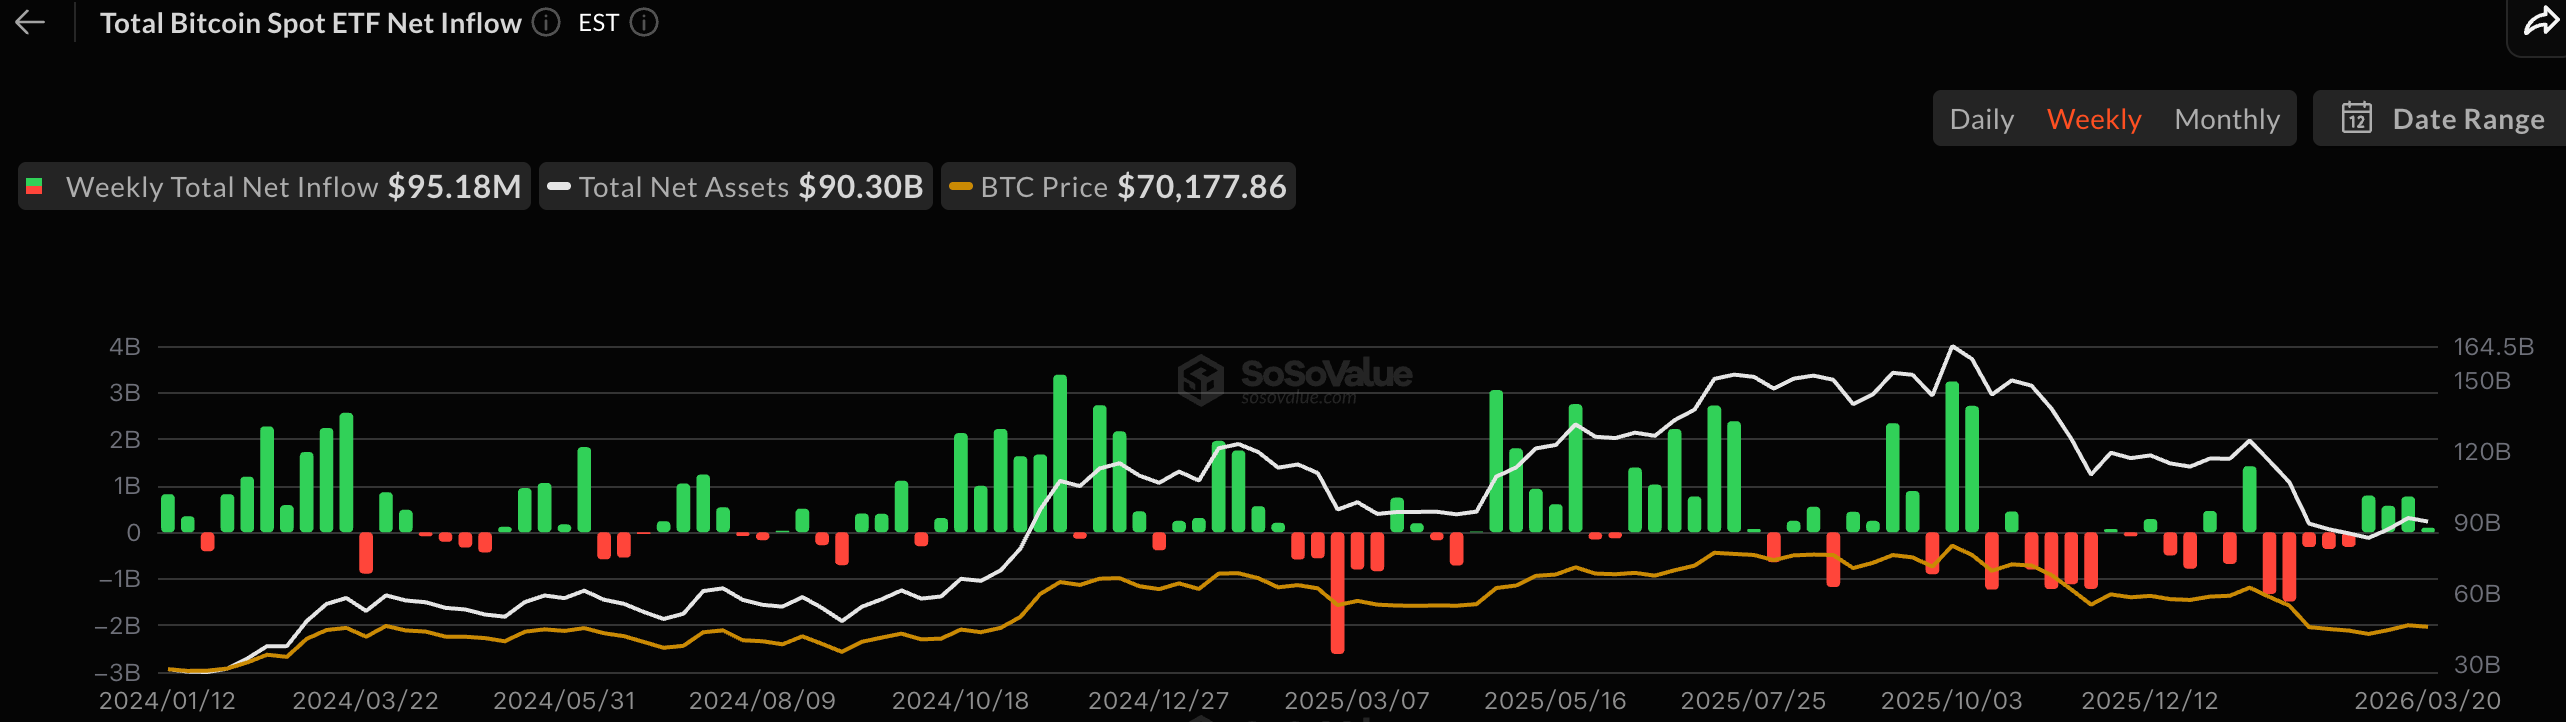
Data Source: sosovalue, https://sosovalue.com/zh/assets/etf
Data as of March 22, 2026
4. ETH/BTC and ETH/USD Exchange Rates
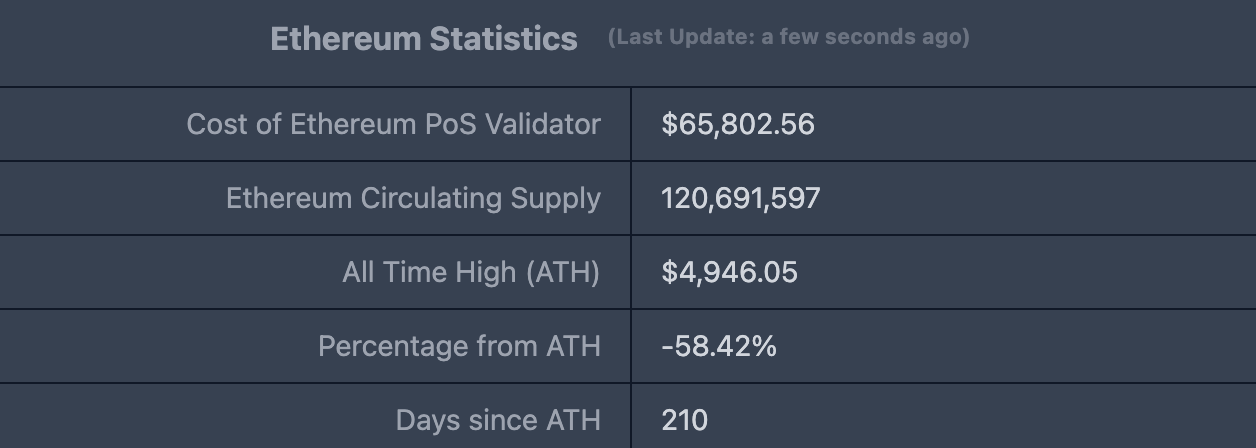
ETHUSD: Current price $2,056.33, all-time high $4,946.05, down approximately 58.42% from the ATH.
ETHBTC: Currently 0.030218, all-time high 0.1238.
Data Source: ratiogang, https://ratiogang.com/
Data as of March 22, 2026
5. Decentralized Finance (DeFi)
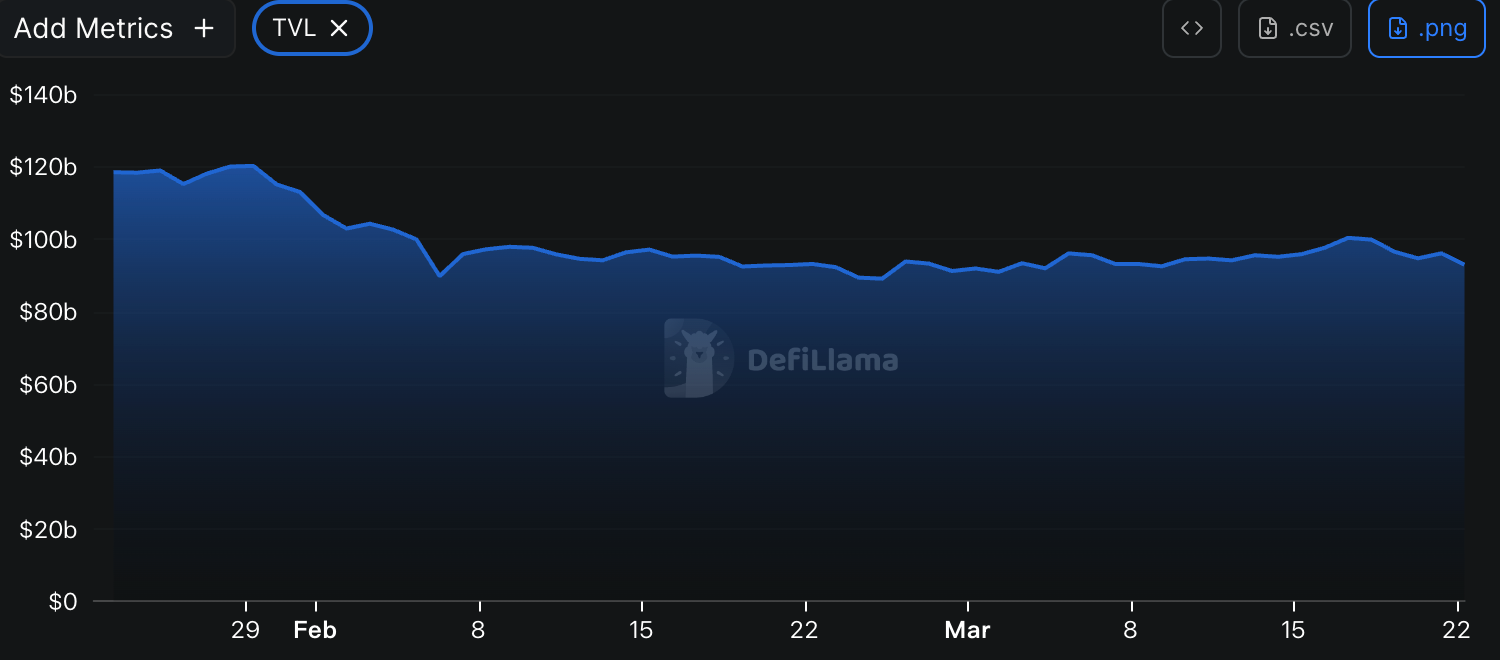
According to data from DeFiLlama, the total DeFi TVL this week is $92.973 billion, down about 4.0% from $96.847 billion last week.
Data Source: defillama, https://defillama.com
Data as of March 22, 2026
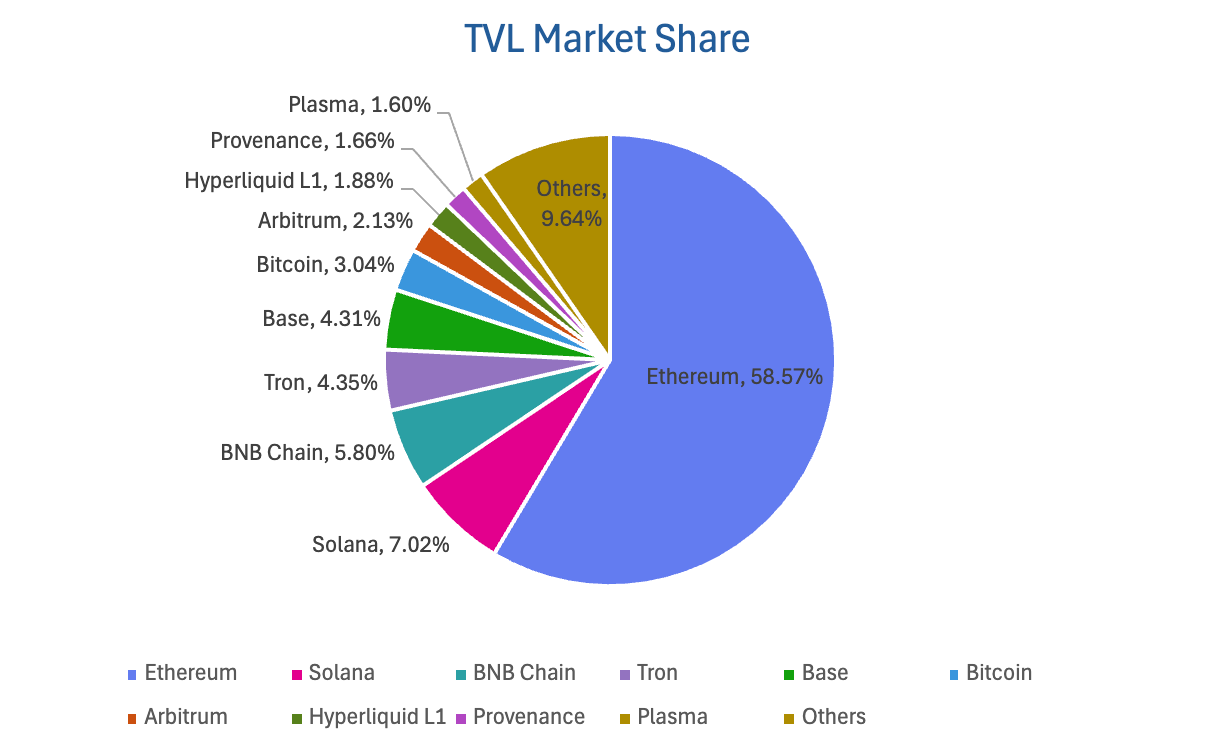
Segmented by public chain, the three chains with the highest TVL are Ethereum, accounting for 58.57%; Solana, accounting for 7.02%; and BNB Chain, accounting for 5.80%.
Data Source: CoinW Research Institute, defillama, https://defillama.com
Data as of March 22, 2026
6. On-Chain Data
Layer 1 Related Data
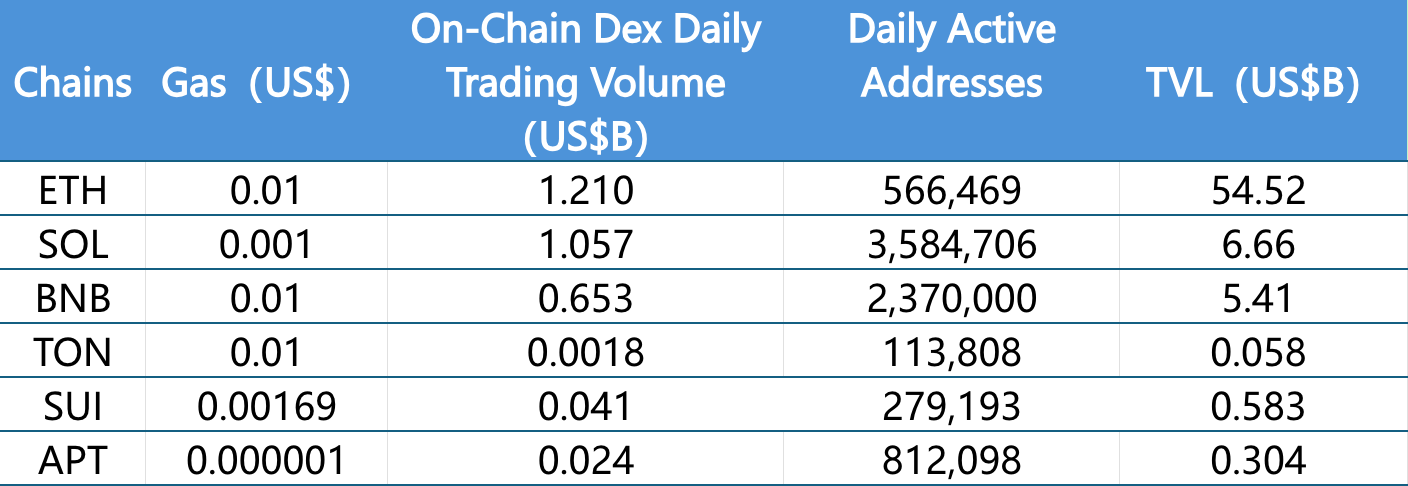
Analysis of current key data for major Layer 1s including ETH, SOL, BNB, TON, SUI, and APTOS, focusing on daily trading volume, daily active addresses, and transaction fees.
Data Source: CoinW Research Institute, defillama, https://defillama.com
Data as of March 22, 2026
On-Chain DEX Daily Volume & Transaction Fees: On-chain DEX daily volume and transaction fees are core metrics for measuring public chain activity and user experience. In terms of daily on-chain DEX volume this week, Ethereum ($1.21B, +48.83%), TON ($0.0018B, +15.69%), and Aptos ($0.024B, +46.62%) increased; other chains declined: Solana ($1.057B, -7.52%), BNB Chain ($0.653B, -17.03%), and Sui ($0.041B, -37.33%). Regarding transaction fees, Ethereum, BNB Chain, and TON remained around $0.01 this week; Solana ($0.001) decreased by 3.77% from last week; Sui ($0.00169) decreased by 17.26%; Aptos ($0.000001) decreased by 2.70%.
Daily Active Addresses & TVL: Daily active addresses reflect ecosystem participation and user stickiness of a public chain, while TVL reflects user trust in the platform. For daily active addresses, Aptos (812K), Sui (279K), and Solana (3.584M) decreased by 24.16%, 12.22%, and 17.41% week-over-week respectively; Ethereum (566K, -1.65%) and BNB Chain (2.37M, -5.20%) saw slight pullbacks; TON (113K, +1.76%) increased slightly. TVL saw a slight overall pullback this week: Sui ($0.583B, -5.66%), Solana ($6.66B, -6.44%), Ethereum ($54.52B, -4.72%), BNB Chain ($5.41B, -7.72%), Aptos ($0.304B, -5.59%), and TON ($0.058B, -3.38%).
Layer 2 Related Data
According to L2Beat data, the total Ethereum Layer 2 TVL this week is $31.54 billion, down 5.02% overall from $33.21 billion last week.
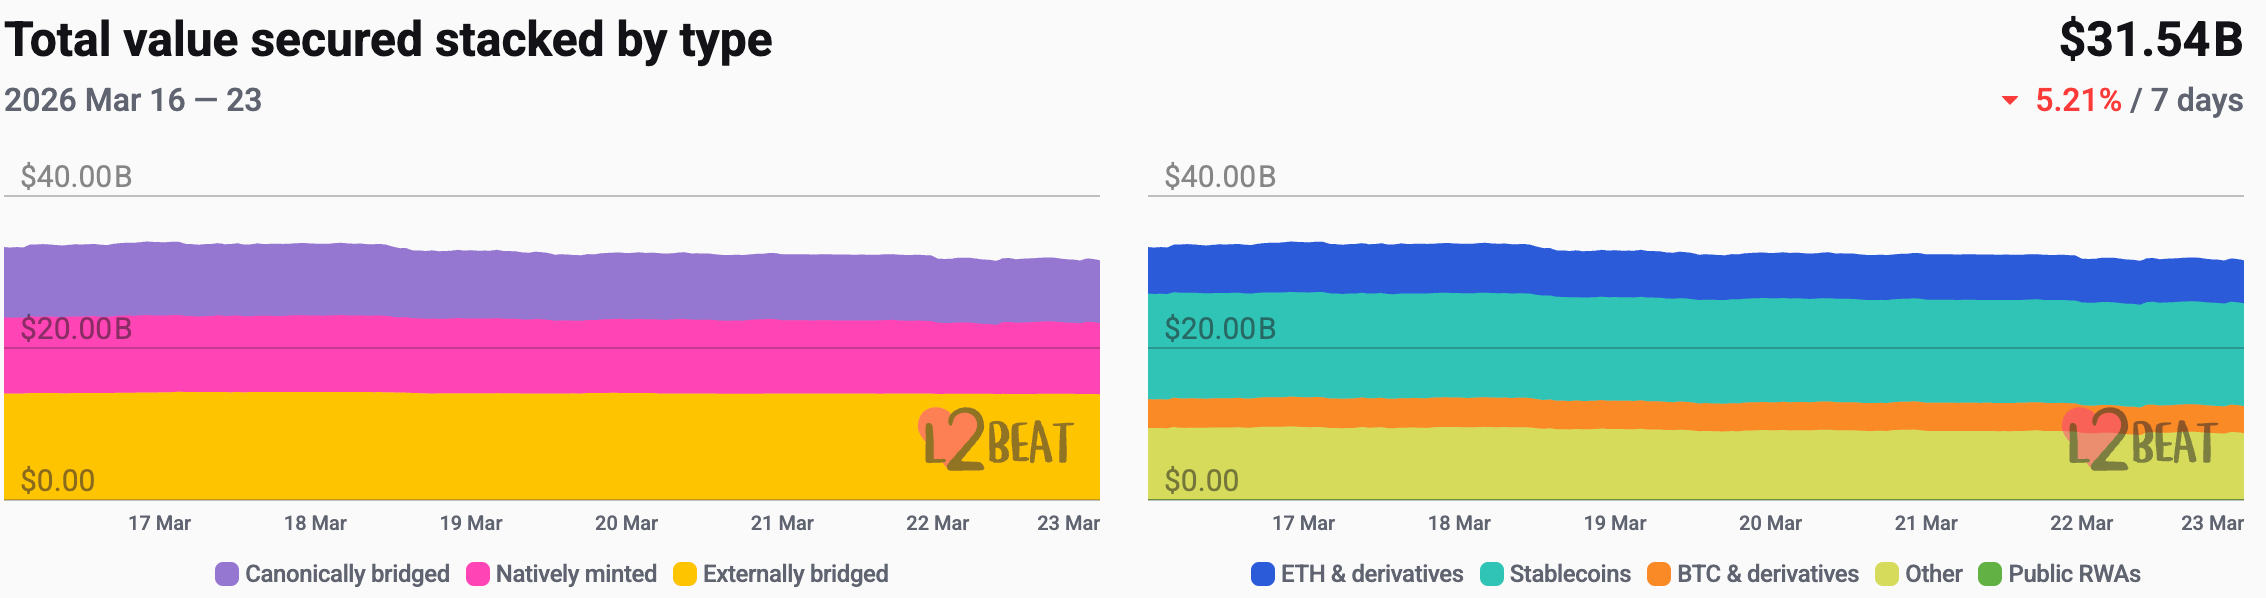
Data Source: L2Beat, https://l2beat.com/scaling/tvs
Data as of March 22, 2026
This week, Base and Arbitrum hold market shares of 35.05% and 17.25% respectively, ranking first and second.
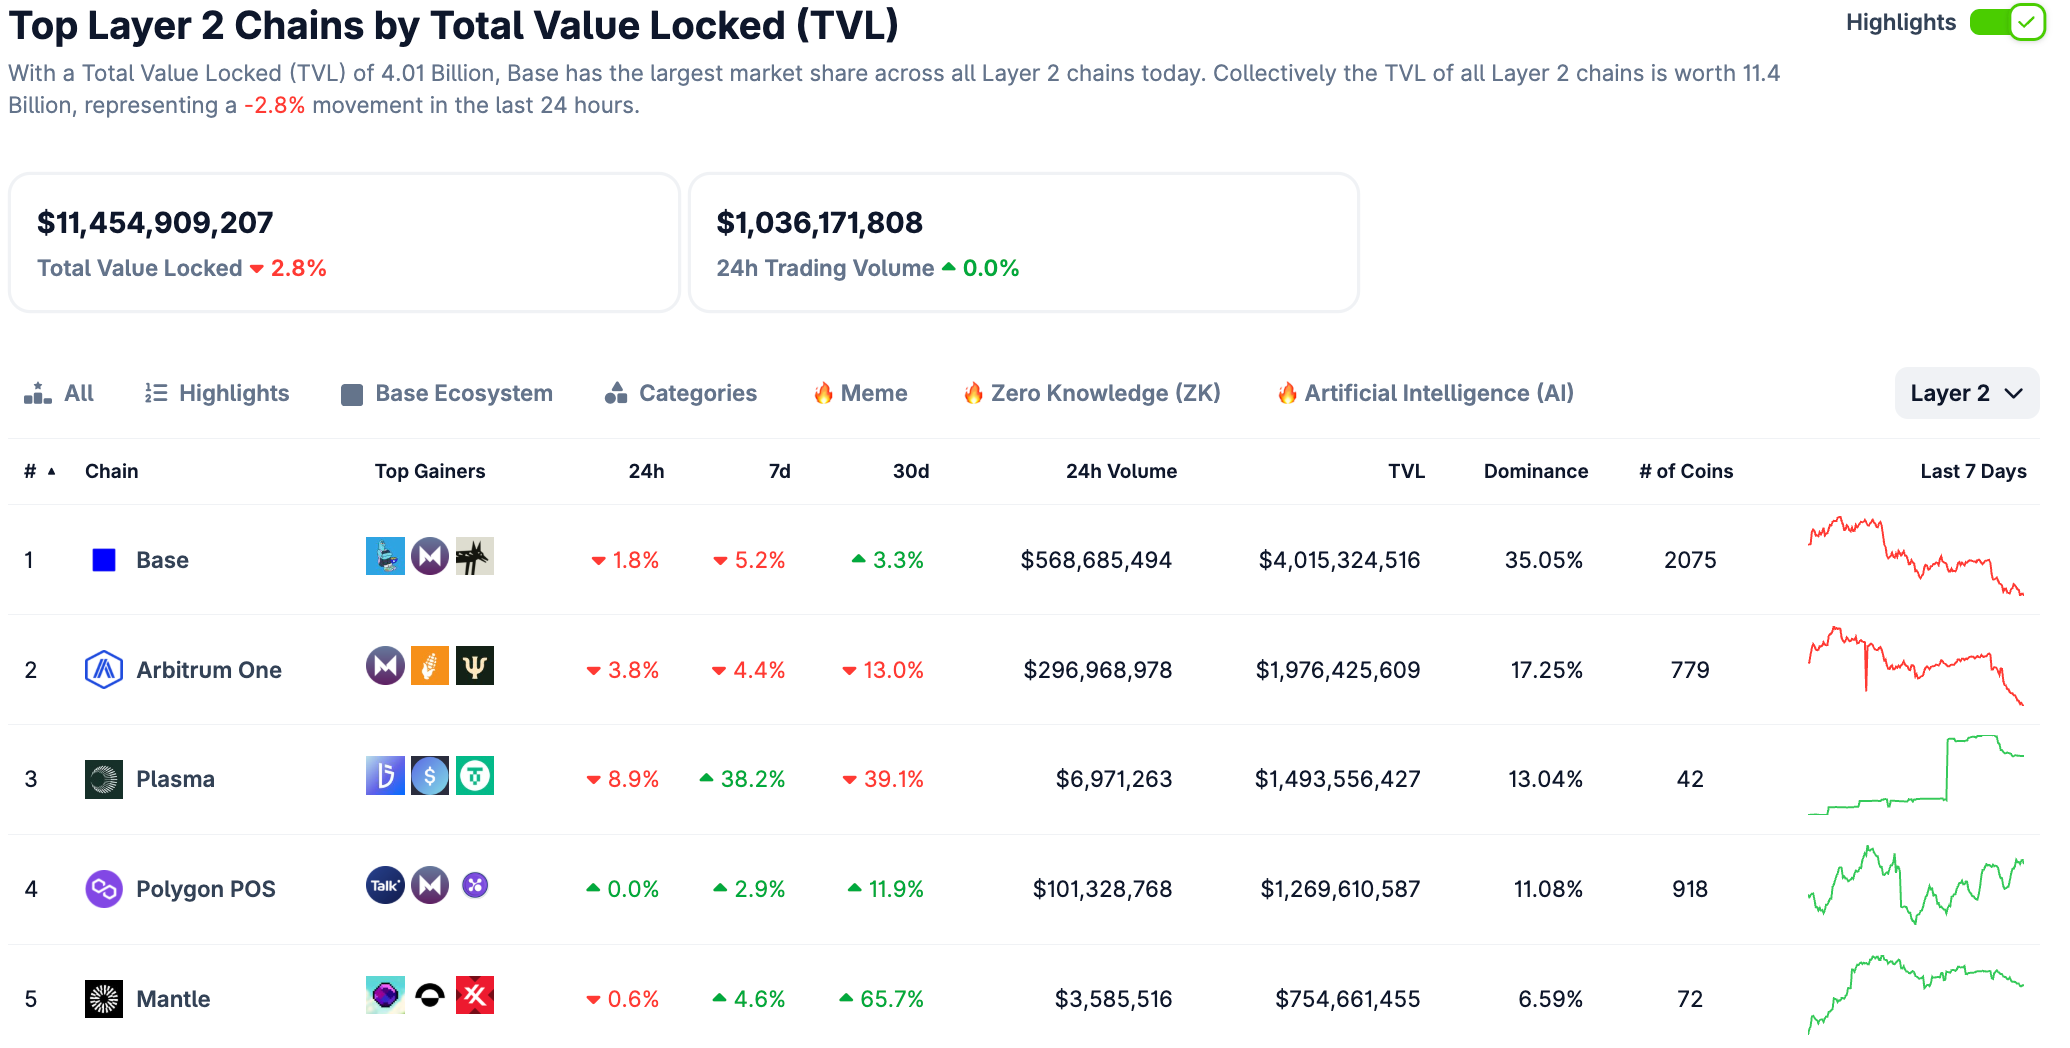
Data Source: CoinGecko, https://www.coingecko.com/en/chains/layer-2
Data as of March 22, 2026
7. Stablecoin Market Cap & Issuance
According to Coinglass data, the total stablecoin market cap is $309.1 billion, up about 0.25% from $308.3 billion last week. Among them, the USDT market cap is $184.15 billion, accounting for 59.57% of the total stablecoin market cap, up about 0.05% from $184.06 billion last week. Next is USDC with a market cap of $78.9 billion, accounting for 25.52% of the total stablecoin market cap, down about 1.01% from $79.1 billion last week. The DAI market cap is $5.36 billion, accounting for 1.75% of the total stablecoin market cap, almost flat compared to $5.37 billion last week.
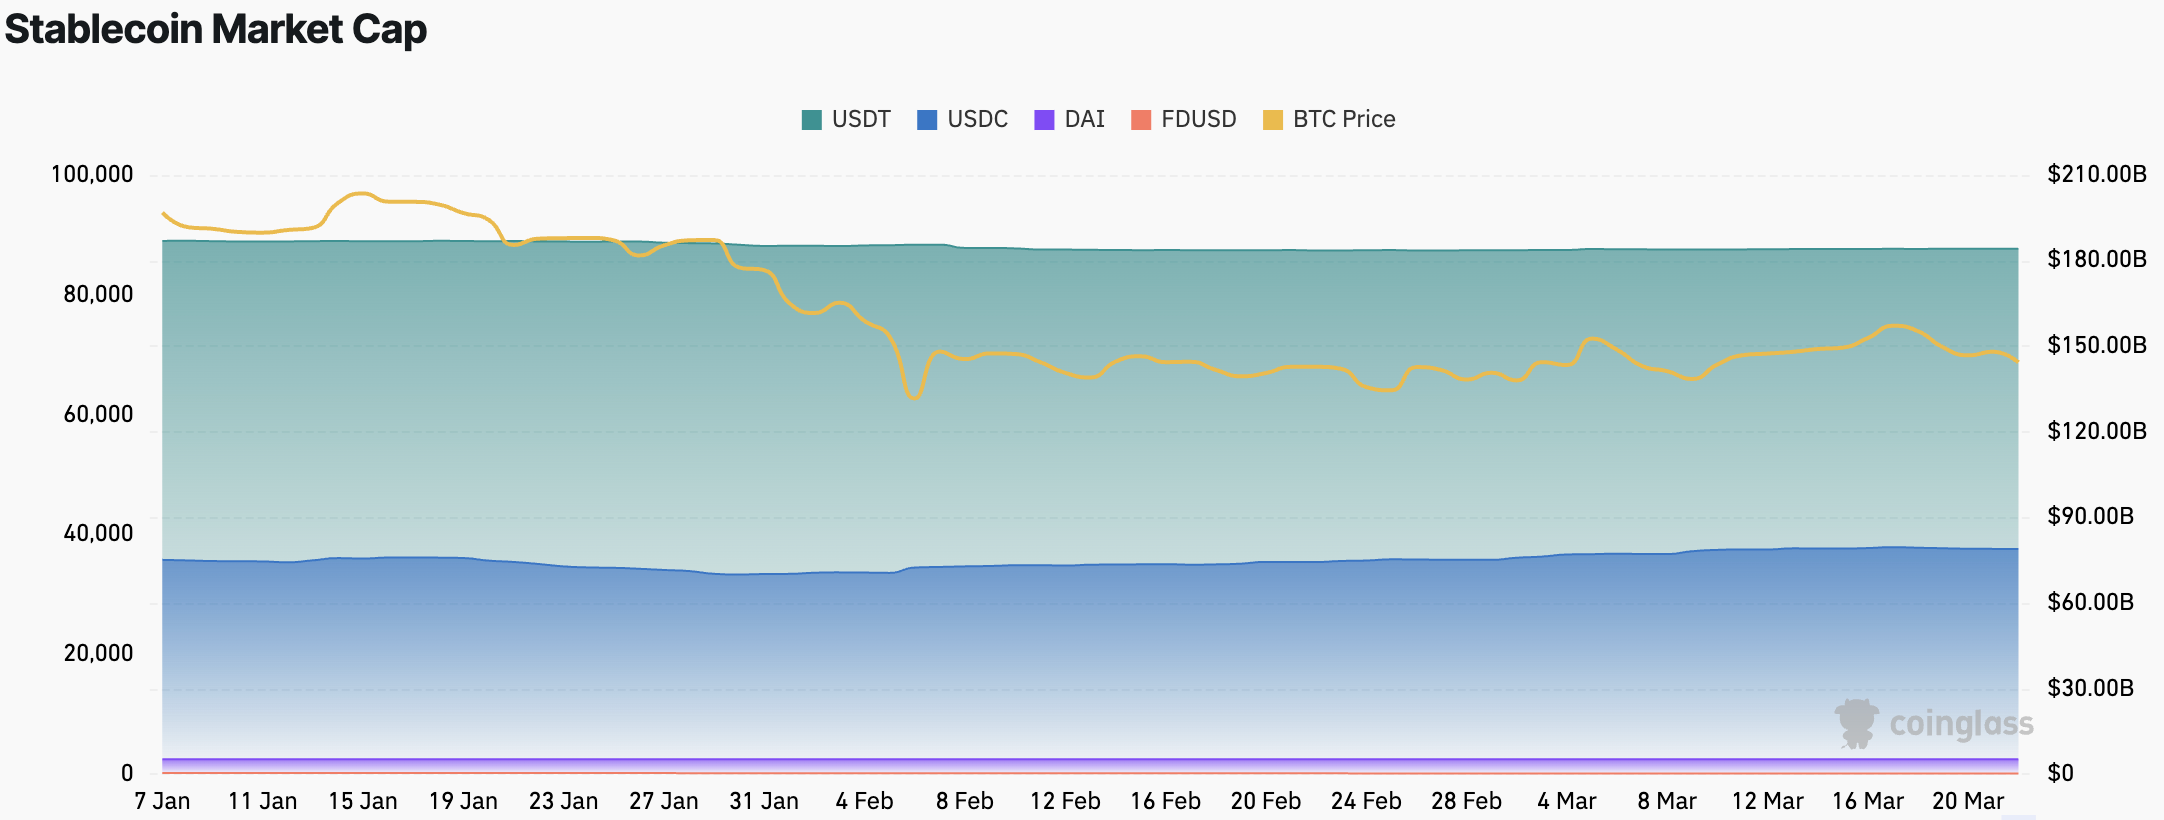
Data Source: CoinW Research Institute, Coinglass, https://www.coinglass.com/pro/stablecoin
Data as of March 22, 2026
According to Whale Alert data, the USDC Treasury issued a total of 3.931 billion USDC this week, and the Tether Treasury issued a total of 1 billion USDT this week. The total stablecoin issuance this week is 4.931 billion, down 6.99% from last week's total issuance (5.302 billion).