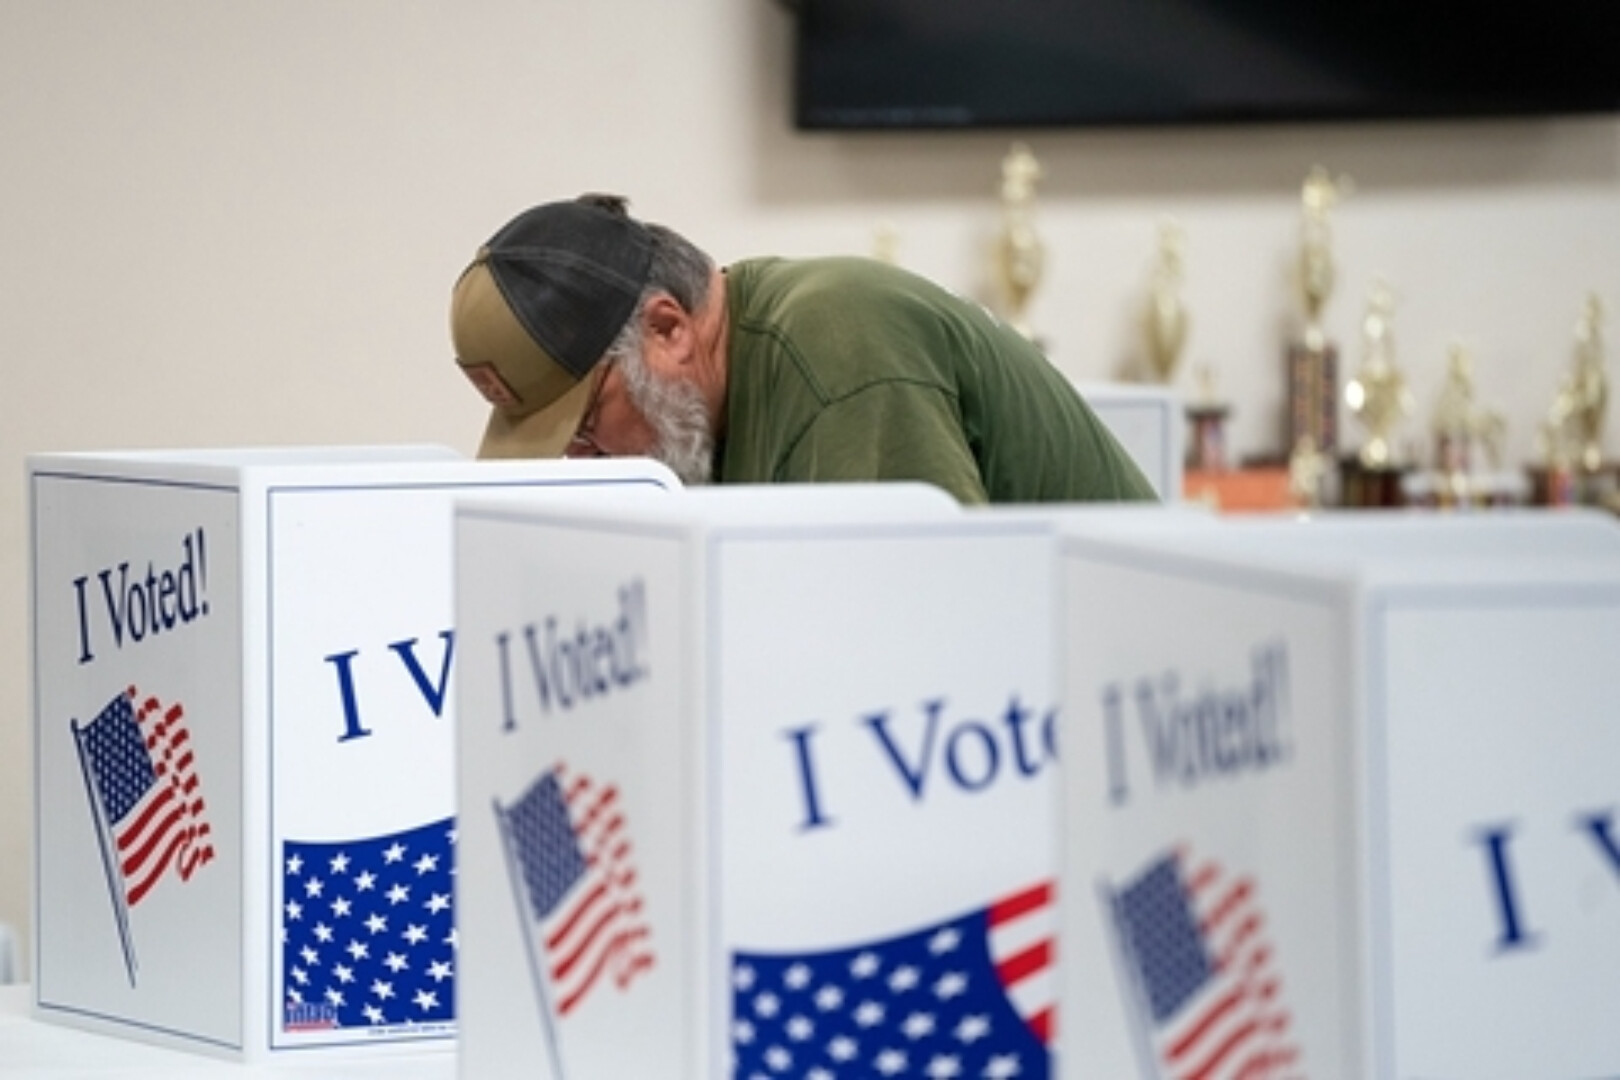


Midterm elections are approaching, and what the U.S. stock market is really trading is not who wins

Original Title: Midterm Elections and the Markets: What History Says About 2026
Original Author: James Zahansky
Editor's Note: With just over a month to go until the U.S. midterm elections on November 3, political uncertainty has once again become a market variable. All House seats will be up for re-election, and control of the Senate also faces a reshuffling, as markets begin to price in potential changes to fiscal, regulatory, and policy paths that the future congressional structure may bring.
But from a historical data perspective, midterm elections themselves are not a simple "bearish event." According to J.P. Morgan Asset Management statistics, since 1937, the S&P 500 has averaged a 9.2% gain in midterm election years, below the 13.3% average in other years, but average returns have still been positive. The more pronounced characteristic is not decline, but greater volatility and gains skewed toward the second half.
James Zahansky, Chief Strategist at WHZ Strategic Wealth Advisors, argued in an article published on September 25 that what truly affects the market in midterm elections is more the uncertainty before the election, rather than the victory of any particular party itself. As results gradually become clear, the political risk premium may decline, and the market returns to more core pricing variables such as interest rates, corporate earnings, and the economic cycle.
For the current market, this distinction is especially important. In 2026, U.S. equities face multiple variables simultaneously, including interest rate repricing, energy prices, geopolitics, and AI capital expenditure. If year-end market performance is simply attributed to the midterm elections, it is easy to overestimate the explanatory power of the political event itself.
The following is a translation of the original article:
With just over a month to go until the U.S. midterm elections, the market is entering what is traditionally known as a "political trading" window.
But historical data shows that midterm elections do not inherently correspond to U.S. stock market declines. According to J.P. Morgan Asset Management statistics, since 1937, the S&P 500 has averaged a 9.2% gain in midterm election years, compared with an average gain of 13.3% in other years. Returns in midterm election years are relatively weaker, but the long-term average remains positive.
The truly more stable characteristic is greater volatility and a more concentrated market rally in the fourth quarter.
The Typical Path of Midterm Election Years: Weaker in the First Three Quarters, Rebound in Q4
From a quarterly performance perspective, seasonality in midterm election years is even more evident.
J.P. Morgan statistics show that historically, the S&P 500 has averaged slightly negative performance in the first three quarters of midterm election years, but has averaged a 6.6% gain in the fourth quarter. Capital Group data shows that since 1950, in the 12 months following the end of midterm elections, the S&P 500 has averaged a 15.4% gain.
This set of data is easily interpreted as "U.S. stocks rise after the election ends," but a more accurate understanding is: as the election approaches, uncertainty is gradually absorbed by the market, and the risk premium may decline accordingly.
Before the election, the market needs to price in future congressional control, fiscal policy, and regulatory paths; once these variables gradually become clear, the impact of political uncertainty itself on asset prices tends to weaken.
But historical patterns do not equal trading formulas.
In 2018, the S&P 500 fell 4.4% for the full year, and in 2022, total returns fell even further by 18.1%. Both were also midterm election years, but the core variables affecting the market included Fed tightening, inflation, and rapidly rising interest rates, respectively. The original article therefore emphasizes that the simultaneous occurrence of elections and market declines does not mean that the elections themselves caused the declines.
What the Market Trades Is the Policy Path, Not Party Labels
Another focal point of the 2026 elections is the potential change in congressional control.
At the time this article was published, Republicans controlled both the Senate and the House with a narrow majority, meaning any change in seats could alter the legislative environment for the next two years. If the White House and Congress are controlled by different parties, the most direct impact is usually not the direction of the stock market, but increased difficulty in advancing policy.
Major fiscal plans, tax adjustments, and some regulatory agendas may become harder to pass; at the same time, the importance of issues such as congressional hearings, budget negotiations, and the debt ceiling may rise. The original article argues that if a divided government emerges, the policy level is more likely to enter a state of "gridlock."
But this does not mean that political gridlock itself is bullish for stocks. Capital Group's analysis of long-term historical data shows that regardless of unified government, divided Congress, or Congress controlled by the opposition party to the president's party, the S&P 500 has recorded double-digit average returns.
What this set of data better demonstrates is: party control itself can hardly explain long-term U.S. stock market trends on its own.
The same political structure may correspond to completely different inflation, interest rates, corporate earnings, and economic cycles. For the market, what truly matters is not "who controls Congress," but whether the new political structure substantially changes fiscal, regulatory, and growth expectations.
What Matters More Than Elections Is Still Interest Rates and Earnings
This is also the most core market judgment of the original article.
Midterm elections can influence policy expectations, but rarely determine a complete market cycle on their own.
For stock valuations, the focus ultimately returns to several more direct variables: whether corporate earnings can grow, what level the risk-free rate is at, whether the economy remains in expansion, and how high a valuation multiple investors are willing to assign.
This is also why the historical patterns of midterm elections need to be used with caution.
Over the past few decades, the label "midterm election year" has simultaneously covered completely different economic environments. In 2018, the market faced Fed rate hikes and tightening financial conditions, while in 2022, it was high inflation and an aggressive tightening cycle. Even if the election timing is exactly the same, the macroeconomic environment in which the market finds itself can be completely different.
Therefore, if a fourth-quarter rally emerges again this year, it cannot be simply attributed to the elections. A more reasonable explanation is: declining election uncertainty may become a marginal positive, but whether the rally can be sustained still depends on whether fundamentals can cooperate.
Whether the Year-End Rally Can Continue Depends on Three Key Variables
From now until the end of the year, what is truly worth tracking is not a single election result, but three variables.
The first is interest rates.
If U.S. Treasury yields continue to rise rapidly, stock valuations will still face pressure; if interest rate volatility declines, discount rate pressure eases, and risk assets will gain a better valuation environment.
The second is corporate earnings.
Whether the historical post-election rally can repeat in 2026 ultimately requires earnings growth support. If earnings expectations continue to be revised upward, the market can more easily digest political and macroeconomic volatility; if the earnings cycle weakens, seasonality alone will be difficult to sustain the rally.
The third is whether policy truly changes cash flow expectations.
Election results have market significance not because of party labels themselves, but because they may change taxes, fiscal spending, trade policy, regulation, and debt ceiling negotiations, thereby further affecting corporate profits, inflation, and interest rates.
This is also the framework that midterm election historical data truly provides: before the election, the market trades uncertainty; after the election, the market trades fundamentals again.
Whether this year will replicate the fourth-quarter rally of the past, the ultimate determining factor is still not who wins on November 3, but whether interest rates, earnings, and economic data can continue to support current asset prices after the election.