

Anthropic's November: Quarterly revenue of $16.8 billion, IPO launch as early as the week of November 9

Last night's closed-door meeting in San Francisco made its purpose plain: to win support for next month's IPO. Anthropic brought potential public-market investors into its headquarters and spent an entire day laying out its safety philosophy, growth trajectory, and efficiency improvements. In a week when AI stocks had just sold off sharply and warning bells were ringing across credit markets, this briefing delivered more than a set of revenue figures — it was a public test of the AI commercialization story.
1. Three Quarters of Revenue Steps
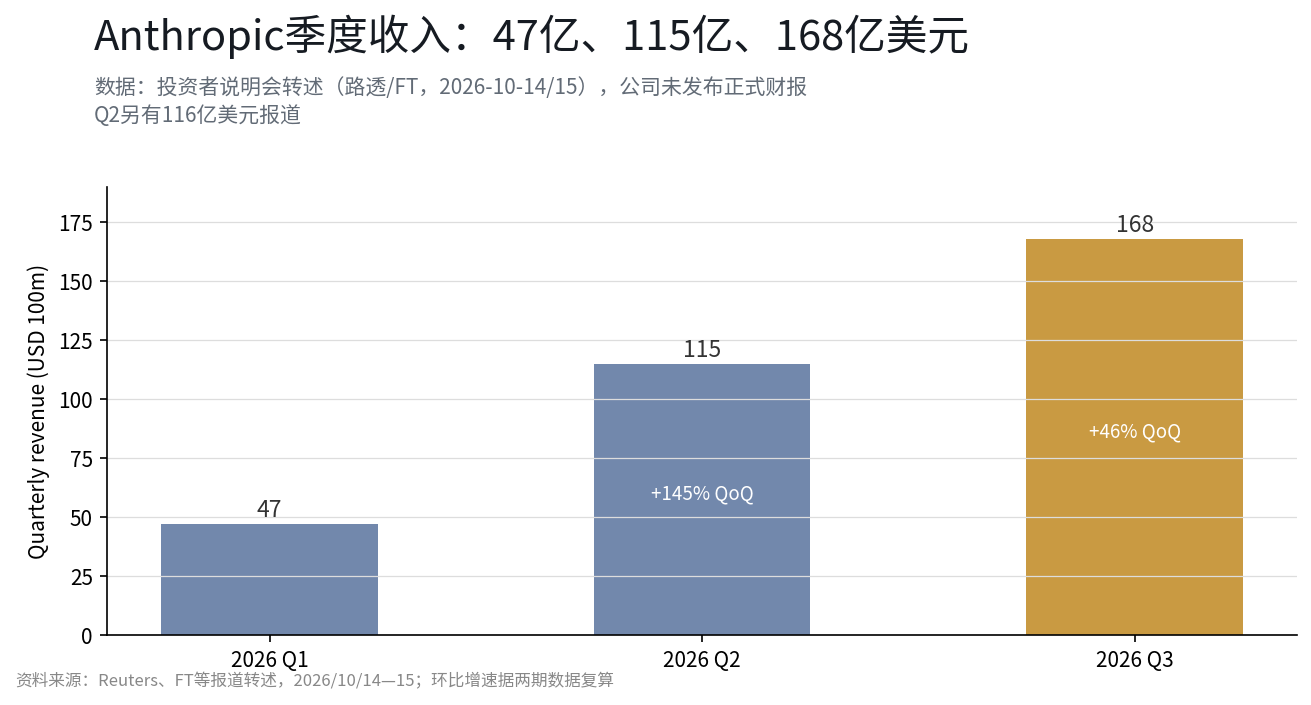
Line up the numbers across three quarters like a staircase: $4.7 billion, roughly $11.5 billion, $16.8 billion. On that basis, the annualized revenue run rate is already about $67 billion; and according to The Information, third-quarter revenue reached more than 3.6 times the full year of 2025 — in other words, an entire year of 2025 revenue amounts to less than a third of a single quarter now.
Reading the quarter-over-quarter growth rate requires two perspectives. From the top down, the roughly 145% QoQ growth in Q2 was driven by demand for products like Claude Code — a steep climb off a low base — while Q3's roughly 46% was built on a high base, so the deceleration is an arithmetic result; from the bottom up, 46% QoQ means that if Q4 sustains a similar pace, full-year revenue could exceed $40 billion — a level already above the range most Wall Street institutions had previously expected for AI application-layer revenue (public reporting shows wide divergence among institutional forecasts). What really needs tracking is Q4: whether QoQ growth can hold around 40% will determine whether the claim that "efficiency improvements underpin growth" is delivered or fades.
2. What's In "Adjusted Profitability" and What's Missing
The briefing offered two profitability statements: adjusted profitability, and positive cash flow for the quarter. The former should be discounted — "adjusted" typically excludes certain cost items (common adjustments for such companies include stock-based compensation and restructuring charges), but Anthropic did not disclose the specific adjustments, and GAAP earnings figures will have to wait for formal financials; the latter is more solid: for a company that lists chips and data centers as its largest expenses, positive quarterly cash flow means revenue growth at least covered the cash burn of compute expansion in the period.
What's still missing? Three things: GAAP profitability and gross margin levels; the scale of compute procurement commitments with cloud providers (which determines the rigidity of future cash outflows); and the composition of revenue — how much comes from subscriptions, API, and product revenue respectively, and how high the enterprise customer share is. These three gaps can only be filled once the S-1 is formally disclosed, and they are the inputs institutions most need when pricing this company.
3. Putting $2 Trillion Back Into a Coordinate System
To translate the revenue figures from the briefing into pricing, there's no way around a coordinate question. First lay out the historical valuation steps: the March 2025 funding round carried a post-money valuation of $61.5 billion; in September 2025, a $13 billion raise closed at a post-money valuation of $183 billion (per Reuters and WSJ); in February 2026, the valuation rose further to $380 billion (per public reporting); and the current IPO valuation discussion sits above $2 trillion — from $380 billion to $2 trillion is a gap of more than five times.
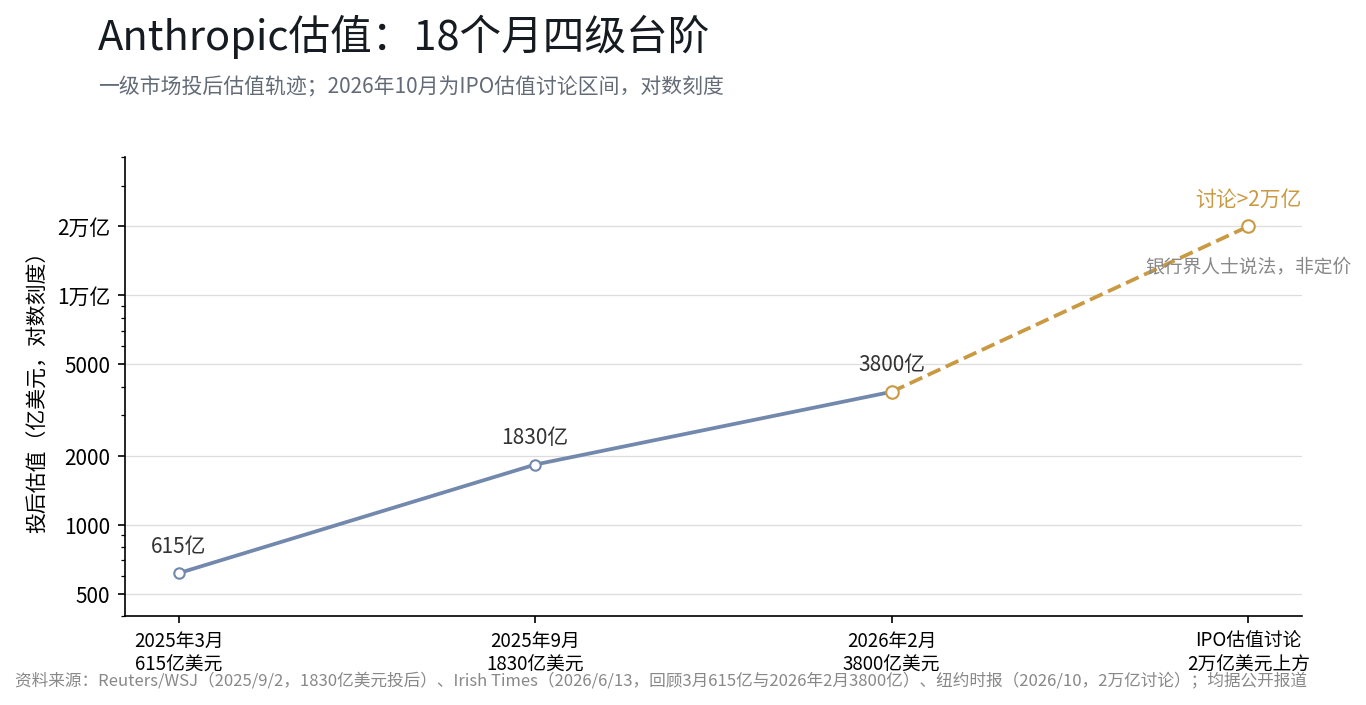
Multiples can help gauge the weight of these numbers. Based on Q3's $16.8 billion, annualized revenue is about $67 billion: the $2 trillion discussion range implies roughly 30 times annualized revenue, while the February $380 billion valuation corresponds to about 6 times — the same denominator, two very different prices, which is precisely the question the briefing sought to answer with its "revenue staircase." Now find a public-market reference: Nvidia's latest market cap is about $5.33 trillion, with revenue of about $253.5 billion over the past four quarters, a price-to-sales ratio of about 21 times; the two have different denominators (one is an annualized estimate, the other disclosed actuals), so this can only be a rough comparison, but the direction is clear: the discussion range implicitly assumes "high growth continues into the visible future," and any reading below that expectation could be amplified at a 30x multiple.
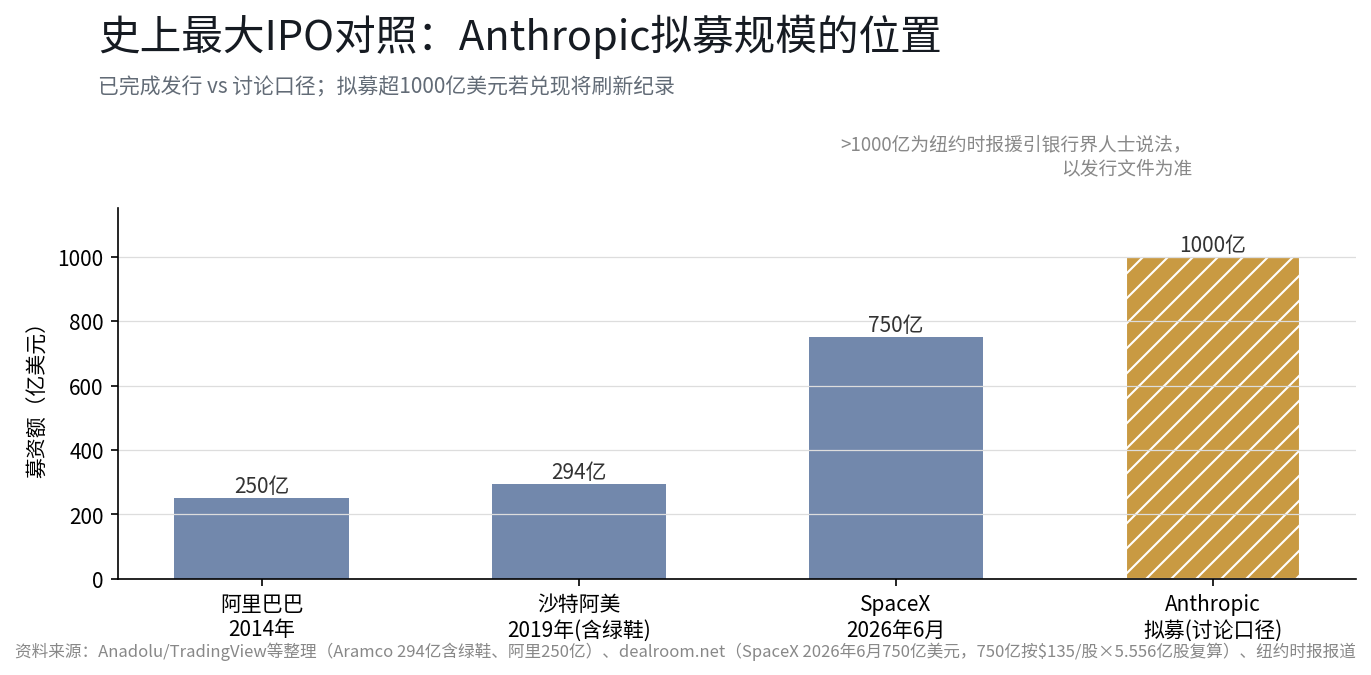
Deal size also needs a coordinate system. The largest IPO in history currently belongs to SpaceX — in June 2026, it issued about 555.6 million shares at $135 apiece, raising $75 billion; before that came Saudi Aramco's $29.4 billion (including the greenshoe, 2019–2020) and Alibaba's $25 billion (2014). If Anthropic raises more than $100 billion, it could break the record just set this June; $100 billion is also roughly 5% of a $2 trillion valuation, and the dilution scale of the offering itself and the market's absorption capacity are real constraints the buy side will need to digest (historical records do not constitute a prediction of this offering's outcome).
4. November Offering Details: What We Know So Far
Lay out the reported arrangements in chronological order: on June 1, a confidential S-1 filing with the U.S. SEC (per Yahoo Finance); on October 14, the San Francisco investor briefing, presenting to potential public-market investors throughout the day (per FT and others); as early as the week of November 9, the formal roadshow launch (per Yahoo Finance citing Bloomberg); targeting a listing before Thanksgiving and completion of the IPO before year-end — the timetable may still change (per The Wall Street Journal). On size, The New York Times cited banking sources saying the raise could exceed $100 billion, with valuation discussion above $2 trillion; if realized, that scale could break the issuance record SpaceX set this June (see the comparison in the previous section).
Viewing this timetable alongside the state of the market, the choice is not an easy one: the issuance window coincides with a sharp selloff in the AI sector and widening credit spreads. But from another angle, the briefing's concentrated disclosure of revenue and profitability progress is precisely meant to give subscribers support in a weak window. For secondary-market investors, once listed, this company will become the first directly tradable "pure AI model layer" asset, and its offering price and early post-listing performance (early price volatility will be worth watching) will become a new reference for the entire sector; shifts in the mix of subscription, API, and product revenue can serve as one of the metrics to watch going forward.
5. Reading It Against Last Night's Tape
Last night's market gave this report card a subtle background note: on the same day, CoreWeave's bond yields approached 15%, AI-related industrial stocks fell broadly, and the credit market questioned the "borrow to build AI" model; yet what Anthropic disclosed was precisely data showing high revenue growth and positive cash flow. The two pricings are not contradictory — the revenue belongs to the model company, the interest belongs to the debt-funded builders. According to disclosed data, the model layer with strong monetization still commands high-growth enthusiasm in the primary market, while the asset-heavy, highly leveraged infrastructure layer is being repriced in the credit market; the spread between the two markets is the main variable for AI pricing in the coming quarter.
Interpretation: November's offering price will be the most direct public reading of this divergence. If the final pricing lands within the rumored range, it suggests primary-market confidence in AI monetization has not been dragged down by secondary-market credit concerns; if pricing is clearly below the rumored range or the offering is delayed, it suggests the credit-side repricing has already transmitted to the primary market. There is also a reverse effect: if the offering goes smoothly and subscriptions are strong, panic sentiment in the AI sector could also be partially repaired — the offering process itself is one of the variables in sector sentiment.
A Final Note
The three-step staircase of $4.7 billion, $11.5 billion, and $16.8 billion is the hardest piece of operating evidence for AI commercialization to date; while the gap between "adjusted profitability" and GAAP, and the deceleration in QoQ growth from 145% to 46%, are the parts of that evidence that most need to be treated calmly. If the roadshow launches in the week of November 9, every step of the offering process — the price range, subscription demand, first-day trading performance — will answer one question more directly than any research report: just how far has the market's pricing of AI actually come?
Data Notes
- Anthropic Q1/Q2/Q3 revenue: Reuters ($4.7B/$11.6B/$16.8B), FT (Q2 at $11.5B), 2026/10/14–15; figures come from investor briefing accounts, and the company has not released formal financials.
- Adjusted profitability and positive cash flow: relayed by FT, Bloomberg, Jinshi, and others, 2026/10/14–15; adjustment items not disclosed.
- IPO timetable and size: Yahoo Finance citing Bloomberg, The New York Times citing banking sources, 2026/10/14–15; subject to the offering documents.
- Q2 growth context: The Information report, 2026/10/15.
- Valuation history: Reuters, WSJ (2025/9/2, $13B raise, $183B post-money); The Irish Times (2026/6/13 retrospective, $61.5B in March 2025, $380B in February 2026).
- Issuance records: compiled from public reporting (Alibaba $25B in 2014, Saudi Aramco $29.4B including greenshoe, SpaceX $75B in June 2026); the SpaceX figure was recalculated and checked against the offer price and share count.
- Nvidia comparison: market data and financial statement interfaces, 2026/10/14; the price-to-sales ratio is a rough comparison of annualized estimated revenue against disclosed actuals, with differing denominator methodologies.
- Market comparison: CoreWeave bond data appears in a separate article the same day; U.S. stock closing prices are from market data interfaces, 2026/10/14.
Disclaimer:
This content is provided for general information and market commentary purposes only, based on publicly available materials as of the time stated in the article, and relevant market data, expectations, and probabilities may change with market conditions. The views and investment strategies of third-party institutions, analysts, or other persons cited in this article represent only the views of the relevant third parties at a particular time and do not represent or constitute a recommendation by BIT. This article does not constitute investment advice, investment research, an offer, a solicitation, or a recommendation of any securities, investment products, or trading strategies, and should not be relied upon as the basis for any investment decision. Financial markets involve risk, securities prices and market performance may fluctuate, and historical performance and past market trends do not represent or guarantee future results. Investors should independently assess the relevant risks based on their own circumstances and seek professional advice when needed. BIT's Hong Kong stock trading services are not provided to residents of Hong Kong or users in other restricted jurisdictions.