

GPT-6 Full Rollout Day One: Dow Falls Over 340 Points — When AI's "AGI Moment" Meets "Higher for Longer"
On October 7, two things happened on the same day, pulling in different directions.
OpenAI fully rolled out GPT-6 to all ChatGPT users worldwide. Paid users (Plus, Pro, Business, Enterprise) began using GPT-6 Sol that same day, while Free and Go users will switch to GPT-6 Luna starting October 8. The company also introduced a new capability called Intelligent UI — responses can now dynamically combine text, charts, and interactive components based on the type of question. According to OpenAI's official data, ChatGPT has over 1.2 billion weekly active users.
On the same day, the Federal Reserve released the minutes of its September meeting. All 19 participating officials unanimously supported the September rate hike, with most participants believing further rate increases may still be needed before year-end; participants broadly emphasized that inflation remains elevated and the job market is near full employment, with inflation risks skewed to the upside.
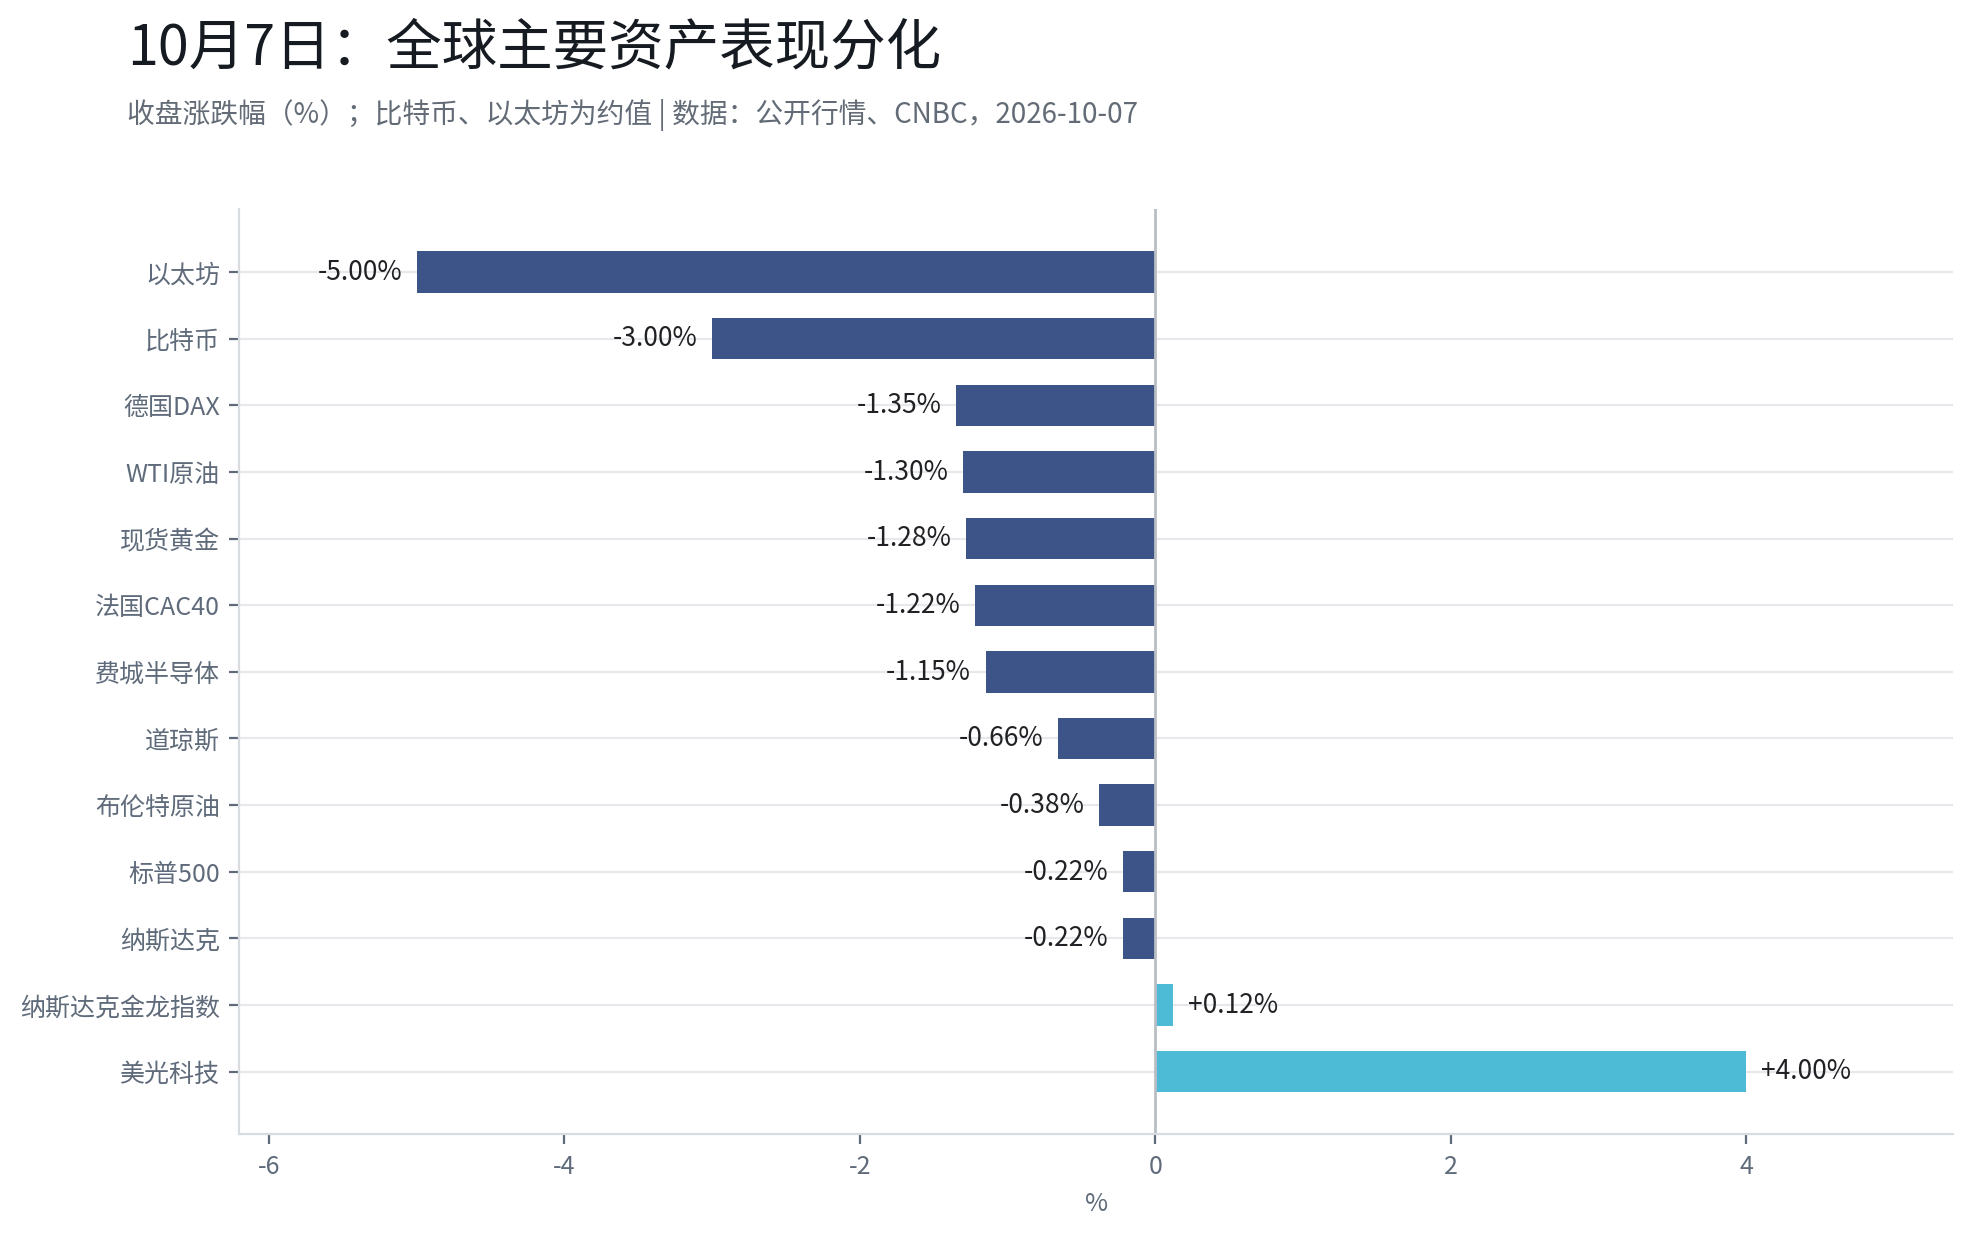
On one side was the "AGI moment" in market narratives; on the other was the central bank's stance of "higher for longer." That day, the three major U.S. stock indices retreated from record highs the previous day: the Dow fell 341.41 points to 51,179.87 (-0.66%), the S&P 500 dropped 0.22% to 7,801.77, and the Nasdaq declined 0.22% to 27,538.69. European declines were larger — Germany's DAX fell 1.35% and France's CAC 40 dropped 1.22%; aside from rising U.S. Treasury yields, French fiscal concerns and high oil prices were also cited as reasons for pressure on European stocks that day.
1. One Sentence in the Minutes Worth a Closer Read
Most coverage focused on "most officials support one more rate hike this year." But there is another passage in the minutes that has been relatively less mentioned in public reports: some participants believe that AI development could cause aggregate demand to outpace supply in the medium term, thereby creating upward pressure on inflation.
The weight of this sentence may be no less significant than "one more rate hike this year." In the Fed's inflation discussion, AI capital expenditure itself is now listed as one of the variables that could push up aggregate demand, rather than merely being part of a neutral "technological progress" narrative. The inference: if AI commercialization and computing power expansion continue to accelerate, this could provide one additional justification for a "higher for longer" rate path — this is our interpretation based on the minutes text, and directional judgments remain uncertain.
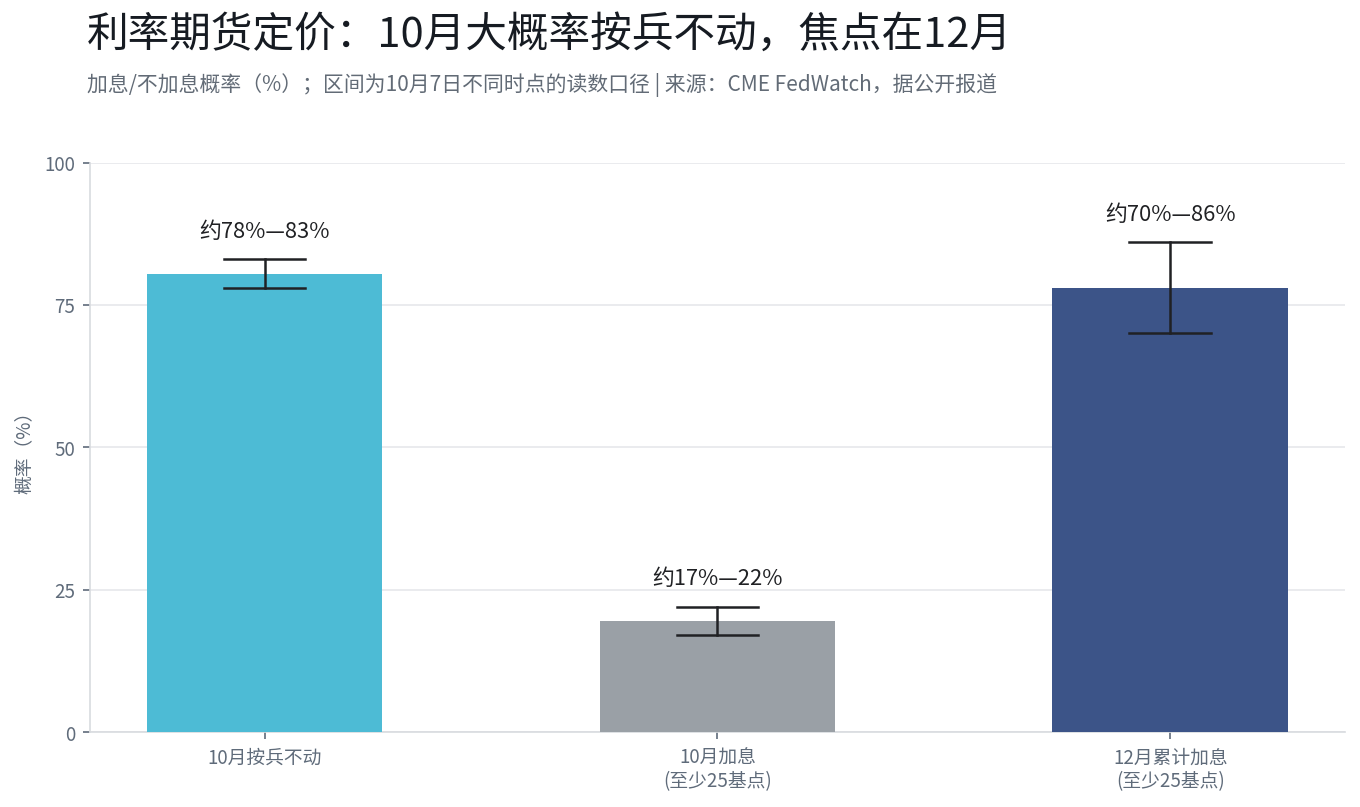
Market pricing currently sits somewhere in between. According to CME FedWatch data (figures varied slightly at different times on October 7), the probability of at least a 25 basis point hike in October has fallen to about 17%–22%, while the probability of at least a cumulative 25 basis point hike by December is in the 70%–86% range. The signal from the market: October is likely a hold, and the December meeting may be one of the more critical observation points.
2. U.S. Treasuries: 10-Year Auction Demand Beat Expectations, But the Real Problem Is the Long End
One of the most closely watched asset price moves that day occurred in the bond market.
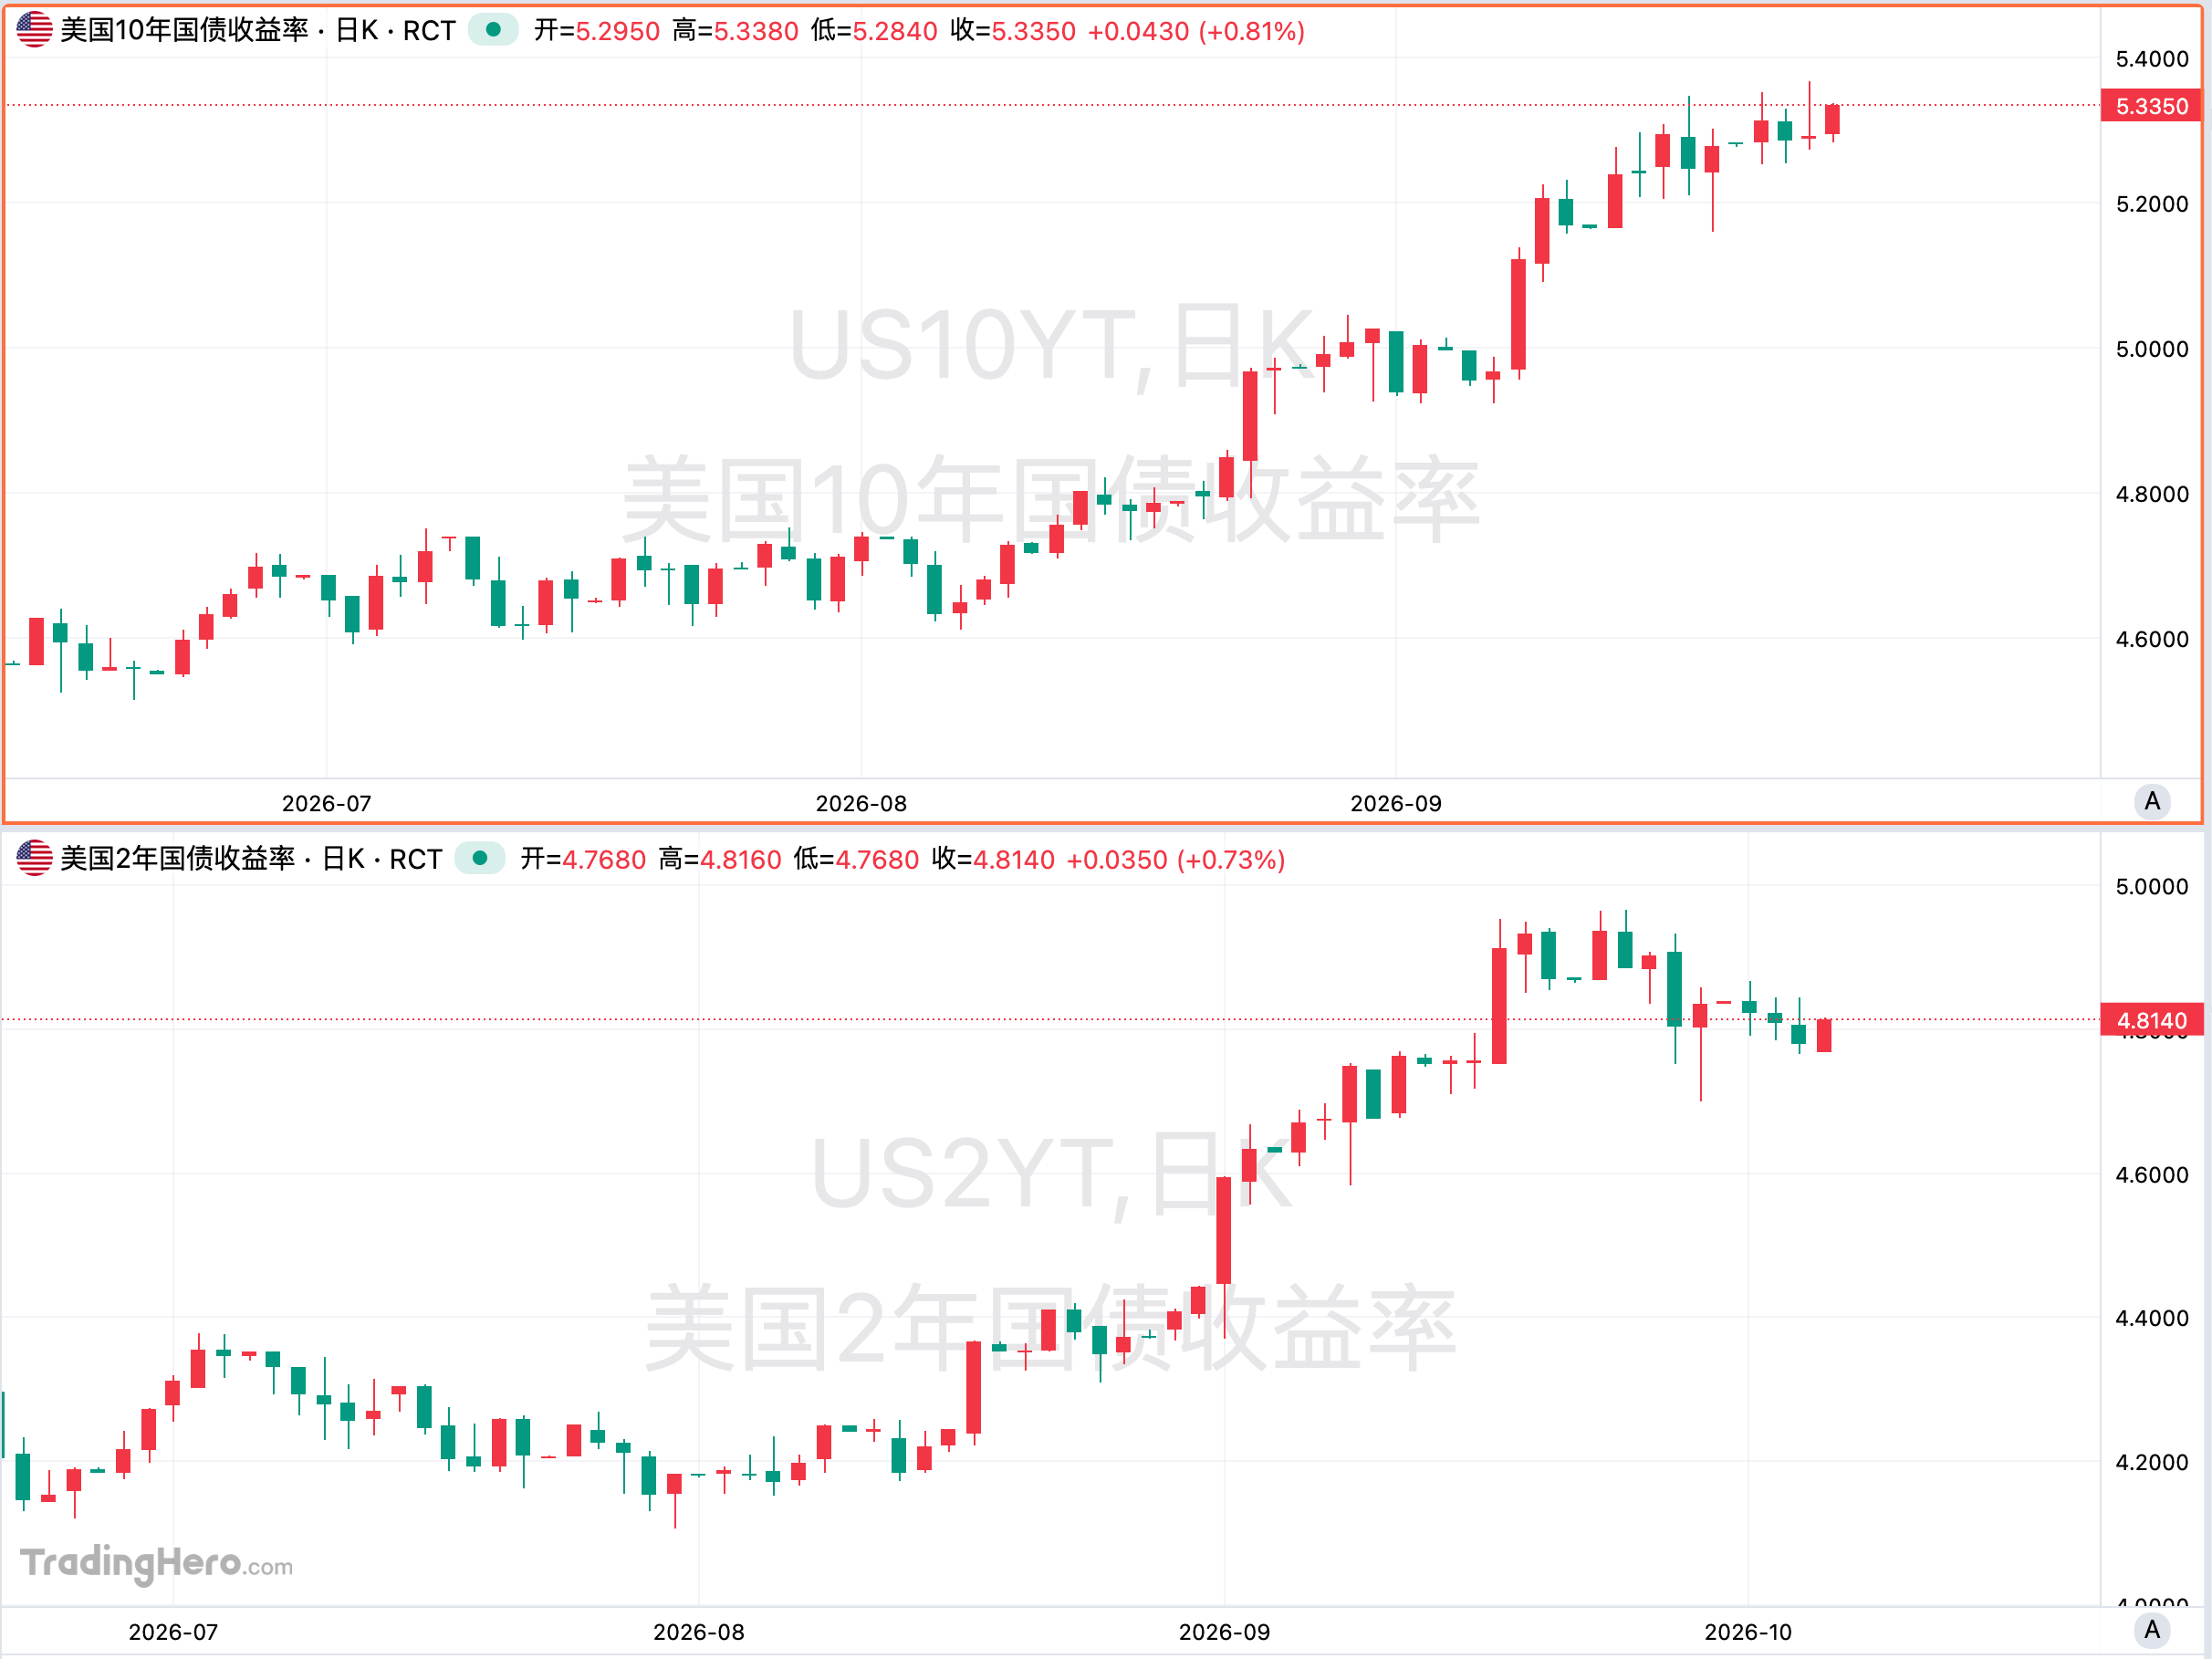
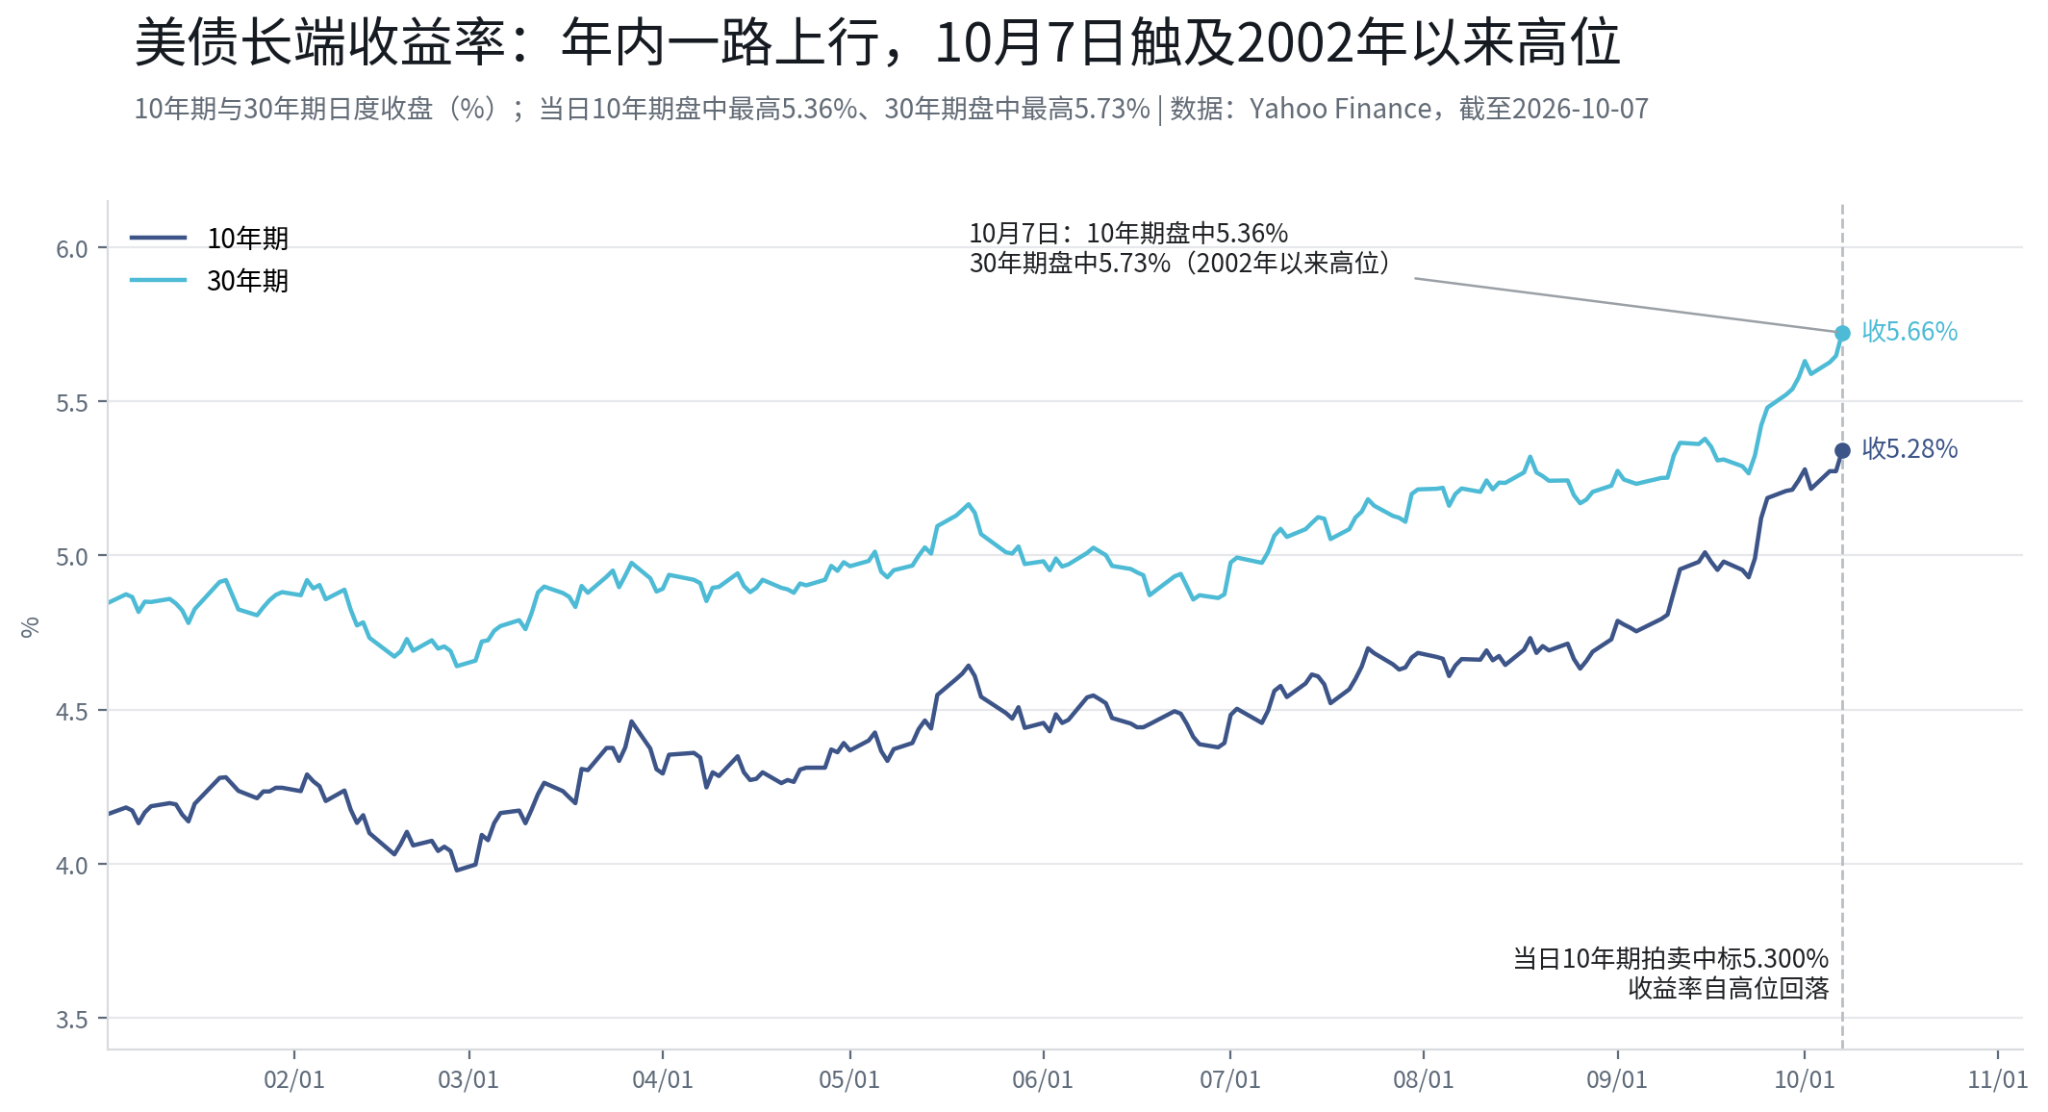
The U.S. 10-year Treasury yield rose intraday to as high as 5.364% (per Reuters, the highest since April 2002), while the 30-year touched 5.70%–5.73% intraday (highest since May 2002). At the close, the two had retreated to around 5.28% and 5.66%, respectively. According to public reports, U.S. Treasury officials responded that day by saying the bond selloff was a "global phenomenon" — long-end rates in the U.S., Europe, and Japan rose in tandem, driven by inflation expectations after oil prices topped $100 and by investors demanding higher compensation to absorb large-scale sovereign debt supply.
But October 7 provided an important counterpoint: that day's $39 billion 10-year Treasury auction drew a bid-to-cover ratio of 2.77, notably above the average of 2.54 over the past six auctions; primary dealers were allotted only about 2.5%, a post-financial-crisis low — meaning roughly 97.5% of the issuance was taken directly by non-dealers. Indirect bidders (including global central banks and other institutions) received 80.3%, above the average of 72.4% over the past 10 auctions.
One interpretation: at yields above 5.3%, some long-term allocation funds (pensions, insurance, sovereign wealth-type institutions) may be shifting from "avoiding the long end" to "disciplined allocation to the long end." Such funds have internal discipline around yield levels — if it's high enough, they buy. But a single auction is not enough to confirm a trend — and it must be emphasized that it validates demand for the 10-year, not the 30-year.
After the auction results were released, the 10-year yield retreated from its intraday high to around 5.28%–5.30%. The retreat occurred after the auction: the most important marginal change in the bond market that day may not have been economic data, but the emergence of buyers.
3. The 30-Year: The Segment More Worth Watching Than the 10-Year
If the 10-year was the day's "pricing anchor," the 30-year may be where the pressure is most concentrated.
In terms of levels, both are actually equally extreme: the 10-year's intraday 5.364% was the highest since April 2002, and the 30-year's intraday high of 5.70%–5.73% was the highest since May 2002; according to market data feeds, both are currently near the 98th percentile of their 52-week ranges. Looking purely at the magnitude of the rise, the 30-year is not steeper than the 10-year — since early September, the 10-year has risen from about 4.79% to 5.28%, while the 30-year has risen from about 5.27% to 5.66%.
What truly makes the 30-year "more striking" are three structural reasons.
First, this is the end the central bank cannot control. The policy rate directly determines the short end, but pricing power for the 30-year yield lies with the market — it is composed of inflation expectations and term premium. When the Fed says "higher for longer," the short end follows the policy path; but the 30-year rising is more like the market voting on the fiscal path and long-term inflation itself. According to public reports, the long end bore more pressure than the short end in this selloff, with the 10-year/30-year spread maintaining a positive steepening shape of about 35–40 basis points — the market is not pricing a "recession inversion" but rather "inflation and supply premium."
Second, duration amplifies volatility. The duration of 30-year bonds is roughly more than twice that of 10-year bonds, so for the same yield increase, the price decline is significantly larger. For pensions and insurance institutions holding long-duration bonds, the 30-year is where valuation pressure is most concentrated; for the issuer (the U.S. Treasury), it is also the most expensive segment to finance.
Third, the answer from the 10-year auction cannot automatically be extrapolated to the 30-year. The October 7 auction showed that allocation funds were willing to absorb 10-year debt at a 5.3% yield; but pension and life insurance liability durations mainly fall in the 20–30 year range, and whether demand exists at the ultra-long end will have to wait for the October 8 30-year auction. If the 30-year auction is also strong, the evidence for long-end rates "topping out" will increase a notch; if it is clearly weak, it would suggest that allocation funds are only willing to extend to the 10-year, and pressure on the 30-year has not yet been relieved.
With oil prices holding above $100, the transmission of inflation expectations to the ultra-long end is also more direct. The 30-year auction result and subsequent inflation data may say more about how far this rate upcycle can go than the 10-year's own trajectory.
4. U.S. Stocks on GPT-6 Launch Day: Hardware Divergence, Not a Broad Rally
The full rollout of GPT-6 did not produce "buy all AI" on the tape, but rather internal divergence.
The Philadelphia Semiconductor Index closed down 1.15%. Within memory and semiconductors, performance was split: according to public market data, Micron bucked the trend to rise over 4%, Super Micro Computer gained over 3%; Qualcomm and Arm fell over 2%, TSMC dropped 2.09%, and Western Digital and SK Hynix ADRs weakened.
Micron's relative strength is related to memory supply and demand. According to reports, on October 7 an overseas institutional analyst raised Micron's target price from $2,100 to $3,000, with one core rationale being AI data center demand for HBM high-bandwidth memory (this target price represents only the relevant institution's judgment). One market interpretation holds that the larger the inference workload of models like GPT-6, the more direct the demand for high-bandwidth memory, leading to a pricing divergence within the memory sector between "AI core memory" and "traditional memory" — whether this divergence can persist still needs to be verified by subsequent earnings and order data.
Large-cap tech stocks were mixed: Amazon rose 1.42%, Apple gained 0.91%, Google rose 0.81%, Microsoft edged up; Meta fell 2.38%, while Nvidia and Tesla closed slightly lower. The divergence itself is a signal: GPT-6's launch did not drive a broad rally, and the market is beginning to distinguish "who truly benefits from inference demand."
5. Gold Falls Below $4,100: Double Pressure from Holding Costs and the Dollar
Gold was one of the day's bigger decliners.
According to public market data, spot gold closed at about $4,110/oz (different sources ranged between 4,110.68 and 4,110.75), down 1.28%, with an intraday low near $4,066, the lowest since August 5; spot silver closed at about $59.75/oz; New York December gold futures fell $46.40 to $4,140.70/oz.
Gold's weakness that day may have been mainly related to two factors: first, the real rate environment — with the 30-year U.S. Treasury yield above 5.7% intraday, the opportunity cost of holding a non-yielding asset was systematically elevated; when Treasuries can offer a risk-free return above 5.3%, gold's "zero-yield" attribute shifts from background to constraint. Second, dollar strength — the dollar index rose above 102.3, pressuring dollar-denominated gold prices. Some precious metals analysts told media that the market's message is that rates may remain higher for longer, which supports yields and the dollar.
It should be noted that gold's intraday dip occurred before the 10-year auction results were released, and after the auction yields retreated while gold rebounded from its lows — attributing the decline simply to any single event would be inaccurate; rate, dollar, and positioning factors may have all contributed.
6. Crude Oil: Geopolitical Tensions, Yet Prices Closed Lower
WTI crude futures fell 1.30% to $88.28/barrel, and Brent crude dropped 0.38% to $100.20/barrel (per public market data).
Oil price action did not sync with geopolitical news. According to public reports, Iran stated that day that the Strait of Hormuz was in a "closed state" and that Iran's armed forces had control over it; conflict between Saudi Arabia and Yemen's Houthi forces also continued. But oil prices did not rise as a result, and supply-side offsets may be more critical: G-7 nations have agreed to coordinate the release of about 100 million barrels of crude and fuel through the International Energy Agency over the next four months, and on October 7 IEA member states agreed to accelerate the pace of releasing already-announced reserves; according to maritime data agencies, Middle East crude exports (excluding Iran) have recently even exceeded pre-conflict levels, with some cargo flows rerouted through alternative routes; other reports mentioned that Saudi Aramco is studying additional export channels to cope with short-term disruptions.
Geopolitical risk premiums were to some extent offset by supply-side policy measures, which may be one important reason why oil prices did not rise with Middle East tensions that day. However, if supply disruptions continue to escalate, the buffer capacity of reserve releases has limits, and whether this balance can hold remains uncertain.
7. Crypto Pulls Back in Tandem: Leveraged Longs Under Pressure
Bitcoin fell below $83,000 intraday, closing at about $83,100, down over 3%; Ethereum dropped nearly 5%, SOL fell about 3%, HYPE and XRP declined over 4%, and DOGE dropped over 7% (per public market data).
According to CoinGlass data, total liquidations across the market over the past 24 hours were about $700 million, with over 90% being long positions. The crypto pullback may be related to multiple factors: rising U.S. Treasury yields and a stronger dollar pressured valuations of non-yielding/low-yielding assets, and leveraged longs being forcibly liquidated during the rapid decline amplified volatility; the oil price rise triggered by geopolitical events earlier that day also weighed on risk appetite.
8. The Independent Move in Chinese ADRs
Against the backdrop of an overall U.S. market decline, the Nasdaq Golden Dragon China Index turned positive in late trading and closed slightly higher (per public market data, about 0.1%–0.3%, with slight differences across data sources); some Chinese ADR individual stocks posted notable gains.
The relatively independent move in Chinese ADRs may be related to multiple factors: first, the prior correction was relatively large and valuations are at relatively low levels; second, according to a major foreign bank's statistical analysis of nearly 2,800 global funds, the average allocation of global active long-only funds to Chinese equities has risen from "underweight" to "benchmark neutral" since June, ending a four-year underweight stance, with the relevant funds managing a combined approximately $562 billion in Chinese equity assets (this view represents only the relevant institution's judgment). Whether changes in historical fund behavior can continue — past performance does not guarantee future results.
9. What to Watch Next
First, the 30-year auction result. This is a direct test of whether allocation funds are extending to the ultra-long end: if the 10-year is strong and the 30-year is also strong, long-end rate pressure may be approaching a phased release; if the 10-year is strong but the 30-year is weak, it would indicate that the ultra-long end remains the weak link, and the pressure on high-valuation assets and gold has not yet been lifted.
Second, whether the 10-year Treasury yield can return to and stabilize below 5.3%. If yields continue to run above 5.3%, the valuation anchor for high-valuation assets will remain under pressure; if allocation-type buying proves persistent, the top in long-end rates may be closer than current pricing implies — this judgment carries uncertainty.
Third, the industry transmission after GPT-6's launch. The divergence within the memory sector (some AI memory-related names strengthening while traditional memory and some semiconductors weaken) is an initial signal. If the pricing gap between "AI core memory" and "traditional memory" continues to widen, the AI supply chain's pricing logic may shift from "buy AI" to "identify the segments in the AI chain that truly benefit from inference demand" — ultimately still requiring order and earnings verification.
Fourth, marginal changes in December rate hike probability. Current market pricing puts the probability of at least a cumulative 25 basis point hike by December at about 70%–80% (per CME FedWatch at different times). If subsequent inflation data shows stickiness remains, this probability could rise further, and October's "pause" may just be a matter of pacing; conversely, any sign of cooling inflation could simultaneously improve the situation for growth stocks and long bonds.
Final Thoughts
Reading October 7 as "AI narrative setback" or "market panic" would both be incomplete. What actually happened is more like this: the Fed minutes wrote AI into the inflation framework from an industry narrative, causing long-end yields to rise under pressure; on the same day, a 10-year auction with demand exceeding expectations pushed yields partially back down. GPT-6's full rollout did not bring a broad rally, but rather a reordering of "beneficiary segments"; the pullback in gold and crypto was more a result of holding costs and the dollar environment. And beneath all of this, the 30-year yield stands above 5.7% and has not yet been tested by demand of a comparable magnitude — it may be the real litmus test in the coming trading sessions.
Data Sources
- OpenAI official release
- Public market data (U.S. stocks, U.S. Treasuries, gold, crude oil, crypto assets, etc.)
- U.S. Treasury auction results
- Federal Reserve meeting minutes, CME FedWatch
- Reuters, CNBC, FXStreet, CoinGlass
- G-7/IEA statements
- Foreign institutional research reports and public reports
Disclaimer: This content is for general informational and market commentary purposes