


With the increase in the volume of Bitcoin open contracts and the continuous increase in key price points in the liquidation map, the markets divergence has begun to intensify further. Is the current rebound turning into a reversal, or is it the second distribution of the downward relay?
This is what the author has observed from the market. There are two mainstream views on future trends. Both views are supported by many analysts. The two views start from completely different data and angles, but a careful observation of the core of their ideas shows that they have the same goal. The starting point of both is the analysis of supply and demand. Therefore, the context of todays sharing is to start from supply and demand, and analyze how the views on reversal and secondary distribution are based on the same root, that is, they both start from the analysis of supply and demand, but come to completely different conclusions.
K-line is the price trend. It is the most superficial visualization of the supply and demand relationship. The increase and decrease of buying and selling strength constitutes the ups and downs of prices. The formation of each K-line is the result of the confrontation between the buying and selling forces. It is a compressed image of the changes in the supply and demand structure . Furthermore, buying and selling have intensity, which can be directly observed from the trading volume. If we think further, why does the price change? Why does it retreat at a certain position? Why does the breakthrough sometimes fail?
Here the author shares a marble theory to explain the changes in the influence of tariff policies and the level of kinetic energy formed when supply and demand change. The marble theory is an idea that transforms the supply and demand relationship from abstract to concrete. The narrow supply and demand relationship can be easily seen in the order book. Orders of different pending orders form glass of different thicknesses, and each actively traded transaction is a marble with kinetic energy . The price change process is essentially the process of these marbles constantly hitting the order book, breaking through the glass, and pushing the price forward.
The thickness of the glass represents the liquidity depth and order density at a certain price; the kinetic energy of the marble comes from the volume and speed of active buying or selling. Every advance in the market price is the result of the marble penetrating a layer of glass and the price jumping to the next layer. If the kinetic energy is strong, it may penetrate multiple layers of glass continuously; if the kinetic energy is insufficient, it may get stuck at a certain layer or even rebound. When the market fluctuates violently, switch to the 1-minute level to find such marble-penetrating transactions.
This can explain the unpredictability of prices in short time frames, because it can be seen as disordered movement between two layers of thick glass. Compared with price trend, the marble theory emphasizes motivation structure; compared with predicting K-line, the marble theory attempts to restore the physical process of price being driven . This is a way of analysis that is closer to the essence of the market. From the appearance of K-line, combined with time and trading volume, countless trading indicators can be derived. Most of these indicators are not in todays discussion, but those involving supply and demand will be mentioned in the following content.
Based on the marble theory, we can get the following abstraction:
Order thickness = depth of a price layer
Active Trading = Marbles
Volume = Kinetic Energy of the Marble
Impact cost = the energy loss of the marble penetrating the glass
Based on this idea, we can further draw the following assumptions:
The market price does not slide continuously , but jumps through one price range after another.
The density of pending orders at different price levels varies , and the difference in thickness creates support and pressure;
The larger the active trade, the stronger its momentum is , and it can push the price through more glass layers;
Some orders in the market are false liquidity and do not represent real intentions. When the marble hits this kind of glass, a false breakthrough will occur.
Price behavior has inertia. When the momentum is too great , it may cause the price to break through and form an overheating or overcooling phenomenon, that is, overbought or oversold.
This is the theory that the author has drawn from two viewpoints and his own trading experience. When making a transaction, you can only look at the K-line, because all the supply and demand relationships are hidden in the K-line. If the trading level is high enough, you can only look at the K-line to determine the direction of the supply and demand relationship and the control of the arrival of the critical point. Experts simplify things, and the K-line is enough.
Let me give you two simple examples: a long white candlestick usually means that buying power dominates the cycle, demand continues to rise and devours pending orders, and the momentum strongly breaks through multiple layers of glass; while a long black candlestick reflects the repressive dominance of supply, buyer support is weak, and prices quickly break through multiple support levels downward. The momentum of the marble comes from the strong willingness of the seller.
If the supply and demand relationship cannot be seen by observing the K-line, more indicators are needed, such as the volume of open contracts, spot premium, and liquidation maps, to find data support for your own transactions from more angles. The rebound is strengthened into a reversal, or the second distribution of the relay is based on the conclusions drawn from their respective perspectives. The former believes that demand is greater than supply, and the latter believes that supply is greater than demand. To put it more directly, the former believes that the bull market is still there, and the latter believes that the bear market has been formed and will continue to deepen. From a physical sense, there are more people who are optimistic about the rebound turning into a reversal, that is, there are more people who are bullish, so I will first introduce the theoretical basis of the first view.
The first view: The rebound is likely to turn into a reversal
The first point of view can be roughly divided into three different situations where demand exceeds supply. The discussion of the supply relationship from long-term and short-term holders to the concentrated chip area comes from @Murphychen 888, and the views put forward by Murphy will also be used extensively in the following text.
The first is the relationship between long-term holders (LTH) and short-term holders (STH). The profit and loss status conversion of LTH and STH often indicates important market turning points. The first small argument is to observe the changes in the profit and loss ratio of long-term holders (LTH-RPC) to capture the market bottom signal. When the indicator shows that long-term holders are beginning to suffer general losses, it often means that the market is approaching a stage low.
The principle of the indicator is:
When the profit ratio of long-term holders drops significantly and losses occur, it means that the profit space that can be realized is greatly compressed.
The continued loss will suppress the willingness to sell. As the number of chips available for sale decreases, the market selling pressure will gradually weaken.
When the selling momentum is exhausted to a certain extent, the market naturally forms a price bottom
Historical data support:
At the bottom of the bear market in 2018 and 2022, the proportion of losing chips of long-term holders reached the range of 28%-30%.
In the extreme market in March 2020, the indicator also climbed to around 29%.
In a bull market cycle, when this ratio reaches 4%-7%, it usually corresponds to the low point area of the correction.
Current market characteristics show:
The percentage of losses for long-term holders has risen from almost zero to 1.9%, close to the level in July 2024
Considering that the Bitcoin purchased at a cost of $90,000 to $100,000 from the end of 2024 to the beginning of 2025 is about to be converted into a long-term position (currently in a floating loss state), it is expected that this ratio will continue to rise.
When the loss ratio enters the threshold range of 4%-7%, more certain layout opportunities will emerge.
When the vast majority of long-term holders are in a profitable state, every price rebound will trigger profit-taking, forming a continuous downward pressure. Historical experience shows that whether it is the bottom of a bear market or a bull market correction, when long-term holders generally turn to a loss-making state, it often means that the market is about to bottom out. Because at this time, the selling momentum has been fully released, and the unsustainable selling pressure will cause prices to stabilize and rise. Although some long-term holders have shown signs of surrendering in the current market, it is still a left-side layout stage in terms of timing selection, but the potential return rate may be considerable.
The second small argument is STH-RPC, the profit and loss ratio of short-term holders. It is different from observing the long-term holders losses and entering the market on the left. The profit and loss ratio of short-term holders is a signal to enter the market on the right, proving that the current demand is much stronger than the supply.
Indicator principle:
When new short-term participants in the market gradually turn from loss to profit, it usually means that overall confidence is recovering. Such changes are often accompanied by a reversal of market trends and are a key turning point signal for market sentiment.
Indicator trigger critical point:
Once the average cost of short-term holders exceeds their holding costs, it indicates that this group of funds is realizing profit and loss reversal. Their profit-making sentiment will bring stronger buying momentum, pushing prices to continuously cross the previous trading range until the upward momentum is neutralized by the selling pressure of long-term investors. Therefore, when the short-term holding cost line crosses the cost line, it often means that the market is warming up, and the signal of trend reversal has appeared on the right side of the chart.
There is no trigger at present, but the yellow line has begun to converge to the blue line. The curve convergence based on this indicator is still a left-side entry idea.
The extreme deviation pricing range based on the MVRV ratio can also be seen as glass of different thicknesses. When the overall break-even is reached, people are unwilling to leave the market with more losses, and the downward momentum of the marbles decays. This shows that most market participants are still optimistic about the long-term prospects of Bitcoin and are not shaken by short-term fluctuations. If the market atmosphere is dominated by bear market expectations, when the price falls below the key cost line, it will often trigger a series of panic selling, rather than the current rapid stabilization. Combined with the current profit and loss pattern of long-term and short-term holders, and the trend characteristics of the weakening downward momentum, it can be inferred that the market is very close to the local low point, and this stage has a strong left-side entry value.
The second view is the supply and demand relationship between stablecoins and Bitcoin, namely BTC-SSR.
The BTC market value divided by the market value of all stablecoins represents Bitcoins ability to capture liquidity from the entire stablecoin pool. The stronger this ability is, the higher the probability of price increases will be, and vice versa.
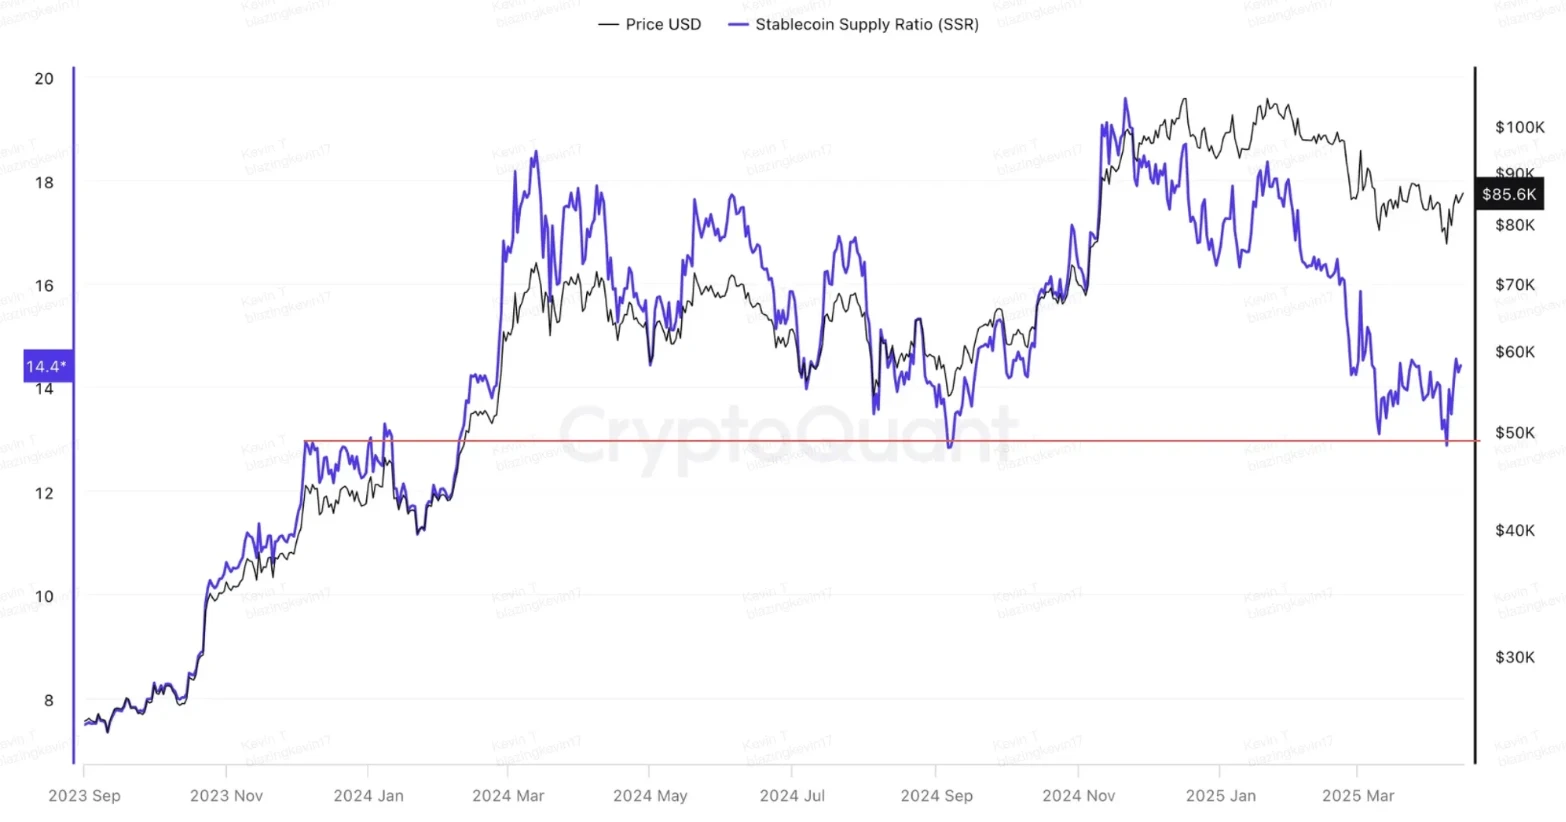
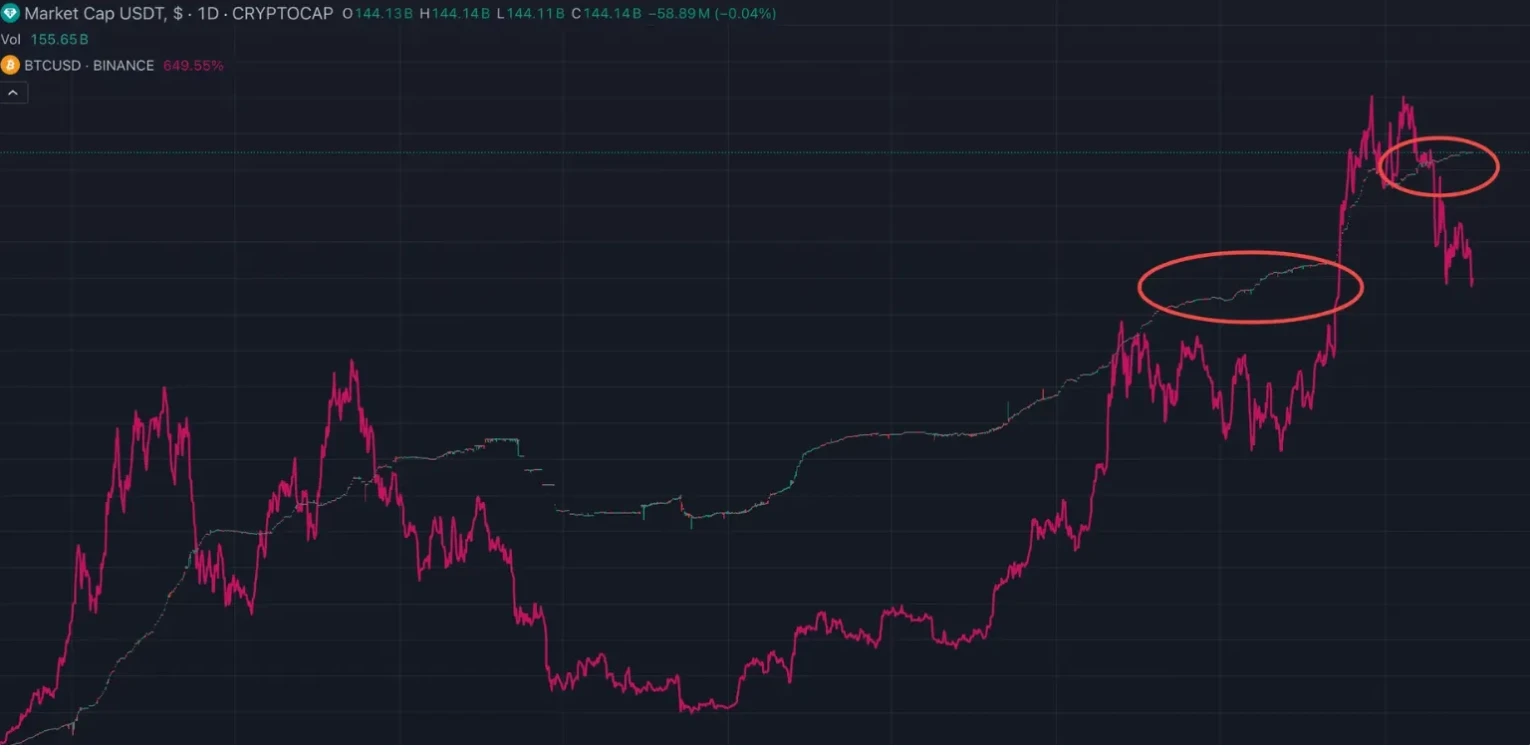
From the trend of BTC-SSR, we can see that from the market started at the end of 2023, as long as there is a divergence between Bitcoin and stablecoins, stablecoins are very likely to flow into Bitcoin and pull BTC-SSR back into the range. This graph has two high points, March 13, 2024 and November 21, 2025, corresponding to prices of 73k and 98k. The four local lows were on August 5, September 6 last year, March 10, and April 8 this year, and the prices were all local lows. Further observing the comparison between the market value of stablecoins and the market value of Bitcoin, whenever there is a divergence between the market value of stablecoins and the market value of Bitcoin, BTC-SSR will quickly start to fall until it reaches the ratio when the market started in 23 years, which means that the kinetic energy of stablecoins flowing to Bitcoin is constantly accumulating, and once it touches the demand zone, the energy will be released immediately. At present, the market value of stablecoins is still accelerating, and the continuous inflow of stablecoins is very likely to drag up the market value of Bitcoin. The premise is still that the bull market exists and the trend has not disappeared.
The third view is that high and low chip density areas will form a double anchor effect.
This view still comes from Murphy. Previously, we expanded the definition of supply and demand from the narrow sense of order book buying and selling to the supply and demand of long-term and short-term holders. Next, we will further extend the time dimension and observe the supply and demand relationship of Bitcoin in history. Among them, the indicator worth observing is the dense chip area.
Indicator principle:
The dense trading of Bitcoin within a specific price range reflects the recognition and layout of a large amount of funds. When the price falls, high-level holders are unwilling to sell their coins, which forms a damping force, similar to branches on a cliff, which can slow down the price decline; on the contrary, low-level holders have strong bullish expectations and are often willing to hold their coins for a rise, like protruding stones on a rock wall, which can support the price. The combination of these two forces builds the key support structure of the market.
Historical data support:
In June 2024 , Bitcoin gathered about 8% of its chips in the $39,000 to $43,000 range, forming an obvious support zone, while 12% of its chips were accumulated between $60,000 and $68,000, forming a strong resistance zone. During the period of external shocks from July to August (such as the German governments sale of BTC and the yen carry trade covering), the price fluctuated between $43,000 and $60,000, showing that these two chip-intensive belts successfully built a buffer zone. In particular, on August 5, 2024, BTCs lowest callback was $49,000, which happened to fall between the two dense zones, confirming the natural anchoring effect of the chip structure on the price.
In November 2022 , the FTX incident triggered a market liquidity crisis, but the BTC price remained stable between the two high-density areas of $6,000-$10,000 (13% of chips) and $18,000-$22,000 (19%). On November 9, it fell to a minimum of $15,500, which was exactly in the middle of these two ranges, reflecting that even in extreme panic, the chip structure can still provide stable support.
Failure cases where the anchoring effect was not formed:
In March 2022 , after BTC fell from a high of $69,000, it was sideways around $35,000-$45,000 for nearly two months. At that time, the market was divided, some people believed that this was a bull market adjustment, and others judged that it was the beginning of a bear market. However, judging from the distribution of chips, there was no concentrated position below the price, and the chips were evenly distributed in the range of $25,000 to $66,000. The accumulation of chips that really have the ability to support is far from $6,000-$12,000. As a result, under the dominance of panic, the price quickly fell below the sideways range and finally confirmed that it had entered a bear market.
Current status:
Currently, about 11% of the chips are gathered in the two ranges of $60,000-$70,000 and $93,000-$100,000, forming a symmetrical structure. If we refer to past historical performance, this distribution pattern has the ability to limit price fluctuations to the range of $70,000-$93,000. As long as this chip structure is not destroyed, the consensus center of the price axis will most likely be re-established between these two dense areas. The anchoring theory can also be explained by the marble theory, which makes the kinetic energy of price fluctuations up and down like a stretched rubber band. When the price moves toward the low chip dense area, the upward kinetic energy can continue to accumulate, and before touching the low chip area, it will be stimulated upward and rebound. Therefore, $70,000 will become the core support that is not easy to fall through in this cycle.
After analyzing the view that the current rebound will turn into a reversal, we discuss the impact of tariffs in this process. First, let’s talk about the conclusion: the impact of a single event on the market will gradually decay if the event does not deteriorate further.
This round of market adjustments caused by expectations of tariff policies can be divided into three stages: February 25 to 28, March 10 to 13, and April 7 to 10.
The intensity of the impact that the market has endured at each stage can be quantified more objectively based on the behavior of investors transferring their loss-making assets to Binance during the decline. Data shows that the realized loss in the first stage reached $139 million, much higher than the subsequent two stages, which were $43.92 million and $58.9 million, respectively. This type of behavior shows a clear decreasing trend on the chain, indicating that the psychological impact on the market was the greatest in the early stages, and although there was still panic reaction in the subsequent stages, the magnitude tended to converge.
The violent sell-off will push the price back to the demand area, and it is very likely that Trump will not release more negative signals than before on tariffs. Tariffs are raised high and dropped lightly for most countries, and their destructive power is limited. The 10% reciprocal tariff has achieved its purpose. Trump cannot afford to sell off 10-year US bonds further, and can only operate within the range that does not cause panic selling of US bonds. The destructive power is further controlled, and the buff added by tariffs to the supply side will begin to fail, and the downward momentum will begin to decay. Therefore, market sentiment gradually eases, short-term holders will gradually make profits, and the selling pressure of long-term holders is far from coming. There is a possibility that a large amount of stablecoins will flow into Bitcoin. This is the basis for supporting the possibility that the current rebound may be strengthened into a reversal, and the attractiveness of entering the market on the left is increasing.
The second view: The current rebound is the second distribution after accumulation
This view holds that the current stage is a downward relay towards a long-term bear market. The macro-level discussion reasons include the possibility of tariff-induced inflation, stagflation, and accelerated recession. However, the core of this view is that the US stock market has entered a technical bear market, and the continued decline of the US stock market is inevitable. Bitcoin cannot be immune to this and does not have independence. It will be dragged down by the US stock market. Therefore, here is a sharing of the basis for determining that the US stock market has entered a technical bear market.
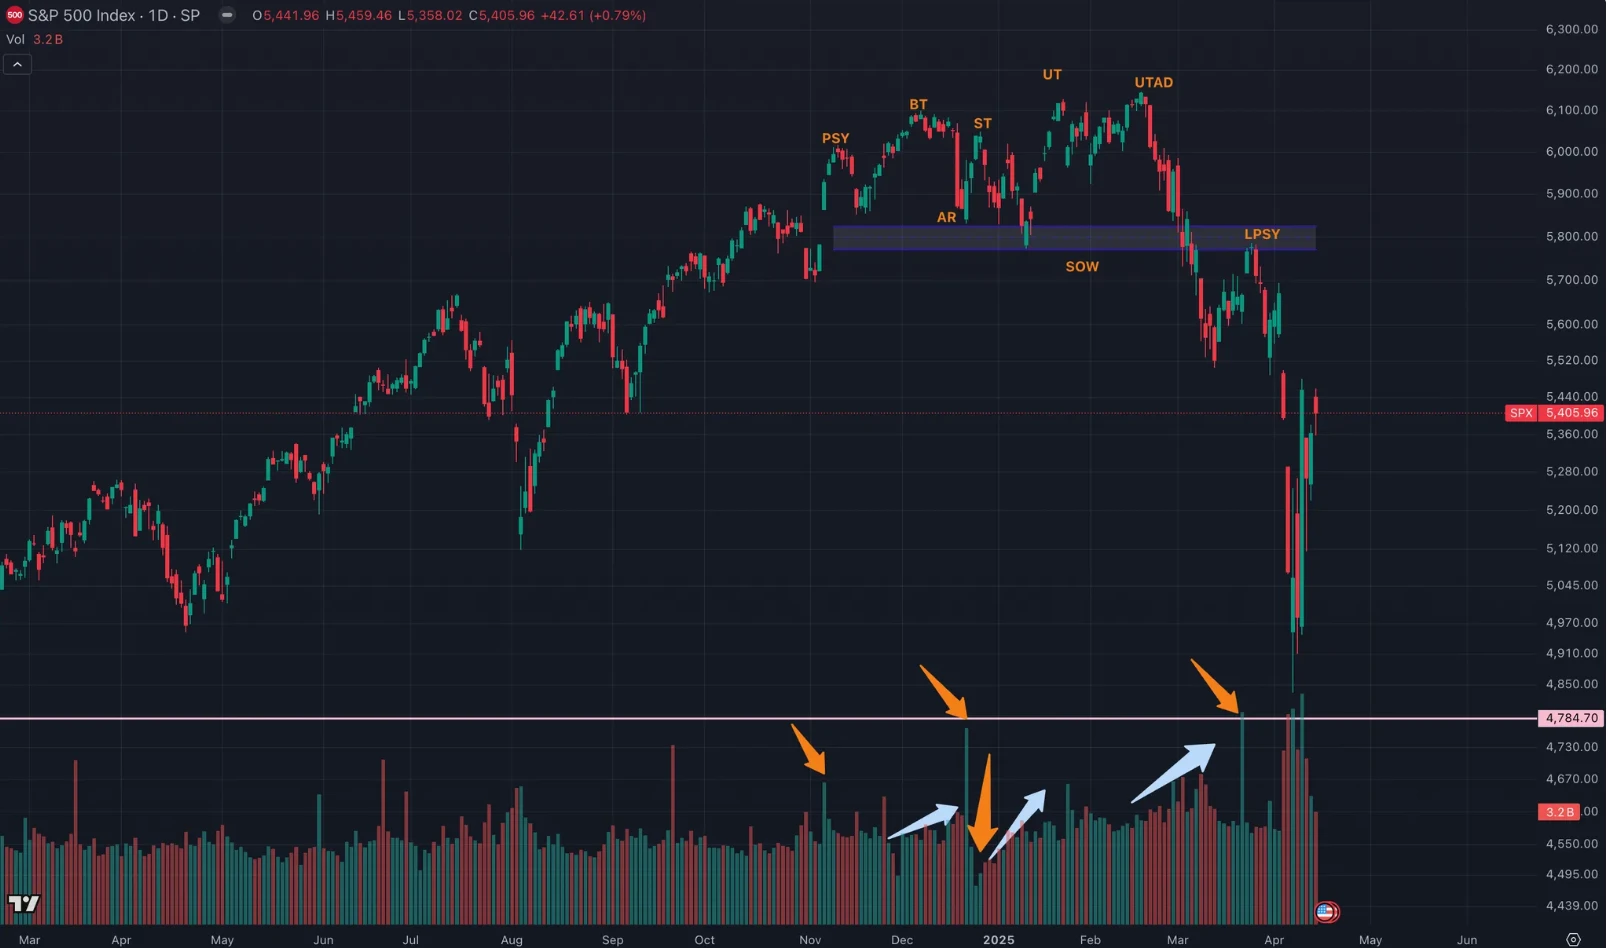
The second view is that the trend of the US stock market in the past few months is completely consistent with the Wyckoff-Distribution phase. The author explains this view from the perspective of price and corresponding trading volume, that is, volume-price behavior. The yellow arrow in the figure indicates that we need to pay attention to the pattern of daily trading volume; the light blue shoulder indicates that we need to pay attention to the pattern of trading volume over a period of time.
On November 6, the price began to rise sharply, and the trading volume and spread also increased, indicating that the interim high point was about to arrive. This is PSY - the initial supply point.
Late November to early December is the BC buying climax: also known as the buying concentration zone. Both the trading volume and the spread are significantly expanded, and the selling power reaches its peak. Near the top of the market, the publics eager buying orders are met by the main forces large selling orders.
On December 18, AR naturally pulled back after the buying climax, as buying dried up but selling continued, a natural pullback occurred. The lows of the natural pullbacks help define the market bottom of the distribution trading range.
The heavy buying on December 20th was the first accumulation, i.e. the second test of ST: after the natural decline, the price rose again to the vicinity of the buying climax area to test the supply and demand of the price near the buying climax area. When the price approaches the resistance area of the buying climax, the trading volume should decrease and the spread should narrow, which means that the supply will be greater than the demand and the price top is confirmed.
SOW weakness signal in late December to early January: Weakness signal usually occurs at the end of distribution, the price falls to the bottom of the distribution range, or slightly breaks through the bottom of the distribution range, often accompanied by increased trading volume and widening spreads. Weakness signal means that supply controls the market.
From January 13 to January 23, there was a UT upsurge and fallback: the purpose of the upsurge and fallback is to lure the last wave of buyers to continue to enter the market to buy, and at the same time to hit the stop loss set by the short sellers who entered the market in advance. The upsurge and fallback is a price stop behavior, but it gives the public the feeling that the price is going to break through the range resistance upwards, because the main force does not want the public to see that the price is about to fall.
UTAD surged and fell back after the distribution on February 19: it was the main forces final test of the new demand after the price broke through the range resistance line.
February 19 to early March: Demand was falsified, and the amplified trading volume accelerated the exodus.
The last supply point of LPSY appeared on March 25: Even with large-scale buying, after SOW tested the support strength of the ice line, the price rebounded weakly and the spread narrowed, all of which showed that it was difficult for prices to rise. The reason for the difficulty in price increases may be that demand has dried up or supply has controlled the market. The last supply point is the last wave of distribution by the main force before the price drops rapidly.
The price pattern of US stocks and the corresponding increase or decrease in trading volume are completely consistent with Wyckoffs distribution theory. This proves that the US stock market has completed the sprint at the end of the bull market and the distribution has been completed. Next, we need to find the LPS, the last support point, to realize the transition from bear to bull. Before this, it is a bull trap and we should short at highs.
The difference between the two mainstream market views can be seen as expectations for the U.S. stock market and the possibility of Bitcoin decoupling from the U.S. stock market: that is, if the U.S. stock market cannot stop falling, whether Bitcoin can remain unscathed; or whether the U.S. stock market can bottom out here, and Bitcoin will rebound first.
Market differences have further intensified. Which view do you agree with?
About Movemaker
Movemaker is the first official community organization authorized by the Aptos Foundation and jointly initiated by Ankaa and BlockBooster, focusing on promoting the construction and development of the Aptos Chinese ecosystem. As the official representative of Aptos in the Chinese region, Movemaker is committed to building a diverse, open and prosperous Aptos ecosystem by connecting developers, users, capital and many ecological partners.
Disclaimer
This article/blog is for informational purposes only and represents the personal opinions of the author and does not necessarily represent the position of Movemaker. This article is not intended to provide: (i) investment advice or investment recommendations; (ii) an offer or solicitation to buy, sell or hold digital assets; or (iii) financial, accounting, legal or tax advice. Holding digital assets, including stablecoins and NFTs, is extremely risky and may fluctuate in price and become worthless. You should carefully consider whether trading or holding digital assets is appropriate for you based on your financial situation. If you have questions about your specific situation, please consult your legal, tax or investment advisor. The information provided in this article (including market data and statistical information, if any) is for general information only. Reasonable care has been taken in the preparation of these data and charts, but no responsibility is assumed for any factual errors or omissions expressed therein.


