


LINK and COMP recent trend analysis

Overview summary
COMP: The indicator for COMP is generally bearish. There are currently no bullish indicators. Users with long positions may be concerned as they are completely relying on the current formation and the $164 support line to push COMP to higher ground. Many indicators are currently showing neutral, but the overall sign is that a red candle will appear soon.
LINK: LINK's indicators are completely bullish and bearish. The 20-day moving average has provided a lot of support for LINK recently, and it may also be the main driving force for LINK to turn from falling to rising when it tries to break through the all-time high price again.
COMP/USD technical analysis
COMP has had a tough time since August 12, with the price falling from $260 to its current $178. This caused COMP to lose more than 37% of its value in 13 days, making it one of the worst-performing cryptocurrencies in the top 50 by market capitalization.
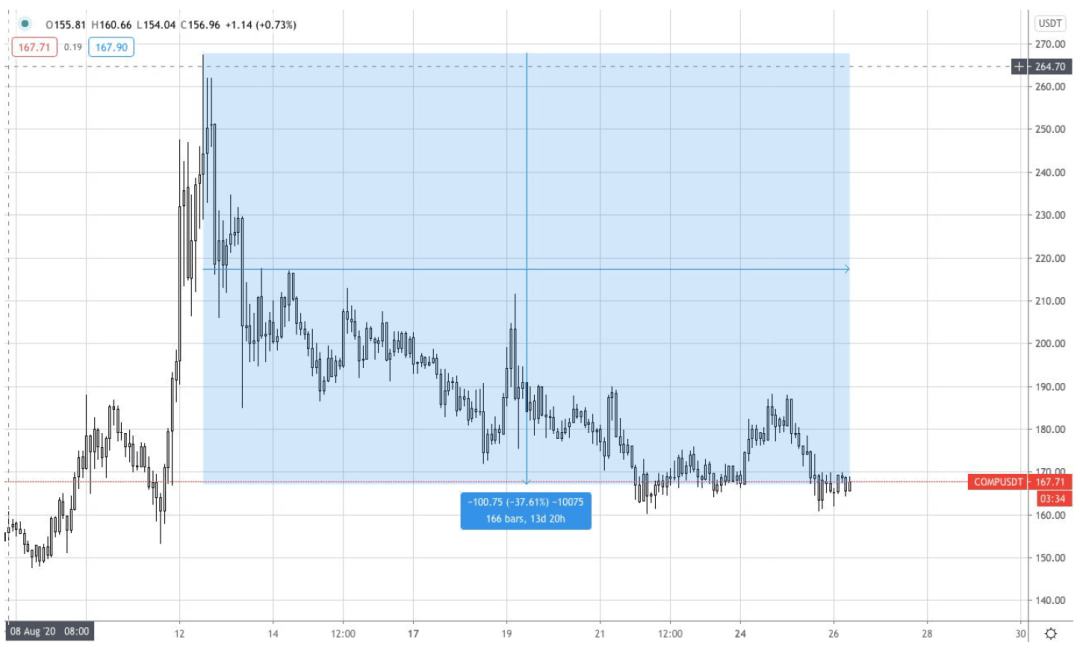
COMP/USD
Since the listing of COMP, it has formed various forms. As shown in the chart below, there are several descending wedges, a descending triangle, a cup and a handle pattern. We can profit from the formation of these patterns.
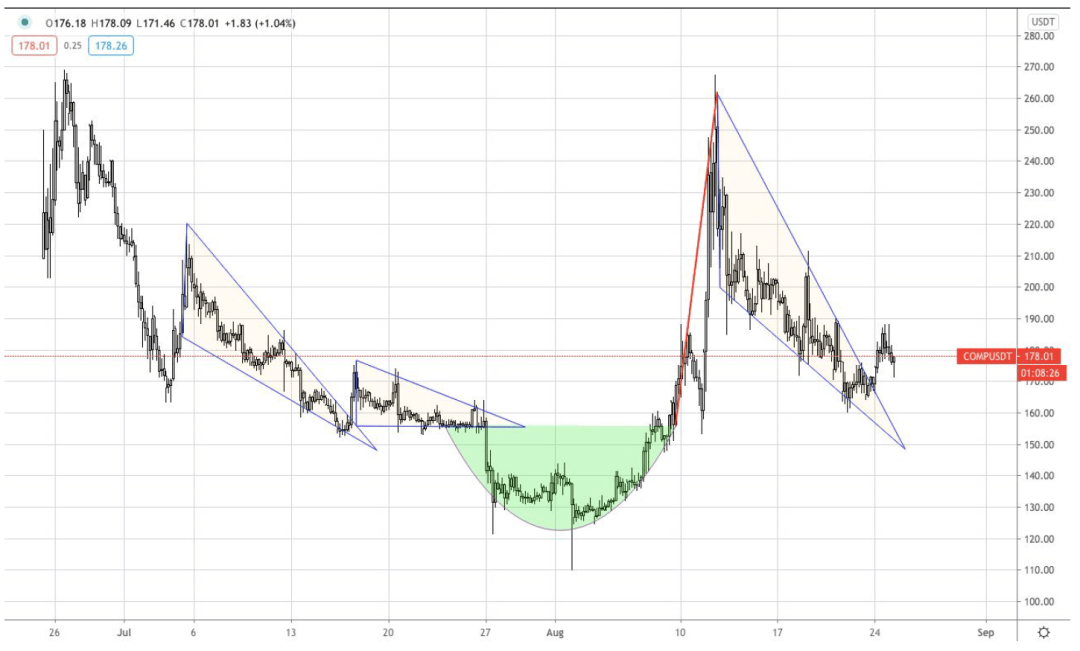
COMP/USD
COMP recent form
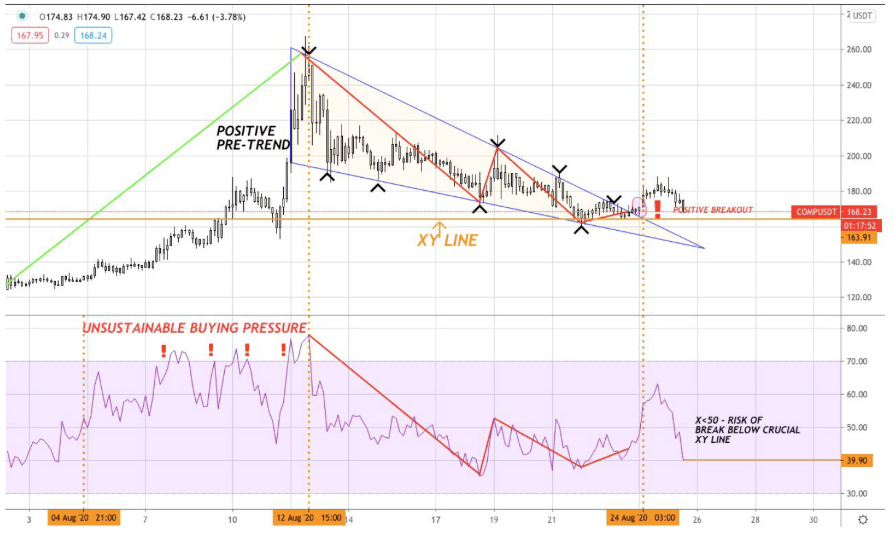
Recently, COMP formed a descending triangle. As the chart below shows, this descending wedge has many points of validation at both descending support and descending resistance. Both have more than three points of verification, increasing the likelihood that the formation is legitimate. COMP has been in the triangle, the trend is very typical.
The recent pattern is bullish. This is due to the fact that the pattern had an up front trend, the wedge was falling rather than rising, and there was also a positive breakout, as shown in the chart below.
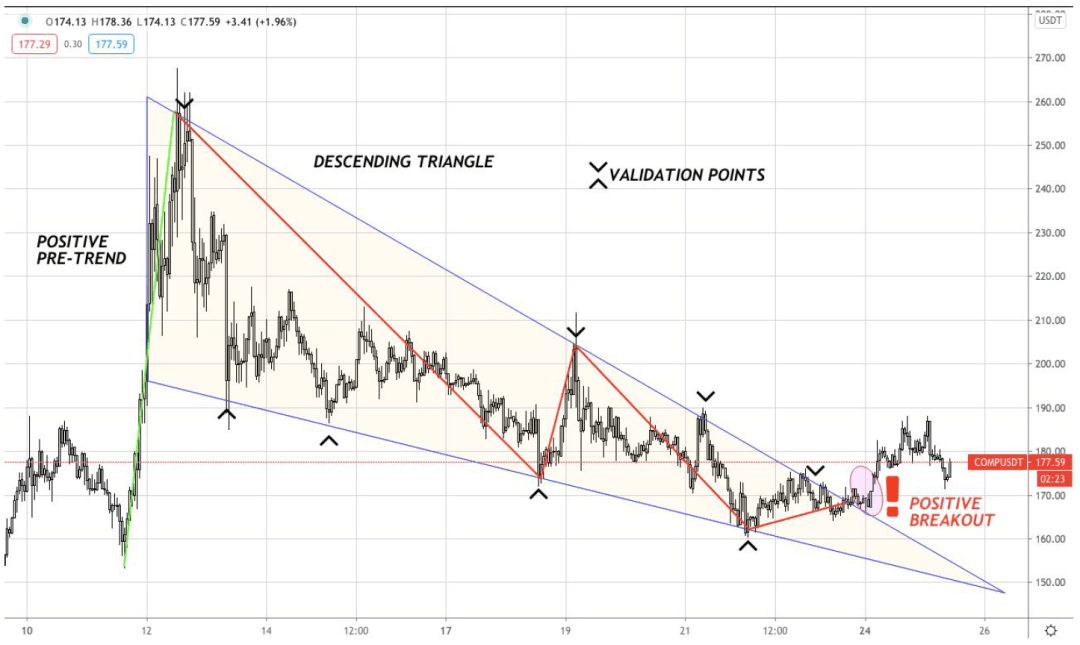
COMP/USD descending triangle
There is a risk of breakthrough failure in the near future
However, the recent breakthrough faces a significant risk of failure. Before the triangle occurred, COMP experienced unsustainable buying pressure, RSI exceeded 80 many times, and the currency price increased by 140% in just 10 days.
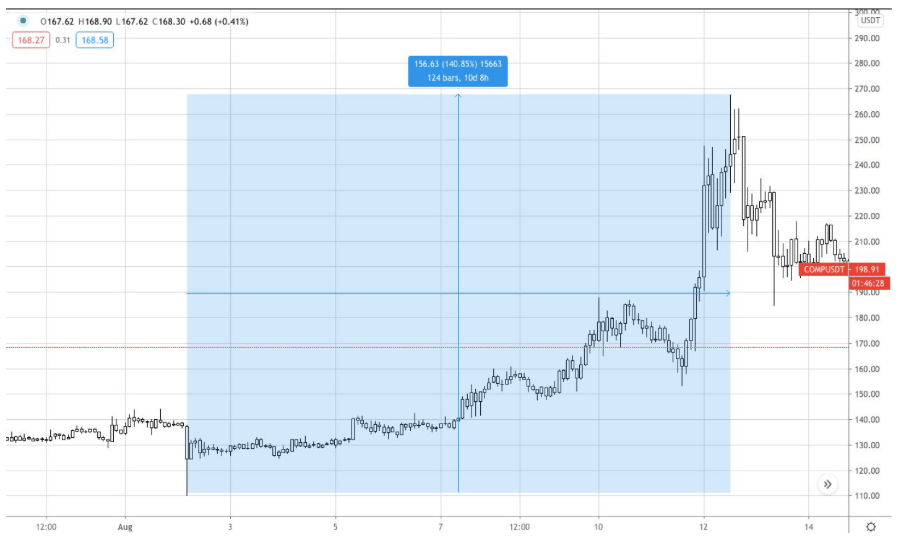
COMP/USD – huge increases before the triangle
This underlying buying pressure could affect the current formation. Surprisingly, after the breakout, the RSI has dropped below 50, which indicates that selling pressure is stronger than buying pressure. As it moves within the triangle, the RSI moves with the price to a certain extent. This correlation continued after the breakout and was amplified as shown in the chart below. If this selling pressure persists after the breakout, this could see COMP break above the all-important XY line. This line is the support for the breakout. If it breaks, the descending triangle will be invalidated, which indicates the continuation of the previous bearish move.
COMP/USD RSI
COMP Bollinger Bands
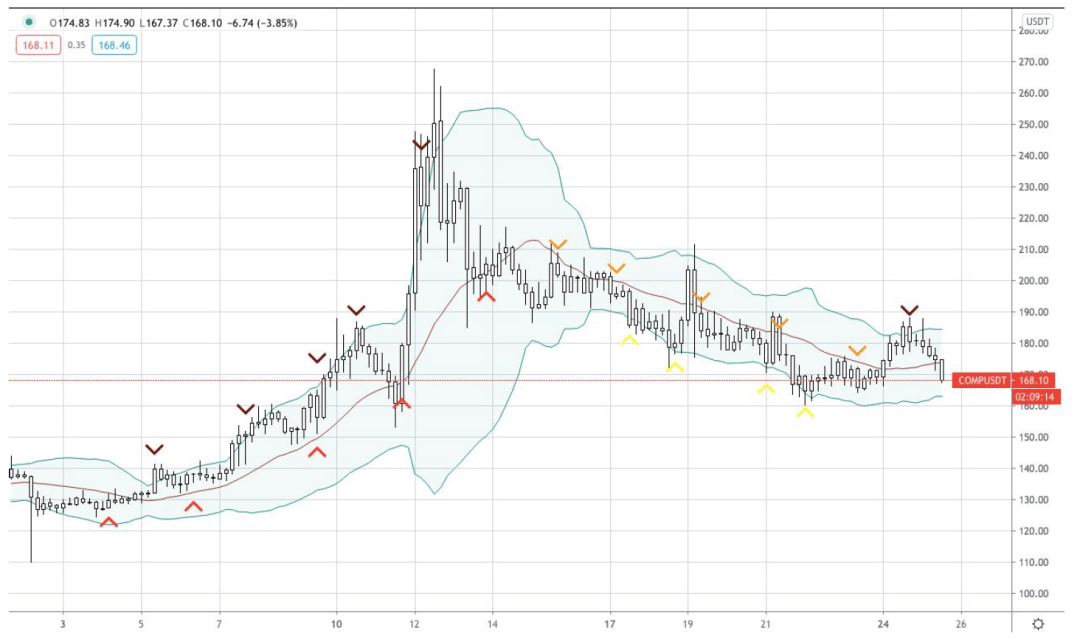
Currently, the signals from COMP's Bollinger Bands are somewhat mixed. In the previous two moves, BBs were very accurate in predicting price and trend. The midline 20-day moving average acted as support and resistance in both moves. In addition, the two deviations also acted as highly accurate support and resistance, and no oversold occurred.
COMP/USD BBs
Current Trend of Bollinger Bands
Bollinger Bands may lack validity at the moment. The most recent breakout, COMP found resistance at the top divergence. However, COMP unexpectedly broke above the 20-day EMA and deviated from its direction downwards. This move towards the bottom stopped at the $164 support.
The Bollinger Bands have been flattening recently, and at the same time, the width of the Bollinger Bands has also decreased; this suggests that a period of sideways trading may be on the horizon before COMP decides which direction to move.
COMP/USD – BTC/USD Comparison
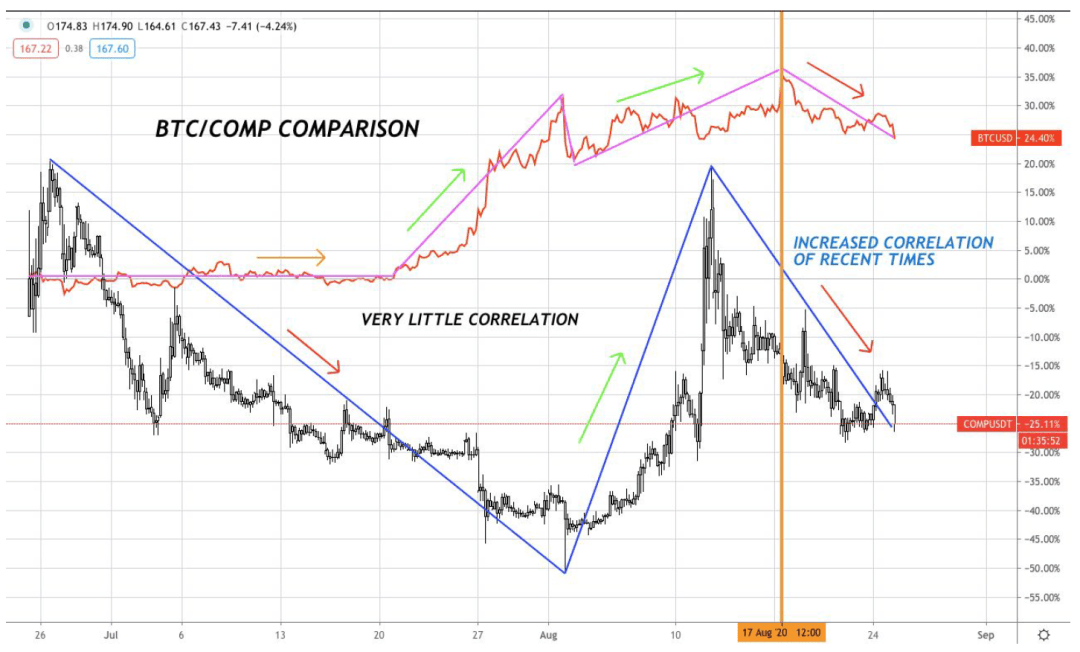
From the listing of COMP to August 17, the correlation between BTC and COMP is very small, as shown in the figure below.
COMP/USD – BTC/USD
However, as the graph above shows, the correlation has increased recently. This may mean that COMP is beginning to integrate into the mainstream cryptocurrency market, gradually moving away from the current DeFi boom surrounding other currencies such as CRV, LEND, and LINK.
With the Bollinger Bands now heading in an unclear direction, technical analysis suggesting bullish behavior, will other indicators support bullish/bearish or sideways movement with no clear conclusion?
COMP/USD Indicator Analysis
Group 1 – SAR, MACD, QQE MT4
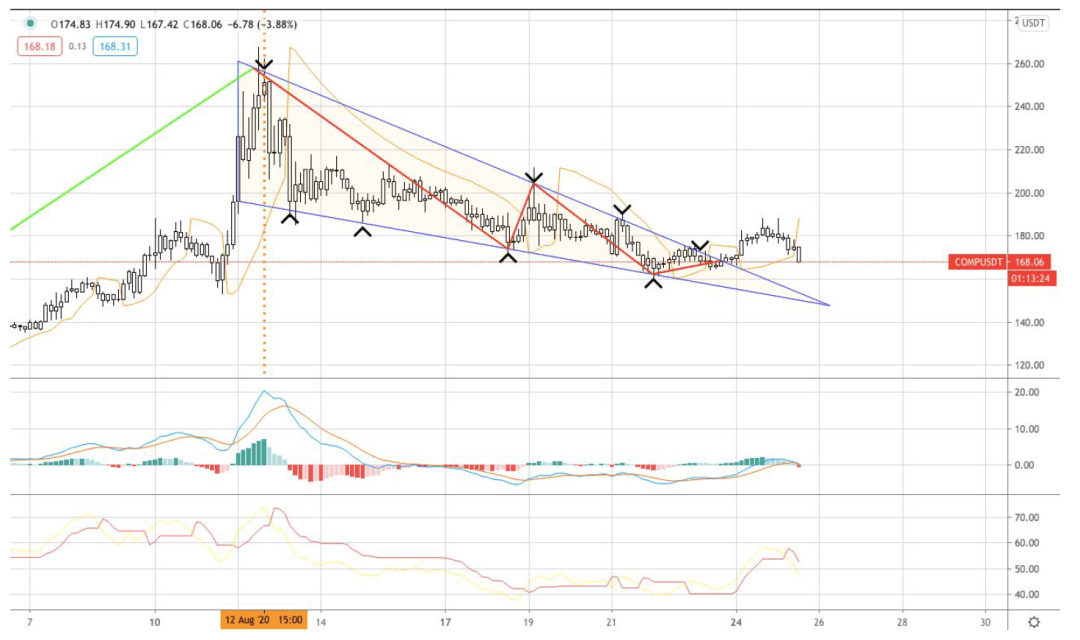
SAR - The SAR has recently turned from bullish to bearish. SAR is now above the candlesticks and points to negative momentum. However, if the $164 support level can provide enough support, the SAR will flip quickly, which could point to sideways trading as there is less time between momentum changes.
MACD – The MACD is technically bearish but seems undecided. There was a negative crossover in the positive part of the indicator, although the very low numbers that occurred on the Y-axis meant that the move was of little significance. Therefore, I personally feel that MACD is contradictory.
QQE MT4 – The QQE MT4 is currently bearish. It has seen a Yinxian cross, with the red line moving above the yellow line.
COMP/USD Indicators set 1 – SAR, MACD, QQE MT4
Team Two – Ichimoku, Keltner Channels, WWV
KCs – The KCs are currently bearish and the price is currently in the lower zone of the KCs. In the process of trying to go up, the K line cannot break above the top of KC, indicating that there is not much substance for the index to go up.
Ichimoku Cloud – The Ichimoku Cloud is currently bearish. This is because the cloud is red and the candlestick is also below the cloud itself.
WWV - WWV is in red and is currently technically bearish. Like the MACD, however, the indicator is closer to neutral. The closest red part has little height and no substance behind it.
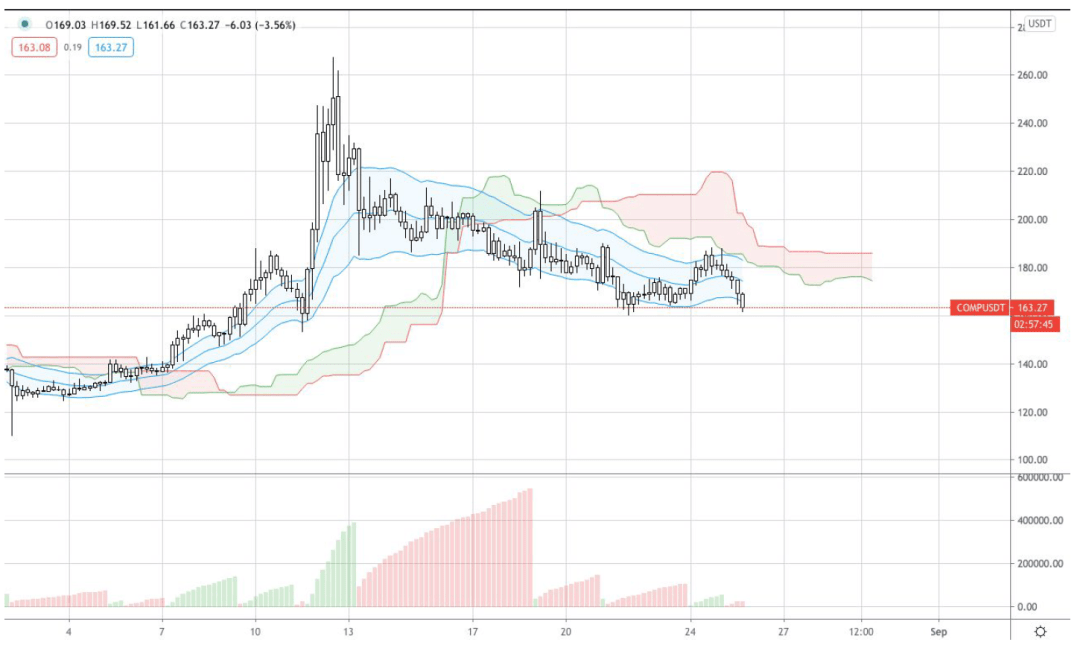
Indicators set 2 – Ichimoku, Keltner Channels, WWV
Group 3 – Gann HL, PPs, BBs/MACD
Gann HL - Gann HL is currently bearish. The indicator turned from blue (bullish) below the candle to brown (bearish) above the candle. Indicates a change in momentum.
BBs/MACD Indicator – The BBs/MACD indicator is currently neutral. The gap between the two blue lines is relatively small, and the clouds are only slightly reddened; not enough to make the indicator bearish.
PPs -- PPs are currently bearish. The candle is below the center PP, which acts as rigid resistance as COMP attempts to break out of the nearest descending wedge.
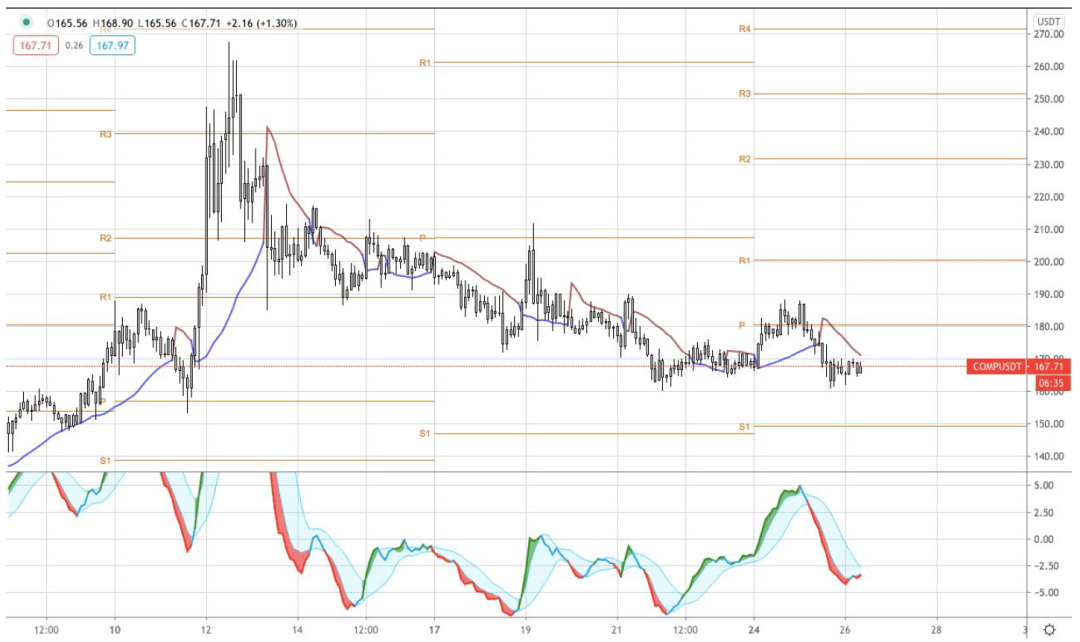
Indicators set 3 – Gann HL, PPs, BBs/MACD
COMP Heikin Ashi
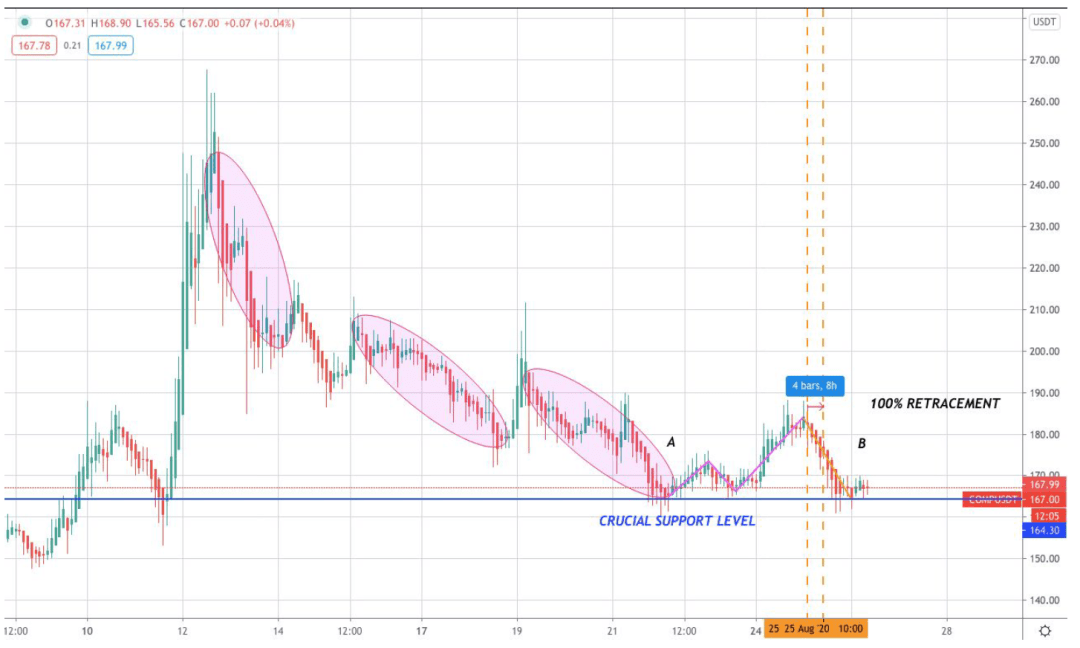
COMP/USD Heikin Ashi
During the falling wedge move, Heikin Ashi is mostly bearish. As the chart below shows, Heikin Ashi moves in three significant periods. At the end of the falling wedge, there was a clear conflict, with neither red nor green Heikin Ashi in control.
Indicator summary
COMP/USD Heikin Ashi
Summary table of price indicators
Indicator summary
Overall COMP indicators are bearish. There are currently no bullish indicators. Users with long positions may be concerned as they are completely relying on the current formation and the $164 support line to push COMP to higher ground. Many indicators are currently showing neutral, but the overall sign is that a red candle will appear soon.
COMP target price
Bullish target price
$180 +6.5% - The recent descending triangle range formed by COMP should make it an easy target. However, with many indicators currently bearish, there is a high probability that this will not be achieved. To reach this price target, indicators will need to turn bullish -- allowing COMP to extend that momentum to $180. The chances of that happening are currently slim.
$188 +11.3% - $180 is unlikely to be reached. But if it does, starting at $180 and reaching $188 is very likely. Although from where we are currently, the chances of reaching $188 are low.
$201 +19% - $201 looks highly unlikely at the moment, the market is now at a fork, and DeFi coins look overpriced - predicting a +19% price increase is very unwise.
neutral target price
$164 -2.75% -$164 is likely where COMP is at the time of this report. As all indicators are bearish and $164 has been tested recently, a retest of $164 is almost certain. However, if $164 is broken, it doesn't mean that COMP is now bearish, barring a break below $164.
Bearish target price
$154 -8.5% - If it breaks below $164, a drop to $154 is highly likely. With many indicators such as MACD on the verge of bearishness, COMP could be in a potential free fall if it breaks below $164, all indicators could be bearish and bullish technical analysis will be invalidated. A break below $154 is highly likely.
$140 -17% - To break below $140, COMP needs to break two resistance levels, most importantly support at $164, which has several points of validation. The odds of $140 happening are low.
COMP/USD Price targets
COMP Target Price Summary Table
LINK technical analysis
LINK currently has a very strong fundamental support. This support has many points of validation and has prevented LINK from falling further during LINK's recent consolidation, as shown in the chart below.
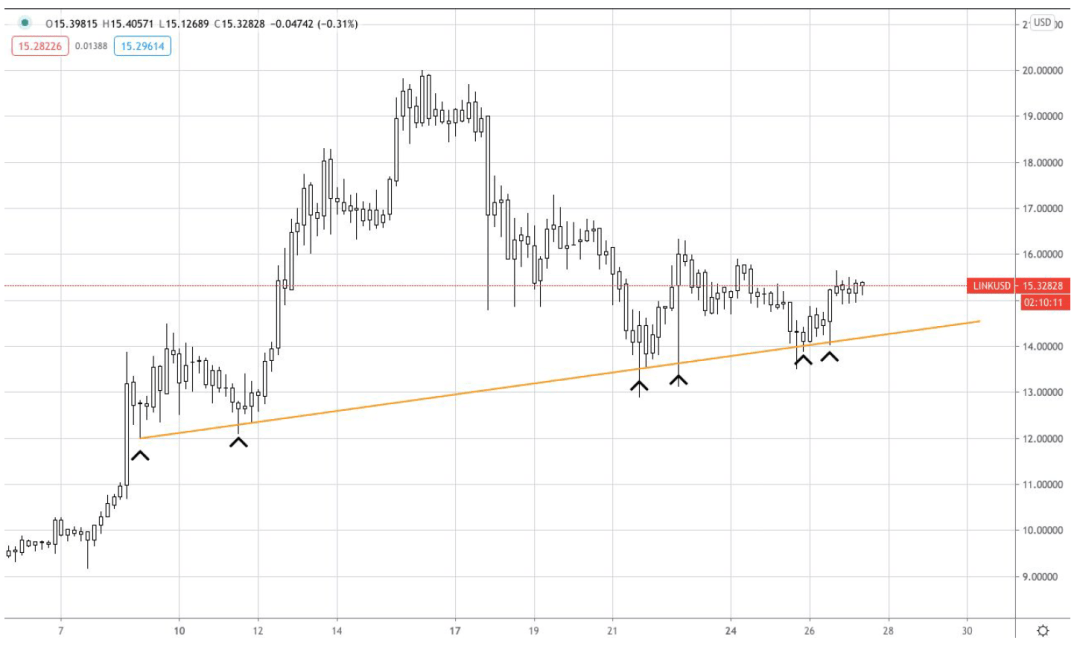
LINK/USD support
LINK recent earnings
Since March, LINK has made huge gains, increasing by as much as 748%. Accompanied by this, the trading volume of LINK has increased significantly, and the market capitalization ranking has also risen to the fifth place.
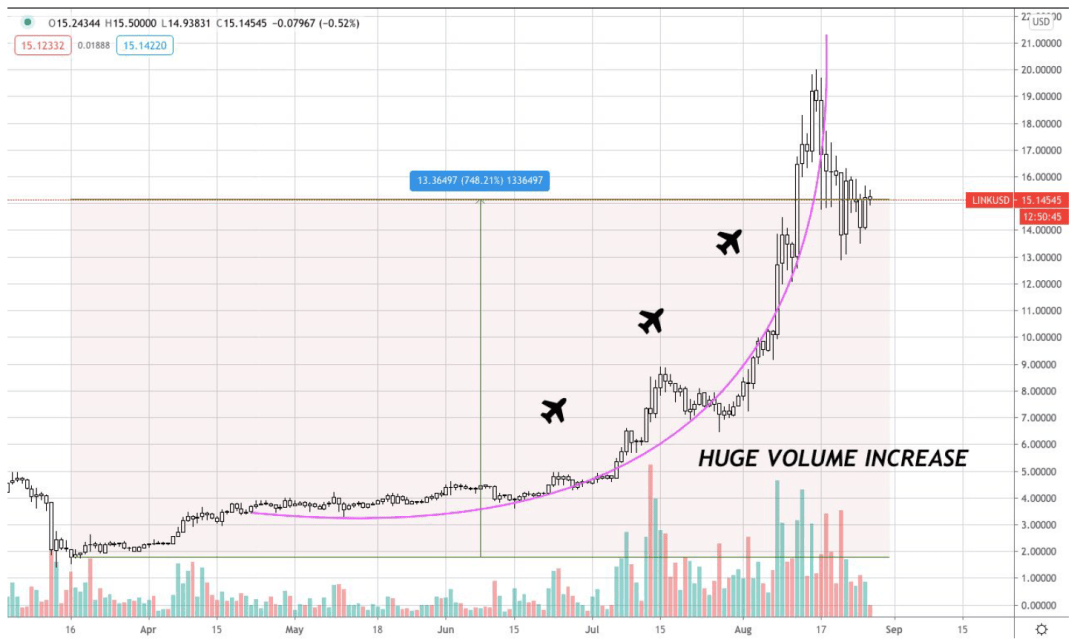
LINK/USD huge increase
Recently, LINK appeared to form a bullish pennant pattern and hold it as support. Subsequently, the micro intraday trend formed the top resistance of the pennant shown in the chart below.
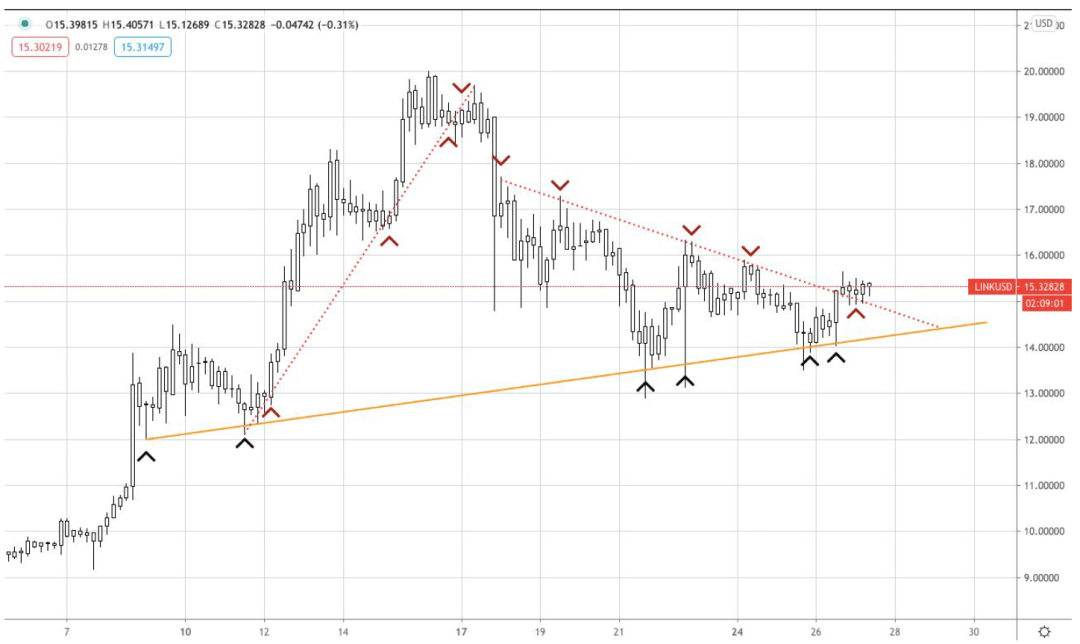
LINK/USD intraday trends and underlying support
This bullish fork line recently broke positively and found support from the downside resistance of the fork line. This is a major bullish signal, but only if LINK does not re-enter that fork, or break below the $13 support.
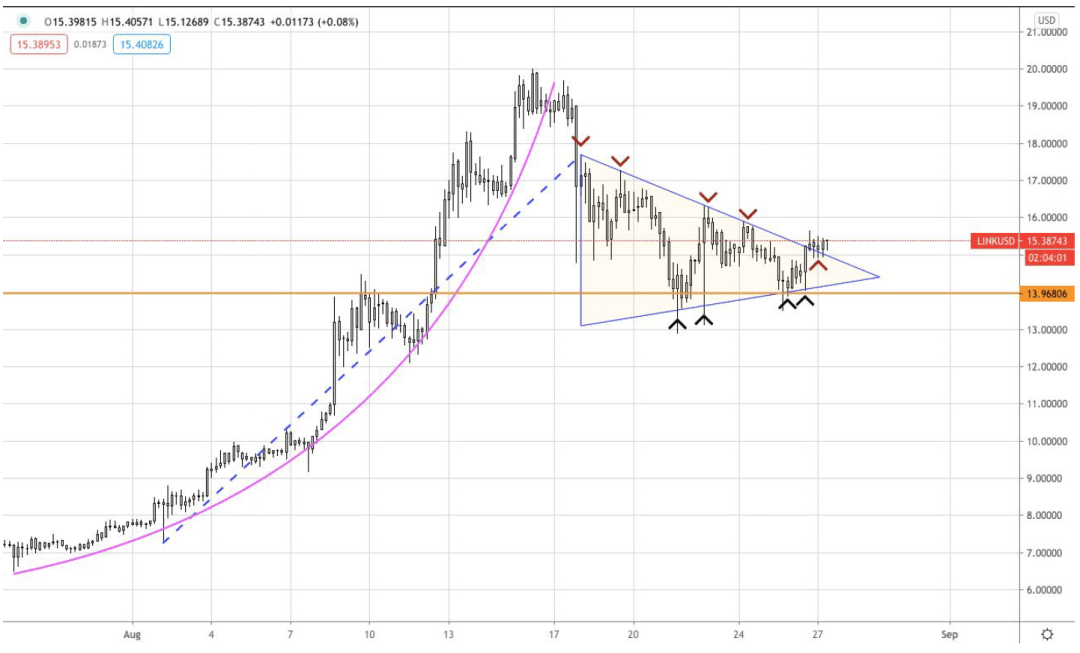
LINK/USD pennant
Therefore, from the current technical analysis, LINK is very bullish. The bull market since March is obviously impulsive. It looks like LINK is about to start its fifth impulsive move. Although as mentioned earlier, it depends on LINK staying above the $13 support. This wave should see LINK break all-time highs, and depending on the size of the move, could see LINK challenge USDT and XRPs for 3/4 of the way on CoinGecko.
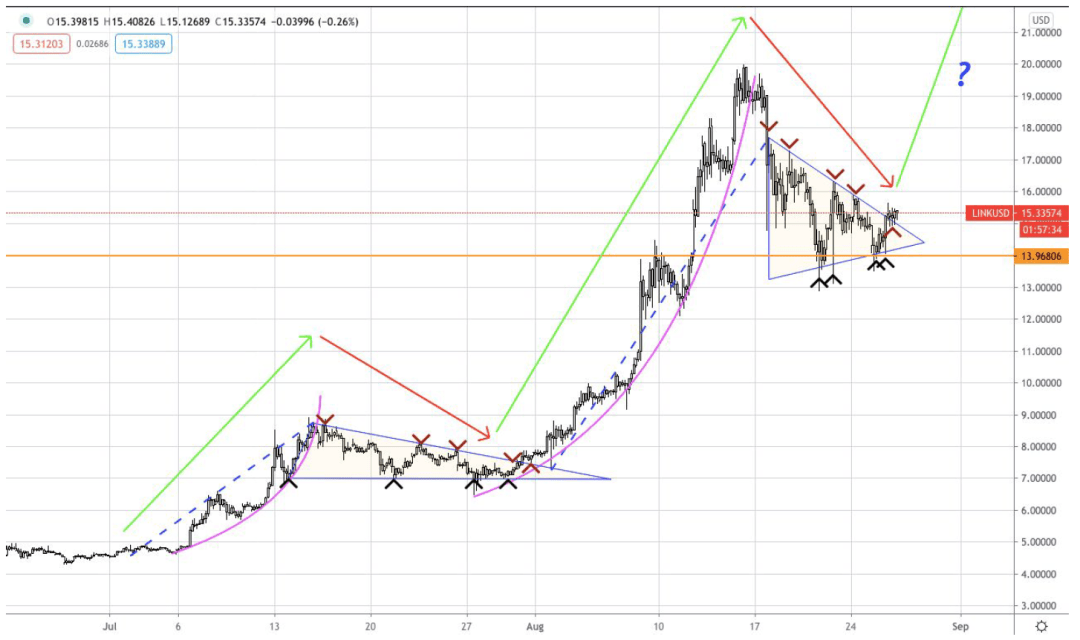
LINK/USD 5th wave incoming
So, with the current pattern looking very bullish, what are the indications on the indicators? Will they support LINK breaking the top of the pinnacle, or will it attempt to drag LINK below the $13 support level?
LINK price indicator
Group 1 – Ichimoku, KCs, WWV, Gann HL
KCs ---- LINK stays in the positive hyperextension region of KCs for a long time. However, during the latest pullback, the LINK index is back in the channel. During this pullback, LINK has found support at the midline, which suggests that LINK will not fall into the lower zone of KCs. This indicator is bullish.
Ichimoku - the clouds are green and the LINK candle is still far above the clouds. However, if the Ichimoku cloud turns bearish, LINK is likely to drop to around $10, which would represent a 33% loss from our current price. This speaks to the question of the validity of the indicator in this case. The indicator is bullish.
Gann HL - Gann HL has been bullish for an incredible 66 days. HL remains bullish, although the gap between it and the candle is definitely narrowing. A similar situation happened in late July, which then saw LINK go from $7 to $20. Indicators are bullish.
WWV - WWV is currently red and has had a long red period. This period appears to be coming to an end, as evidenced by a definite curve closing. However, the indicator remains bearish for now.
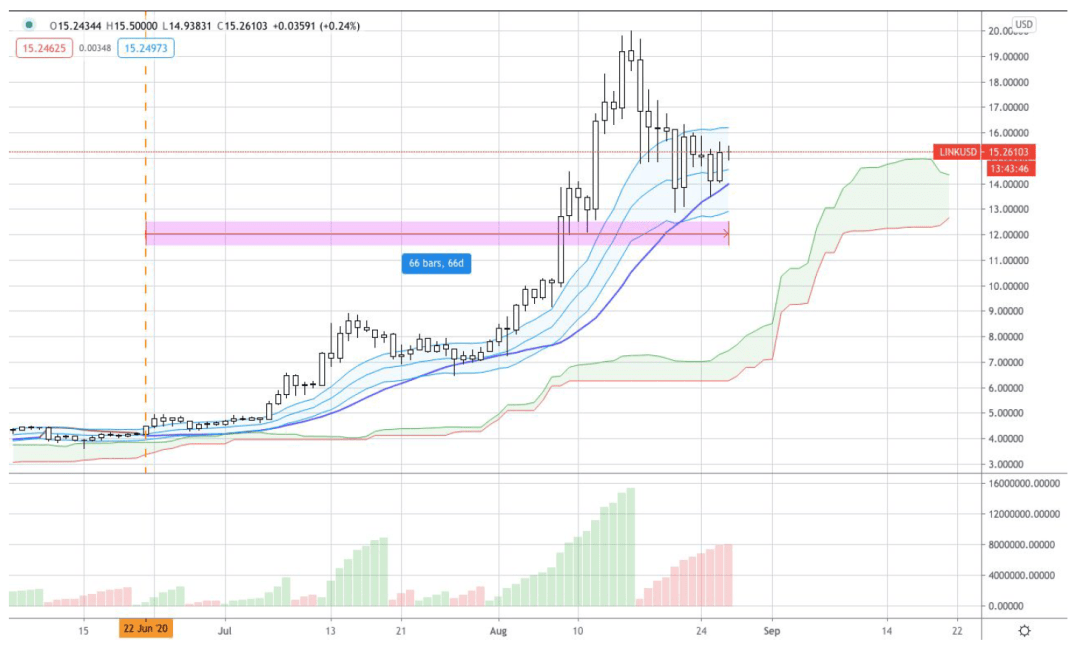
LINK/USD indicators – Ichimoku, KCs, WWV, Gann HL
Group 2 – PnF, SAR, BBs, QQE MT4
PnF - PnF is currently red. It hasn't had a buy/sell signal since a buy signal in early August. Indicators are bearish.
SAR - The SAR is currently above the candlesticks and has a large distance from the candlesticks. This suggests that the current momentum is in a bear market. This indicator is bearish.
QQE MT4--In the upper area (X>50) of QQE MT4, there is a cross between the red line and the yellow line. The red line has moved above the yellow line, so the indicator is currently bearish.
BBs – The upper region of BBs acted as a major resistance for LINK during its recent huge move, preventing the coin from further gains. Recently LINK has found the support of the central 20-day moving average, rejecting the bear market’s attempt to push LINK lower. This indicator is bullish.
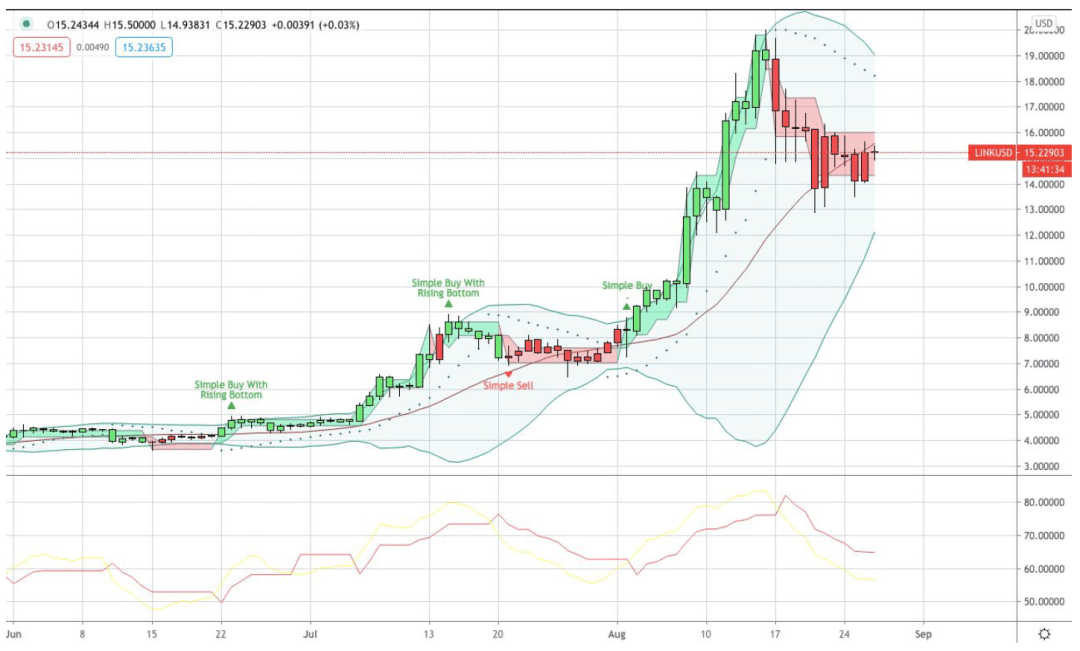
LINK/USD indicators set 2 – PnF, SAR, BBs, QQE MT4
LINK price indicator summary table
Indicators bullish/bearish table
Indicator Analysis Summary
LINK's indicators are completely bullish and bearish. The 20-day moving average has provided a lot of support for LINK recently, and it may also be the main driving force for LINK to turn from falling to rising when it tries to break through the all-time high price again.
LINKtarget price
Bullish target price
$19 +26% -- To break $19, LINK would need to break resistance at $16. This should be relatively easy since LINK has indicator support and a recent pennant pattern. There is a good chance that $19 will be broken down.
$16 +9% - With 4 bullish indicators and a very bullish fork pattern, LINK should find it easy to reach $16 after seeing the huge demand for the cryptocurrency recently. All bearish indicators will turn bullish on a move to $16, which would make it very easy for LINK to push further. The odds of $16 being hit are very high.
neutral target price
$14 -7.8% - $14 is a neutral target as it sits above recently formed support. It is also the R3 (bullish) target for PPs. The probability of this target being hit is medium, but it would not signal the end of the bullish run.
Bearish target price
$11 - 25% - If $11 is broken by LINK, it could prove the end of the bullish DeFi period. To do this though, LINK would need to break through support at $14, rejecting bullish formations and bullish indicators, all of which are unlikely.
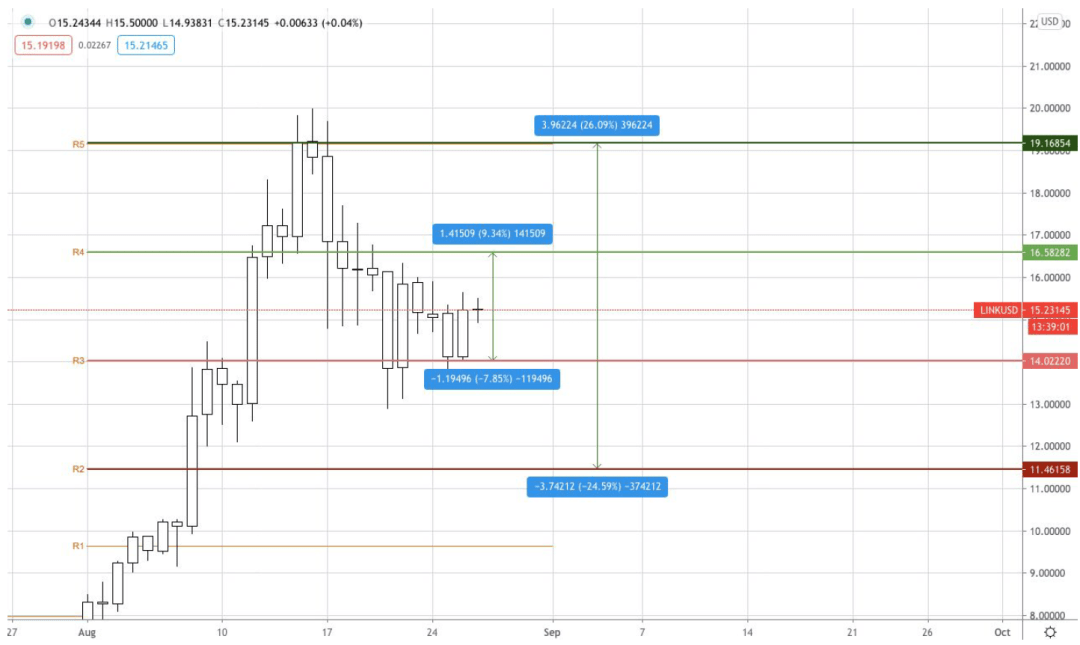
LINK/USD
LINK/USD Target Price Summary Table
Price targets table
Target Price Summary
AAX is a digital asset exchange powered by LSEG Technology. AAX Academy is a user education channel created by AAX, which aims to help more users learn novice tutorials and understand the basics of blockchain.
About AAX Academy
AAX is a digital asset exchange powered by LSEG Technology. AAX Academy is a user education channel created by AAX, which aims to help more users learn novice tutorials and understand the basics of blockchain.